A photometric catalogue of galaxies in the cluster Abell 85. ††thanks: Based on plates scanned with the MAMA microdensitometer at CAI, Paris and on observations collected at the European Southern Observatory, La Silla, Chile ††thanks: Tables 1 and 2 are only available in electronic form at the CDS via anonymopus ftp to cdsarc.u-strasbg.fr (130.79.128.5) or via http://cdsweb.u-strasbg.fr/Abstract.html
Abstract
We present two catalogues of galaxies in the direction of the rich cluster ABCG85.
The first one includes 4,232 galaxies located in a region
from the cluster centre. It has been obtained from a list of more than
25,000 galaxy candidates detected by scanning a Schmidt photographic plate
taken in the BJ band.
Positions are very accurate in this catalogue but magnitudes are not.
This led us to perform CCD imaging observations in the V and R bands to
calibrate these photographic magnitudes. A second catalogue (805
galaxies) gives a list of galaxies with CCD magnitudes in the V and R bands
for a much smaller region in the centre of the cluster.
These two catalogues will be combined with
a redshift catalogue of 509 galaxies (Durret
et al. 1997) to investigate the cluster properties at optical wavelengths
(Durret et al. in preparation), as a complement to our previous X-ray studies
(Pislar et al. 1997, Lima–Neto et al. 1997).
Key words: Galaxies: clusters: individual: ABCG85; galaxies: photometry
1 Introduction
ABCG85 is a very rich cluster located at a redshift z=0.0555. We performed a detailed analysis of this cluster from the X-ray point of view, based on Einstein IPC data (Gerbal et al. 1992 and references therein). In the optical, no photometric data were available at that time, except for an incomplete photometric catalogue by Murphy (1984), and about 150 redshifts were published in the literature only after we completed our first X-ray analysis (Beers et al. 1991, Malumuth et al. 1992). We therefore undertook a more complete analysis of this cluster, with the aim of obtaining both photometric and redshift data at optical wavelengths and better X-ray data from the ROSAT data bank (Pislar et al. 1997, Lima–Neto et al. 1997). We present here our photometric data. The redshift catalogue is published in a companion paper (Durret et al. 1997a) and the analysis of all these combined optical data will be presented in Paper III (Durret et al. in preparation).
2 The photographic plate data
2.1 Method for obtaining the catalogue
We decided to obtain a photometric catalogue of the galaxies in the direction of the Abell 85 cluster of galaxies by first processing the field 681 in the SRC-J Schmidt atlas. This blue glass copy plate (IIIaJGG385) was investigated with the MAMA (Machine à Mesurer pour l’Astronomie) facility located at the Centre d’Analyse des Images at the Observatoire de Paris and operated by CNRS/INSU (Institut National des Sciences de l’Univers). In order to also get information on the neighbouring galaxy distribution, the central 55∘ area has been searched for objects using the on-line mode with the 10m step size available at that time. The involved algorithmic steps are well-known. They can be summarized as follows: first a local background estimate and its variance are computed from pixel values inside a 256256 window, then pixels with a number of counts higher than the background value plus three times the variance are flagged, which leads to define an object as a set of connected flagged pixels; an overlapping zone of 512 pixels is used in both directions for each individual scan. Although this method may appear rather crude, its efficiency is nevertheless quite high for properly detecting and measuring simple and isolated objects smaller than the background scale. The region where ABCG85 is located is not crowded by stellar images (), so that most of the objects larger than a few pixels can indeed be detected this way. The result was a list of more than 105 objects distributed over the 25 square degrees of the field bounded by 0h31mn30.4s 0h53mn10.6s and 12∘18’19.43” 7∘05’13.88” (equinox 2000.0, as hereafter), with their coordinates, their shape parameters (area, elliptical modelling) and two flux descriptors (peak density, sum of background-subtracted pixel values).
The astrometric reduction of the whole catalogue was performed with respect to 91 stars of the PPM star catalogue (Roeser & Bastian 1991) spread over the field, using a 3rd-order polynomial fitting. The residuals of the fit yielding the instrumental constants were smaller than 0.25 arcsecond and the astrometry of our catalogue indeed appears to be very good, as confirmed by our multi-object fibre spectroscopy where the galaxies were always found to be very close (2.0 arcseconds, i.e. 3 pixels) to the expected positions.
Since the required CCD observations were not available at that time, a preliminary photometric calibration of these photographic data has been done using galaxies with known total blue magnitude. The magnitude of stars is certainly much easier to define, but such high-surface brightness objects suffer from severe saturation effects on Schmidt plates when they are bright enough to be included in available photometric catalogues. So, 83 galaxies were selected from the Lyon Extragalactic Database (LEDA) in order to compare their magnitude to their measured blue flux. A small region around each of these objects was scanned and this image has been used: i) to identify the object among its neighbours within the coordinate list and ii) to assess the quality of the flux value stored in the on-line catalogue with respect to close, overlapping or merged objects. The 74 remaining undisturbed objects identified with no ambiguity came from eight different catalogues in the literature. Whatever the intrinsic uncertainties about the integrated MAMA fluxes are, systematic effects were found with respect to the parent catalogue in a flux versus magnitude plot, as well as discrepancies for some objects between the LEDA and the Centre de Données Astronomiques de Strasbourg (CDS) databases. Consequently, three catalogues including 12 objects were removed and the LEDA magnitude of 5 objects was replaced by a CDS value which seems in better agreement with their aspect and with the overall trend when compared to similar objects. Later, 7 objects far from the overall trend were discarded. These successive rejections resulted in a set of 55 objects distributed over a six magnitude range. The magnitude zero-point for our photographic catalogue was obtained by plotting the flux of these objects against their expected magnitude. A rms scatter of 0.34 mag was computed around the linear fit.
2.2 Classification of the objects
Most of the diffuse objects included in our main catalogue were automatically selected according to their lower surface brightness when compared to stars. As usual for glass copies of survey plates, the discrimination power of this brightness criterion drops sharply for objects fainter than approximately 19th magnitude, and so does the completeness of the resulting catalogue if no contamination is allowed for. The number of galaxy candidates brighter than this limit within the investigated area appeared, however, to be already large enough to get a much better view of the bright galaxy distribution than using the deeper but very incomplete catalogue published by Murphy (1984). Moreover, including faintest objects was not necessary for the redshift survey of the Abell85 cluster of galaxies we were planning (see Durret et al. 1997). Hence, no attempt was done to reach a fainter completeness limit. Nonetheless, in order to select galaxies, the decision curve which has been computed in the Flux vs. Area parameter space was fitted to the data so that some objects identified by Murphy from CCD frames as faint galaxies were also classified as galaxies by us. Next, a further test based on the elongation was performed in order to reject linear plate flaws or artefacts, as well as to pick bright elongated galaxies first classified as stars due to strong saturation effects. Finally, spurious detections occuring around very bright stars (area greater than 103 pixels) due to a wrong estimate of the local background were tentatively removed by checking their location with respect to these bright objects. In this way, a list of more than 25,000 galaxy candidates over the 25 square degrees of our SRC-J681 blue field was obtained.
The distribution of these galaxies is displayed in Fig.1 for objects brighter than B19.75. The Abell85 cluster is clearly visible, as well as several other density enhancements which are mostly located along the direction defined by the cluster ellipticity.
2.3 Completeness and accuracy of the classification

The differential luminosity distribution of the galaxy candidates indicates that the sample appears quite complete down to the B19.75 magnitude (see Fig.2). To go further, we first tested the completeness of this overall list by cross-identifying it with three catalogues from the literature (Murphy 1984, Beers et al. 1991, Malumuth et al. 1992) with the help of images obtained from the mapping mode of the MAMA machine. It appeared that: i) all but one galaxy of the Malumuth et al. (1992) catalogue of 165 objects are actually classified as galaxies, with a mean offset between individual positions equal to 1.100.06 arcsecond ; ii) 94% of the 35 galaxies listed by Beers et al. (1991) inside the area are included in our catalogue, only 2 bright objects which suffer from severe saturation being misclassified. Note that such an effect also caused 5 of the 83 galaxies chosen as photometric standards to be misclassified, which gives the same percentage as for the sample by Beers et al. The comparison with the faint CCD catalogue built by Murphy (1984) in the so-called band (quite similar to that obtained using a photographic IIIaF emulsion with a R filter) was performed only for objects which were visible on the photographic plate with secure identification (only uncertain X and Y coordinates are provided in the paper) and classified without any doubt as galaxies from our visual examination. There remained 107 objects out of 170, among which 88 are brighter than B19.75 (18.5). Down to this flux limit, 82 objects (93%) are in agreement, thereby validating the choice of our decision curve in the Flux vs. Area parameter space. These cross-identifications therefore indicate that the completeness limit of our catalogue is about 95% for such objects, as expected from similar studies at high galactic latitude.
In order to confirm this statement and to study the homogeneity of our galaxy catalogue, we then decided to verify carefully its reliability inside the region of the Abell85 cluster of galaxies itself. The centre of ABCG85 was assumed to be located at the equatorial coordinates given in the literature, 0h41mn49.8s and 9∘17’33.”, and a square region of 1∘ around this position was defined; such an angular distance corresponds to 2.7Mpch at the redshift of the cluster (0.0555). However, let us remark that the position of the central D galaxy is slightly different, 0h41mn50.5s and 9∘18’11.”, and so is the centre we found from our X-ray analysis of the diffuse component of this cluster, i.e.: 0h41mn51.9s and 9∘18’17.” (Pislar et al. 1997). For all our future studies, we then chose to define the cluster centre as that of this X-ray component.
The distribution of the 4,100 candidates within the area has been first of all visually inspected to remove remaining conspicuous false detections around some stars as well as some defects mainly due to a satellite track crossing the field. This cleaned catalogue contains a little more than 4,000 galaxy-like objects, half of which brighter than B19.75. The intrinsic quality of this list has then been checked against a visual classification of all the recorded objects within a 11’25” area covering the region already observed by Murphy (1984) around the location 0h41mn57.0s and 9∘23’05”. The inspection of the corresponding MAMA frame of 20482048 pixels enabled us to give a morphological code to each object, as well as to flag superimposed objects and to deblend manually 10 galaxies (new positions and flux estimates for each galaxy member). Of course, the discrimination power of this visual examination decreases for star-like objects fainter than B18.5 (17.3) due to the sampling involved (pixel size of 0.67”), and an exact classification of such objects appeared to be hopeless above the a priori completeness limit of our automated galaxy list guessed to be B19.75. Down to this limit, our results can be summarized as follows: i) 94% of the selected galaxies are true galaxies (including 7 multiple galaxies and 2 mergers with stars), while 4% may be galaxies; ii) 7 genuine galaxies are missed (4%). Since these contamination and incompleteness levels of 5–6% were satisfactory, we decided to set the completeness limit for our automated galaxy catalogue at this magnitude B19.75.
2.4 The photographic plate catalogue

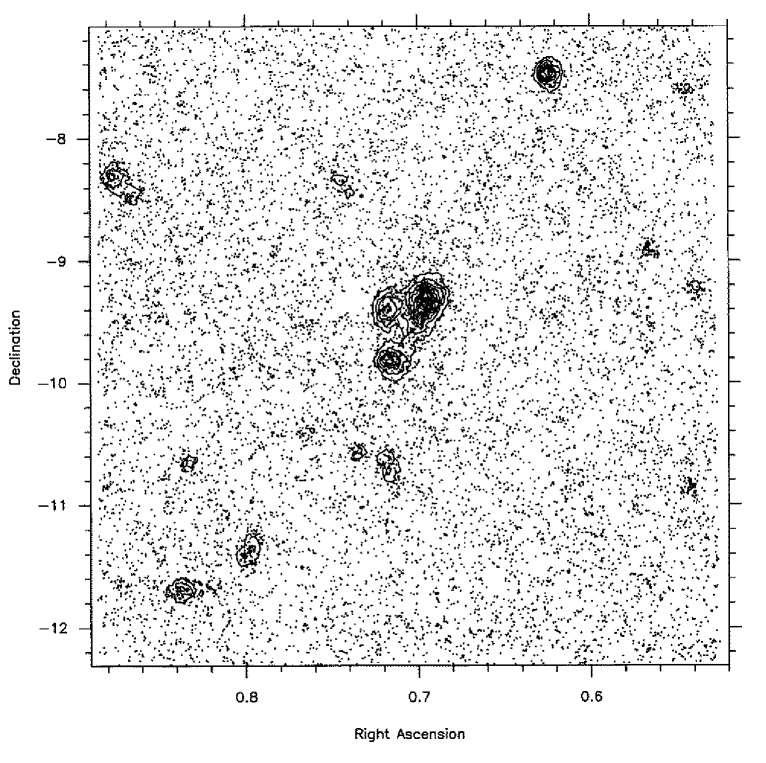
For objects fainter than our completeness limit, the visual check of the inner (11’25”) part of our object list has enabled us to confirm the galaxy identification of 135 galaxy candidates as well as to select 214 misclassified faint galaxies. The total number of galaxies included in the visual sample down to the detection limit is 541, whereas the initial list only contains 338 candidates within the same area. Keeping in mind that both catalogues are almost identical for objects brighter than B19.75, we decided to replace the automated list by the visual one inside this 11’25” central area. Note that about 150 objects remained unclassified, including 26 galaxies from the CCD list by Murphy. We added these 26 galaxies to the final catalogue whose galaxies are plotted in Fig.3.
Table1 lists the merged catalogue of 4,232 galaxies obtained from the SRC-J681 plate in the field of ABCG85, with V and R magnitudes computed using the transformation laws obtained from our CCD data (see §3.3). This Table includes the following information: running number; equatorial coordinates (equinox 2000.0); ellipticity ; position angle of the major axis; BJ, V, and R magnitudes; X and Y positions in arcsecond relative to the centre defined as that of the diffuse X-ray emission of the cluster (see above); cross-identifications with the lists by Malumuth et al. (1992), Beers et al. (1991) and Murphy (1984).
3 The CCD data
3.1 Description of the observations

The observations were performed with the Danish 1.5m telescope at ESO La Silla during 2 nights on November 2 and 3, 1994 (the third night was cloudy, and this accounts for the missing fields in Fig.4). A sketch of the observed fields is displayed in Fig.4. Field1 was centered on the coordinates: 00h41mn46.00s, 20’10.0” (2000.0). There was almost no overlap between the various fields (only a few arcseconds). The Johnson V and R filters were used. Exposure times were 10mn for all fields; 1mn exposures were also taken for a number of fields with bright objects in order to avoid saturation. The detector was CCD#28 with 10242 pixels of 24m, giving a sampling on the sky of 0.377”/pixel, and a size of 6.46.4arcmin2 for each field. The seeing was poor the first night: 1.5–2” for fields 1 and 2, 2–3” for field 3 (in which consequently the number of galaxies detected is much smaller), and good the second night: 0.75–1.1”. On the other hand, the photometric quality of the first night was better than that of the second one. However, the observation of many standard stars per night made a correct photometric calibration possible even for the second night as indicated by a comparison with an external magnitude list: the photometric catalogues from the six fields have the same behaviour for both nights (see e.g. Fig.8).
3.2 Data reduction
Corrections for bias and flat-field were performed in the usual way with the IRAF software. Only flat fields obtained on the sky at twilight and dawn were used; dome flat fields were discarded because they showed too much structure.
Each field was reduced separately. The photometric calibration took into account the exposure time, the time at which the exposure had been made, the color index (V-R), the airmass, and a second order term including both the color index and airmass. The photometric characteristics of both nights were estimated separately.
Objects were automatically detected using the task DAOPHOT/DAOFIND. This task performs a convolution with a gaussian having previously chosen characteristics, taking into account the seeing in each frame (FWHM of the star-like profiles in the image) as well as the CCD readout noise and gain. Objects are identified as the peaks of the convolved image which are higher than a given threshold above the local sky background (chosen as approximately equal to 4 of the image mean sky level). A list of detected objects is thus produced and interactively corrected on the displayed image so as to discard spurious objects, add undetected ones (usually close to the CCD edges) and dispose of false detections caused by the events flagged in the previous section. Since exposure times were the same in V and R, the number of objects detected in the R band is of course much larger.

We used the package developed by O.Le Fèvre (Le Fèvre et al. 1986) to obtain for each field a catalogue with the (x,y) galaxy positions, isophotal radii, ellipticities, major axis, position angles, and V and R magnitudes within the 26.5 isophote. Star-galaxy separation was performed based on a compactness parameter q determined by Le Fèvre et al. (1986, see also Slezak et al. 1988), as described in detail e.g. by Lobo et al. (1997). We chose q=1.45 as the best separation limit between galaxies and stars; very bright stars were classified as galaxies with this criterion and had to be eliminated manually. After eliminating repeated detections of a few objects, we obtained a total number of 805 galaxies detected in R, among which 381 are detected in V. The errors on these CCD magnitudes are in all cases smaller than 0.2 magnitude, and their rms accuracy is about 0.1 magnitude; these rather large values are due to the bad seeing during the first night and to pretty poor photometric conditions during the second night.
Positions of the galaxies detected in the R band relative to the centre defined above are displayed in Fig.5. Notice the smaller number of galaxies detected in field 3 due to a sudden worsening of the seeing during the exposure on this field. The astrometry of this CCD catalogue is accurate to 1.5–2.0 arcseconds as verified from the average mutual angular distance between CCD and MAMA equatorial coordinates for 174 galaxies included in both catalogues.

The histogram of the R magnitudes in the CCD catalogue is displayed in Fig.6. It will be discussed in detail in PaperIII (Durret et al. in preparation). The turnover value of this histogram is located between R=22 and R=23, suggesting that our catalogue is roughly complete up to R=22.
The (V-R) colours are plotted as a function of R for the 381 galaxies detected in the V band in our CCD catalogue (Fig.7). Unfortunately, since the observed CCD field is small, there are only 50 of these galaxies with measured redshifts, and therefore it is not possible to derive a colour-magnitude relation from which to establish a membership criterion for the cluster.

3.3 Transformation laws between the photometric systems
576 stars were also measured on the CCD images and used to calculate calibration relations between our photographic plate BJ magnitudes and our V and R CCD magnitudes.
For stars:
For galaxies where only R is detected:
For galaxies where both V and R are detected:
The observed R band CCD magnitude as a function of the R magnitude calculated from the photographic BJ magnitude is plotted in Fig.8 for galaxies, showing the quality of the correlation for the six different CCD fields, especially for objects brighter than R19. All the CCD fields appear to behave identically.

3.4 The CCD catalogue
The CCD photometric data for the galaxies in the field of ABCG85 are given
in Table2. This Table includes for each object the following information:
running number; equatorial coordinates (equinox 2000.0); isophotal radius;
ellipticity; position angle of the major axis; V and R magnitudes; X and
Y positions in arcsecond relative to the centre assumed to have coordinates
and
18’17.0” (equinox 2000.0) (this centre was chosen to
coincide with that of the diffuse X-ray gas component as defined by Pislar
et al. (1997) ).
4 Conclusions
Our redshift catalogue is submitted jointly in a companion paper (Durret et al. 1997). Together with the catalogues presented here, it is used to give an interpretation of the optical properties of ABCG85 (Durret et al. in preparation, PaperIII), in relation with the X-ray properties of this cluster (Pislar et al. 1997, Lima–Neto et al. 1997, PapersI and II).
-
Acknowledgements.
We are very grateful to the MAMA team at Observatoire de Paris for help when scanning the photographic plate, and to Cláudia Mendes de Oliveira for her cheerful assistance at the telescope. CL is fully supported by the BD/2772/93RM grant attributed by JNICT, Portugal.
References
- 1 Beers T.C., Forman W., Huchra J.P., Jones C., Gebhardt K. 1991, AJ 102, 1581
- 2 Dressler A. 1980, Ap J 236, 351
- 3 Durret F., Felenbok P., Lobo C., Slezak E. 1997, A&AS submitted
- 4 Gerbal D., Durret F., Lima-Neto G., Lachièze-Rey M. 1992, A&A 253, 77
- 5 Le Fèvre O., Bijaoui A., Mathez G., Picat J.P., Lelièvre G. 1986, A&A 154, 92
- 6 Lima-Neto G.B., Pislar V., Durret F., Gerbal D., Slezak E. 1997, A&A in press
- 7 Lobo C., Durret F., Gerbal D. et al. 1997, A&AS 122, 409
- 8 Malumuth E.M., Kriss G.A., Van Dyke Dixon W., Ferguson H.C., Ritchie C. 1992, AJ 104, 495
- 9 Murphy P. 1984, MNRAS 211, 637
- 10 Pislar V., Durret F., Gerbal D., Lima-Neto G.B., Slezak E. 1997, A&A 322, 53
- 11 Roeser S., Bastian U. 1991, PPM Star Catalogue, Spektrum Akademischer Verlag (Heidelberg, Berlin, New-York)