Abstract
We describe large scale structure at high redshift in terms of the Cosmic Web picture for CDM models: how galactic-scale “peak-patches”, filaments and membranes create an interconnected intergalactic medium. The ideas are applied to our Ly forest simulations of “shear-field patches”. We discuss simulation method and design, resolution dependence, the statistical combination of patches, UV flux scaling, and whether filtered Zel’dovich maps are useful. The response to changes in power spectrum shape and amplitude, and in cosmological parameters, is described. We also show derived from UV rescaling is overestimated if the resolution is not adequate.
Lyman Alpha Absorption in The Cosmic Web
1Canadian Institute for Theoretical Astrophysics and
Department of Astronomy,
University of Toronto, 60 St. George St., Toronto,
ON M5S 3H8, Canada
1 The Cosmic Web and Peak-Patches at High Redshift
The Cosmic Web picture [1] provides a powerful language for understanding the structure and evolution of Lyman Alpha absorption systems [2]. It predicts the basic structural components of the IGM as a function of scale, epoch and cosmology. For density contrasts , the rare-events at are massive galaxies, observed as damped Ly absorbers, while the typical collapsed objects are dwarf galaxies responsible for Lyman Limit and metal line systems. The medium is visually dominated by filaments, bridging massive galaxy peaks, with smaller scale filaments within the larger scale ones bridging smaller dwarf galaxies contributing the most to the Ly forest.
-body calculations cannot currently cover large enough volumes of space with sufficient resolution to simulate high redshift galaxy catalogues (with clustering) to compare with e.g., the Steidel et al. structure at [3]. Only intermediate and small scale structures are accessible to direct gasdynamical simulations of the Ly forest. A peak-patch catalogue with ultralong waves included can treat such large volumes quickly and accurately [4]. Galaxy halos are identified with regions of space determined to have collapsed using ellipsoidal internal dynamics, with external tidal fields playing a large role. Bulk properties like mass, binding energy, velocity and shear for the patches follow, and can be used with single-patch hydrodynamics or phenomenology to predict internal gas profiles. Field realizations constrained to have interesting multiple peak/void structures can be used as initial conditions for high resolution numerical simulations, e.g. the strong filament of galaxies in [2].
In Fig. 1, we show the (impressively grand) large scale clustering in galaxies at various velocity dispersion cuts, in comoving space and in redshift space. Motivated by [3], we tiled regions from =2.8 to 3.5 encompassing with 1283, 40 Mpc boxes. The size was chosen to resolve “dwarflet” peak-patches with binding energy . Depending upon cosmology (Table 1), 15 to 22 boxes were needed. (Tiling for open (hyperbolic) universes is an interesting exercise.) Optimal wavenumber sampling was used (§ 2), with phase coherent ultralong and short waves consistently joining box to box.


| Cosmology | H0, Age | Notes | ||
|---|---|---|---|---|
| SCDM | 0.67,0.44,1.0 | 50, 13 Gyr | 1.0 | |
| CDM | 0.93, 0.91 | 70, 13 Gyr | 0.335 | =0.665,, |
| OCDM | 0.81, 0.91 | 70, 11 Gyr | 0.37 | |
| HCDM | 0.81 | 50, 13 Gyr | 0.8 | , 2 degenerate species |
Our “shear-patch” gas simulations sample the Fig. 1 space only over small high resolution cores 5 Mpc across (encompassing a fixed cosmology-independent baryonic mass of ), but our images of etc. (see [2, 13]) reveal the cosmic web: In the most probable shear-patches, the typical IGM at is dominated by filamentary structures fixed in comoving space with large dwarf galaxies (, , ) forming at the junctures and smaller dwarfs (, , ) littering the limbs. In less probable protogalactic shear-patches, the filaments merge, as part of larger scale filaments. In protovoid shear-patches, the webbing is less pronounced. CDM and OCDM have fatter ribbon-like filaments with fewer dwarflets compared to SCDM.

2 Ly Forest Simulations of “Shear-field Patches”
Optimal -space sampling: The flatness of the power spectrum, , for wavelengths means that small periodic boxes must exclude substantial large scale power, and can probe only a restricted set of shearing patches. We use a hybrid method for applying waves to the initial conditions, with special attention to the correct inclusion of long waves [4]: an FFT is used for short waves, but slow direct transforms are used with power law and log sampling for low , with switching defined by a -space volume minimization criterion.
Importance Sampling: Since a single small box is a poor sample of the universe, we use a number of shearing patch simulations for each cosmology to be tested, each parameterized by a smoothed overdensity () and anisotropic shear tensor. The Gaussian filter =0.5 Mpc subtends a galaxy mass, . We have found that using a relatively small sample of , , with the anisotropic shears taken at their mean values given , gives adequate statistical convergence on quantities such as the frequency distribution of , provided the simulations are given their proper relative weighting. The weighting of -bin is in initial condition space, but in the dynamically evolved space it must be multiplied by the angle on the sky subtended by the region and the length in redshift space. The negative (void) cases expand and thus contribute more, reducing the frequency of lines in the combined sample relative to what an average density simulation would give. Overdense regions are more compact and contribute large numbers of high column lines to the statistics (e.g., the =1.4 protogalactic patches form collapsed massive galaxies just below ).
SPH-TreeP3M. The simulations reported here used a new code, combining an FFT for the P-M [6] with a tree-like P-P, which is twice faster than the SPH-P3MG code used in our earlier work [2], and with more accurate forces. Our high resolution 5.0 Mpc diameter patches had gas and dark matter particles (initial grid spacing of 100 comoving kpc), surrounded by gas and dark particles with 8 times the mass to 8.0 Mpc, in turn surrounded by “tidal” particles with 64 times the mass to 12.8 Mpc. A linearly-evolved self-consistent external shear field was included to treat ultralong waves. SPH is adaptive: our best resolution is set by the gravitational softening of 1 kpc.
Numerical convergence is fundamental but has been largely neglected in previous studies. Simulations with the same initial conditions, but 100, 50 and 25 comoving kpc initial spacing, show our standard 100 kpc computations are close to convergence in the images and in the column density distribution , but of course not in small scale dark matter clumping. However, tests halving the initial resolution to 200 kpc initial spacing show a significantly lowered mean opacity and fail to produce small dwarf galaxies (removing objects below ).
3 Ly Forest Response to Varying Physical Parameters
We have varied cosmology, UV flux history and power spectrum shape and amplitude [13] while keeping the random number choices for the initial wave phases and the simulation size fixed, to facilitate comparisons.
The flux decrement one-point distribution: , , is determined mainly by the mean opacity and is insensitive to choices of cosmology. Fitting the observed well after rescaling is all too easy; we have even shown that data from other redshifts can be rescaled to fit it. (Although we use the full to rescale, just scaling to gives identical results.)
UV flux history: We have tested how well the much-used opacity rescaling by actually works, by evolving identical patches except for the flux history. We find it works quite well in the intercloud filamentary regime but can fail in halos (the traditional clouds), where the Jeans Mass history is important, and thus can fail for the higher column lines.111We have also shown the truncated Zel’dovich map with a global filter and , gives images which differ radically from our simulations. Allowing to vary reproduces for low , a testament to the forgiving nature of the distribution with UV flux rescaling (cf. [9]).
and UV flux: Fig. 3 shows the scaling parameter for the four cosmologies for . At , ranges from for CDM to for OCDM. Note that our one-third-resolution results (labeled Low Res SCDM) give a significantly higher estimate; the estimate labeled Croft [12] also had about this resolution, partly explaining why it is high, but also a colder thermal history. We also note that the higher flux or lower needed to scale CDM that we see follows from the slower expansion rate at high redshift than SCDM has (cf. the Cen result [12]).
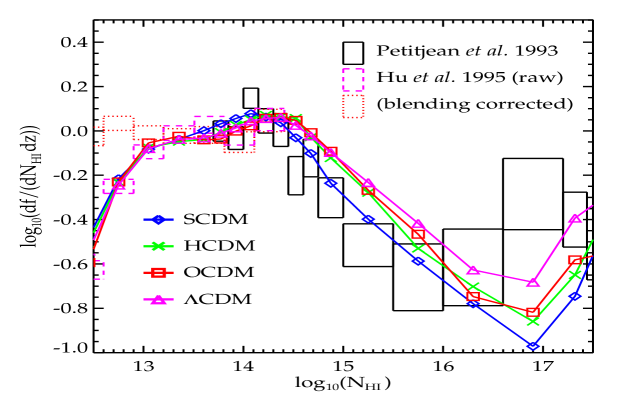
Column density distribution: Fig. 3 shows that with the rescaled UV flux, is well-fit by all 4 cosmologies tested. They are visually different, which higher-point statistics (e.g. 2-point [5]) can better reveal. The were generated from automated Voigt profile fits to simulated spectra. Each curve represents the weighted composite of the 5 simulations. Our simulated results do exhibit an evolutionary trend in the Ly line counts similar to the Keck observations of [10], a consequence here of the shift in the knee in the distribution apparent at 10, which marks the transition from filamentary IGM material to the halos of dwarf galaxies.
Variation: For SCDM, we varied the overall power spectrum amplitude: =0.7,1.58 as well as 1.05. Although dramatically different in visual appearance at the same redshift, with UV rescaling the distributions look rather similar at low . The required scaling is larger than for the cosmology variations with fixed of Fig. 3. The median in the line width, , is higher for 1.58, and lower for 0.7, cf. the 1.05 case (with median , as for CDM).
References
- [1] Bond, J.R., Kofman, L., & Pogosyan, D. 1996, Nature 380, 603
- [2] Bond, J.R. & Wadsley, J.W. 1997, in Computational Astrophysics, p. 323, Proc. 12th Kingston Meeting, ed. D. Clarke & M. West (PASP), astro-ph/970312; Wadsley, J.W. & Bond, J.R. 1997, ibid, p. 332, astro-ph/9612148
- [3] Steidel, C.C. et al. 1997, astro-ph/9708125
- [4] Bond, J.R. & Myers, S. 1996, ApJSuppl 103, 1
- [5] Zuo, L & Bond, J.R. 1994, ApJ 423, 73
- [6] Couchman, H. 1991, ApJLett 368, L23
- [7] Haardt, F. & Madau, P. 1996, ApJ , 461, 20
- [8] Hu, E. et al. 1995, ApJ 466, 46
- [9] Hui, L., Gnedin, N. & Zhang, Y. 1997, ApJ 486, 599
- [10] Kim, T-S., Hu, E., Cowie, L. & Songaila, A. 1997, AJ 114, 1
- [11] Petitjean, P. et al. 1993, MNRAS 262, 499
- [12] Rauch. M. et al. 1997, ApJ , in press, astro-ph/9612245
- [13] Wadsley, J.W. & Bond, J.R. 1997, in preparation.