03 (11.01.2; 11.09.1; 11.09.1; 11.09.2; 11.19.3; 13.25.2) \offprintsH. Schulz, Bochum address 11institutetext: Astronomisches Institut der Ruhr-Universität, D-44780 Bochum, Germany 22institutetext: Department of Physics and Astronomy, Dartmouth College, Hanover, NH 03755, U.S.A. 33institutetext: Max-Planck-Institut für Extraterrestrische Physik, Postfach 1603, D-85740 Garching, Germany 44institutetext: Space Sciences Laboratory, Berkeley, CA 94720, U.S.A.
ROSAT evidence for AGN and superwind activity in NGC 6240 and NGC 2782
Abstract
We present ROSAT observations of the starburst galaxy NGC 2782 (HRI plus a weak PSPC frame) and the ultraluminous infrared galaxy NGC 6240 (PSPC). The (0.1–2.4) keV spectra of both objects appear similar. However, due to better sampling spectral modeling is only warranted in case of NGC 6240 for which both a single thermal Raymond-Smith model () or a hybrid model consisting of 80% power-law with the canonical photon index plus 20% Raymond-Smith contribution () lead to good fits. However, the single thermal model turns out to be unlikely because it yields a luminosity of erg s-1, which is hard to reach in a starburst superwind–scenario. The hybrid model leads to a more moderate luminosity of erg s-1, of which erg s-1 can be attributed to shocked superwind gas. We link the remaining erg s-1 powerlaw to an AGN component because the alternative of inverse-compton scattering of the FIR radiation leads to a too low flux when estimated with available data. The result appears to be consistent with preliminarily announced ASCA observations.
For NGC 2782 we find (0.1–2.4 keV) = erg s-1 (within a factor of four) which can be explained by emission from a shocked superwind region with a high preshock density in agreement with earlier optical evidence for an outflowing supershell.
keywords:
Galaxies: active – Galaxies: interactions – Galaxies: starburst – Galaxies: individual: NGC 2782, NGC 6240 – X-rays: galaxies1 Introduction
Seyfert (1943) included NGC 2782 in his famous list of galaxies which ”show spectra having many high-excitation emission lines localized in the nuclei”. However, Balzano’s (1983) observations showed a more HII-region like spectrum and, hence, she classified NGC 2782 as a starburst galaxy. Nevertheless, early high-resolution spectroscopy revealed line-width differences (Sakka et al. 1973; Kennicut et al. 1989) that were attributed to an additional high-excitation component. Boer et al. (1992) identified the latter component as an expanding shell driven by a series of supernova explosions in the starburst nucleus. Kinney et al. (1984) measured an Einstein IPC-band (0.2–4 keV) luminosity of 1.2 1041 or 8 1041 erg s-1 for assumed power-law flux distribution indices of and , respectively. Boer et al. found the observed X-ray luminosity too high as compared to other indicators of the strength of the nuclear starburst. Therefore a pointed ROSAT observation was proposed by B.B. and H.S., which will be discussed in the present work.
NGC 6240 is a morphologically peculiar and probably interacting galaxy with two apparent nuclei (Fried & Schulz 1983). A more than 8 kpc extended central region reveals a pronounced LINER-like spectrum and unusually broad (FWHM 200–900 km s-1) emission lines. (Fosbury & Wall 1979; Fried & Schulz 1983; Morris & Ward 1988, Keel 1990, Heckman et al. 1990, Veilleux et al. 1995, Schmitt et al. 1996). After detection of its huge far-infrared luminosity of (Wright et al. 1984) NGC 6240 has been considered as a super starburst galaxy (Joseph & Wright 1985; Rieke et al. 1985). In this vein, Heckman et al. (1987, 1990) suggested the presence of superwind activity. Recently, ISO observations confirmed the presence of a young starburst (Lutz et al. 1996).
However, there are suspicions of alternative or additional power sources like an obscured AGN (de Poy et al. 1986) or even ordinary starlight (Thronson et al. 1990). While the latter hypothesis has been ruled out (Shier et al. 1996) there is recent evidence from Hubble Space Telescope data for a high-excitation component indicative of a hidden AGN or a young mini starburst (Barbieri et al. 1993, Rafanelli et al. 1997). Also, preliminary X-ray data from ASCA suggest the presence of an AGN (Mitsuda 1995).
To date, no further X-ray data have been published for NGC 6240. Rieke (1988) inspected HEAO-1 data and gave an upper limit of erg s-1 cm-2 corresponding to erg s-1 in the (2–10) keV range. The ROSAT -PSPC data discussed below were taken from the archive.
Both objects have characteristics of a nuclear starburst and a possible AGN in common. An AGN could be important for the energy budget, in particular for the tremendous amount of FIR radiation from an ultraluminous infrared galaxy (ULIRG). Perhaps even more interesting, such an object might be the birthplace of a newly forming AGN as is suggested by the similar space densities of ULIRGs and QSOs (Sanders et al. 1988).
X-rays ought to be helpful in distinguishing between these two types of nuclear sources. Sources powered by a starburst wind shocking the dense shell and other ambient gas are usually expected to emit a soft thermal X-ray spectrum with a (0.1–2.4 keV) luminosity erg s-1 while objects exceeding this limit commonly show AGN tracers (e.g. Moran et al. 1994; Wisotzki & Bade 1997).
A power-law X-ray spectrum with a photon spectral index would be indicative of an AGN (e.g., Pounds et al. 1994, Nandra et al. 1997; Svensson 1994) (although AGNs may have thermal components or starburst components added). The luminosity of a typical type-1 AGN in the ROSAT band is about 3% of its bolometric luminosity.
Luminosities given below are calculated via plain application of the Hubble law with km s-1 Mpc-1 yielding Mpc and 144 Mpc for NGC 2782 and NGC 6240, respectively (when comparing luminosities or scales note that several recent papers on NGC 6240 assumed Mpc which would halve the luminosities given here).
2 Observations and data reduction
The data presented here were taken with the High Resolution Imager (HRI) and the Position Sensitive Proportional Counter (PSPC) on board of the X-ray satellite ROSAT . A detailed description of the ROSAT project, the satellite and its instrumentation can be found in Trümper (1983), Trümper et al. (1991), Pfeffermann et al. (1987) and Zombeck et al. (1990). In brief, the ROSAT satellite observes in the soft X-ray range between 0.1 and 2.4 keV. The spatial resolution of frames obtained with the HRI and PSPC is about and , respectively. Unlike the HRI, the PSPC has sufficient spectral resolution for obtaining information about the spectral shape.
2.1 NGC 2782
On April 18–20, 1992, a deep HRI X-ray image of NGC 2782 was taken with a total effective exposure time of 21.7 ksec. Via a standard source-detection procedure carried out with the EXSAS X-ray analysis software package (Zimmermann et al. 1994) we detected seven X-ray sources () in the field of view. In Table 1 the detections are summarized. The positions, the background subtracted HRI count rates, and the optical identifications of the sources are given.
| No. | RA (2000) | Dec (2000) | cts/s | optical identification | ||||
|---|---|---|---|---|---|---|---|---|
| 1 | 5\fs0 | +40\degr | 6\arcmin | 49\farcs5 | 6.420.58 | NGC 2782 core (2\arcsec) | ||
| 2 | 4\fs0 | +40\degr | 7\arcmin | 40\farcs5 | 1.390.29 | |||
| 3 | 23\fs8 | +40\degr | 5\arcmin | 4\farcs9 | 0.650.19 | gsc2987.00552 (18\arcsec) | ||
| 4 | 38\fs8 | +40\degr | 5\arcmin | 49\farcs3 | 0.980.26 | |||
| 5 | 52\fs4 | +40\degr | 13\arcmin | 15\farcs9 | 0.820.24 | |||
| 6 | 26\fs5 | +40\degr | 0\arcmin | 23\farcs3 | 0.750.23 | gsc2987.01040 (2\arcsec) | ||
| 7 | 46\fs3 | +40\degr | 3\arcmin | 6\farcs0 | 12.290.79 | |||
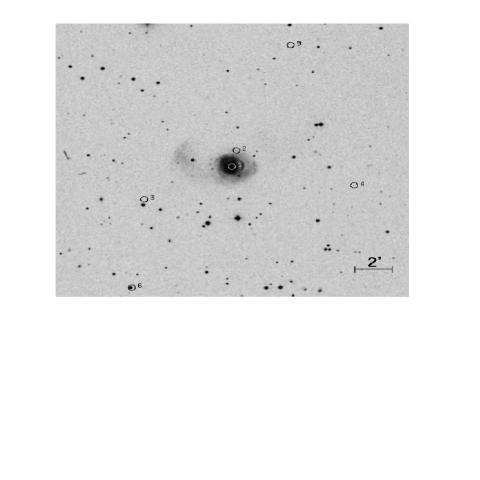
In Fig. 1 we plotted the X-ray source positions over the optical image of NGC 2782 taken from the digitized Palomar Sky Survey plates. The source numbers are identified in Table 1. The central source No. 1 is associated with the center of NGC 2782. A four times fainter source (No. 2) appears 88\arcsec north of the center of the galaxy. The association of No. 2 with NGC 2782 is unclear. It could be a foreground or background object. The X-ray light curves of both sources do not show any significant evidence for variability.
In addition to the HRI observation, NGC 2782 appears on an archived ROSAT PSPC frame (ROSAT observation number: WG701555P), taken on Nov. 8, 1993. During this 7 ksec exposure NGC 2782 was far off-axis in the field of view. Due to the reduced spatial resolution of the telescope away from the axis, sources No. 1 and 2 could not be separated. However, since No. 1 dominates the integrated X-ray flux crude information about its spectral shape can be retrieved from the PSPC frame.
To this end we extracted the source photons within a radius of 300\arcsec, corrected the data for telescope vignetting and detector dead-time, and binned the PSPC spectrum according to a constant signal-to-noise. For the background correction of the source spectrum we selected the counts of a ’source free’ region near NGC 2782. We then fitted the background subtracted PSPC spectrum with a single powerlaw taking into account the Galactic interstellar absorption towards NGC 2782 of cm-2 (Dickey & Lockman 1990). The best fit yields a photon index and an X-ray luminosity (0.1-2.4 keV) of log()=41.60.6. This does not mean that the spectrum actually is a powerlaw, but a spectral shape has to be assumed to obtain a flux.
2.2 NGC 6240
NGC 6240 was observed twice with the ROSAT PSPC, on Sept. 2–4, 1992 and Feb. 13–14, 1993. The source was located at the center of the field of view. The total exposure time is about 8 ksec.
For the data analysis, source photons were extracted within a circle of radius 150\arcsec. After removing all detected sources within the inner field of view the background was determined and subtracted. The data were corrected for vignetting and dead-time following standard prescriptions of the EXSAS software (Zimmermann et al. 1994). The source-countrate is about 0.06 cts s-1. For the spectral analysis source photons in the amplitude channels 11-240 were binned so that a constant signal/noise ratio of was secured. For the temporal analysis we chose time bins of 400 s which are the smallest ones to smear out the variations caused by the satellite’s wobble motion.
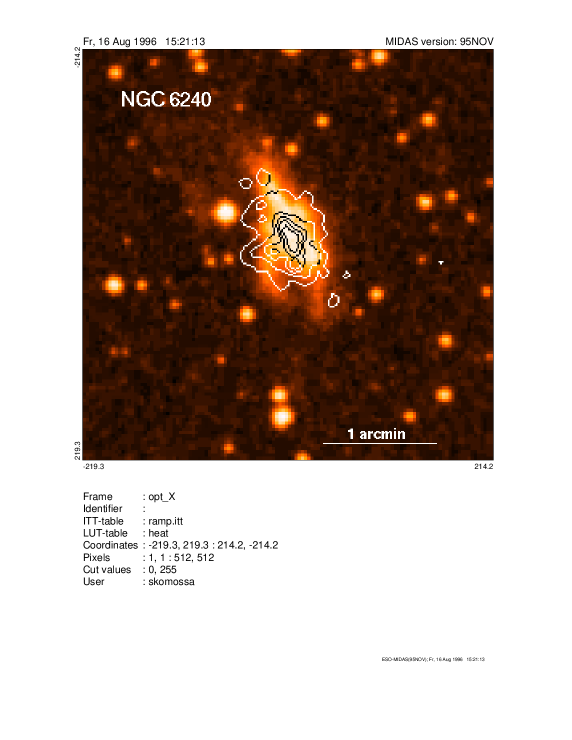
The X-ray isophotes for the 1992 exposure overlayed on the digitized POSS are shown in Fig. 6. The K5 star HD 152140 is the strongest X-ray source in both observations (mean countrate cts s-1). All other sources in the field are significantly weaker than NGC 6240. The K star was used to positionally align both frames.
3 Spatial analysis for the NGC 6240 frames
Approximating the source photon distribution by a Gaussian and representing the extent by the FWHM of this distribution, we find a value of 37\arcsec. This exceeds the width of the PSPC point spread functions for different channels. E.g., for a point source we determined FWHMs of 23\arcsec and 27\arcsec at channel 110 and 60, respectively. A notable extension beyond the PSF is present in all energy intervalls (soft as well as hard). To be sure, we additionally verified that the extent is not due to the electronic ghost imaging that widens the point spread function below 0.2 keV (Nousek & Lesser 1993). Consequently, the X-ray image obtained with the PSPC is extended in both observations.
The X-ray positions of both, NGC 6240 and the K star, agree with their optical positions (as given in SIMBAD) within less than one arcsec for the 1993 observation. In the 1992 data, both X-ray positions are shifted by 10\arcsec relative to their optical positions. This shift can be traced back to the known boresight error of the telescope (Briel et al. 1994) and has been corrected for in the overlay of the X-ray contours on the optical image (Fig. 6).
4 Temporal analysis for the NGC 6240 frames
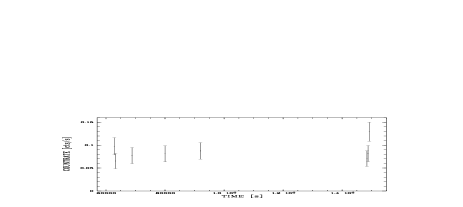
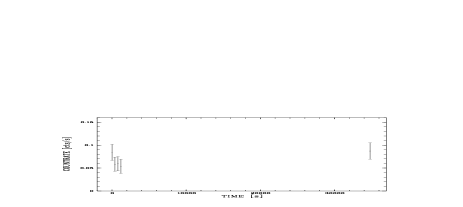
Figure 2 shows the individual countrates versus time for the 1992 and 1993 observations. Given the statistical errors no significant variations can be claimed. In the ROSAT all-sky survey, NGC 6240 was detected with a countrate of (Voges et al. 1997) which is consistent with the individual pointed observations.
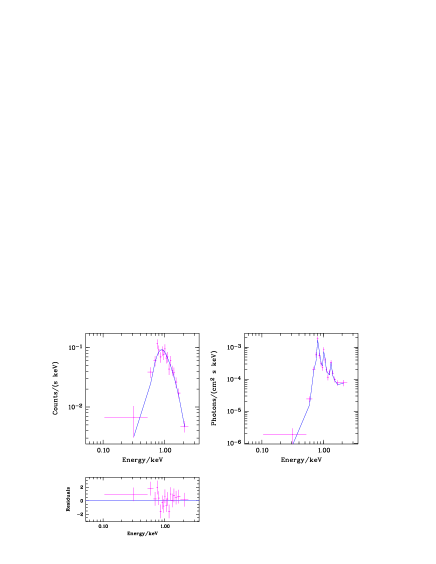
5 Spectral analysis for NGC 6240
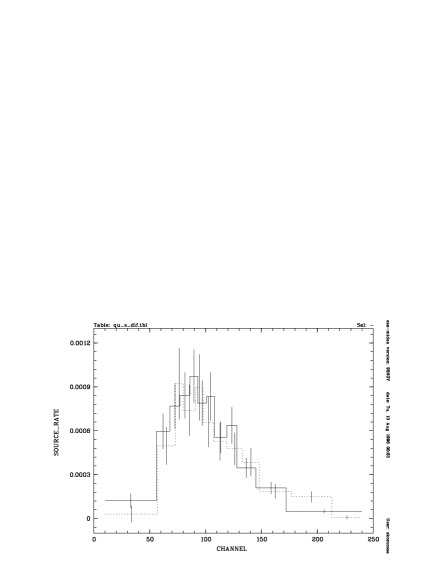
As shown in Fig. 3 there is no evidence for spectral changes between the 1992 and 1993 observations so that the data were merged to ensure better statistics.
However, the photons detected in total limit any meaningful fits by spectral models to no more than two spectral components. Even with this restriction, the measured total soft X-ray luminosity is highly model dependent as is illustrated by the numerous statistically acceptable fits in Table 2. This is due to the large bin widths which causes individual fitted photon numbers in each bin to depend on the spectral shape.
In addition to the individual model determining parameters like temperature (one parameter of the “thermal” models as bb = black body, thb = thermal bremsstrahlung, rs = thin thermal plasma in collisional equilibrium as computed by Raymond & Smith (1977)) or powerlaw index (for “nonthermal” pl = powerlaw models according to a photon flux distribution with = photon energy) and the necessary normalization constants, the fits depend on the column density of “cold” gas that is represented by the summed photoelectric cross sections for gas with cosmic chemical abundances. Table 2 shows that individually fitted values can grossly vary among the fitted models because influences the slope of the soft component.
We adopt the Galactic hydrogen column cm-2 (Dickey & Lockman 1990) in the direction of NGC 6240 as a lower limit. However, a spectral emission model fitted with this column would have to encounter no absorption within NGC 6240 which appears somehow unlikely in view of the abundant molecular and ionized material observed in the central region of this object. The emission would have to arise in an “outer shell” or penetrate through optically thin windows in the ISM. Indeed, a pl-model with (model E in Table 2) leads to a bad fit while a bb-model (model A) fits well. However, such a huge bb-shell, optically thick in soft X-rays and extending over more than 30\arcsec or, in linear scales, over more than 21 kpc cannot be reasonably imagined in physical terms. The physically expected thin X-ray emitting gas will emit lines with a significant contribution so that the thb fit (model B) is excluded as well. Our main goal to showing these (from the beginning) unrealistic models is to find out the range of luminosities (last column in Table 2) obtained by different spectral shapes.
A powerlaw with free column (model D) is statistically feasible but has a steep slope with . Only the subgroup of so-called narrow-line Seyfert-1 galaxies (NLSy1; e.g. Puchnarewicz et al. 1992; Boller et al. 1996; Greiner et al. 1996) is known to have comparatively steep slopes. Komossa & Greiner (1995) proposed to explain these objects by warm absorption of an intrinsically flat () powerlaw. The steep spectrum is then mimicked by the presence of matter-bounded, completely H-ionized absorbing gas (so-called “warm absorbers”), which absorb by metal ions. Applying a standard warm-absorber model (as e.g. described in Komossa & Fink 1997) we found no acceptable fit.
Hence, the steep slope, far off the canonical value , has to be intrinsic which, if persisting in the UV, would cause an ultraluminous UV component never seen in any unobscured object. Finally, the luminosity of model D (last column in Table 2) of erg s-1 is so huge that, for common AGN ratios, a hidden QSO of erg s-1 would be required that would heat the central dust in NGC 6240 to more than three times the observed FIR luminosity unless the bulk of its radiation escapes elsewhere. We consider model D as unlikely.
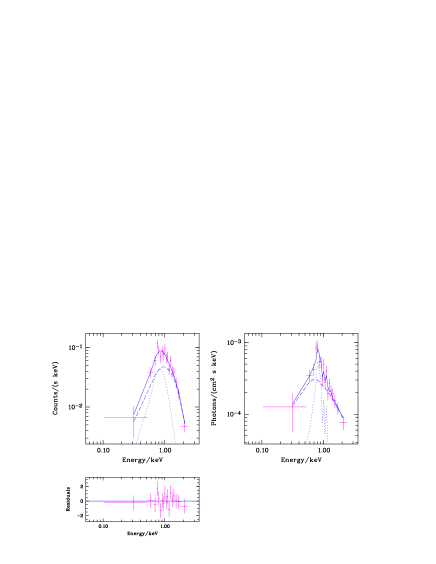
We are left with model C as a purely thermal solution and F as a hybrid model consisting of thin thermal gas plus a nonthermal component. The added pl in F leads to a comfortably small luminosity compared to C because its assumed ‘flat’ slope helped to minimize . Tuning the pl index to flatter slopes does not lead to a significant further luminosity reduction (cf. model E). Possible origins of the components will be discussed in Sect. 6.
| model | Normpl | Normother | ||||||
| 1021 cm-2 | ph/cm2/s/keV(1) | keV | (2) | erg/cm2/s | erg/s | |||
| A (bb) | 0.549(3) | – | – | 0.28 | 0.98 (16) | |||
| B (thb) | 1.96 | – | – | 0.73 | 0.89 (15) | |||
| C (rs) | 9.63 | – | – | 0.44 | 1.11 (15) | |||
| D (pl) | 3.5 | – | – | 0.86 (15) | ||||
| E (pl) | 0.549(3) | – | – | 2.55 (16) | ||||
| F (rs+pl) | 1.61 | 0.63 | 0.77 (14) |
(1) at 1 keV; (2) ph/cm2/s for bb,
ph/cm2/s/keV at 1 keV for thb;
(3) fixed to the Galactic value; (4) fixed
6 Discussion
Due its more complete database we first discuss NGC 6240.
6.1 NGC 6240
From the discussion in Sect. 5 only model C (thermal rs with luminosity erg s-1) and the pl+rs model F (rs luminosity erg s-1, pl luminosity erg s-1) of Table 2 are acceptable. Given the abundant evidence for superwind activity and a possible AGN these appear to be the most likely sources for the X-ray emission. A notable contribution by direct emission from OB stars present in the supposed starburst is ruled out: each star only emits erg s-1 of a rather soft X-ray energy distribution (e.g. Vaiana et al. 1981, Berghöfer et al. 1997). A significant fraction of unobscured O stars would have shown up in the optical.
A large number of massive X-ray binaries and a few supernova remnants with luminosities in the range 1035-38 erg s-1 do collectively play a significant role in ‘normal’ spiral galaxies. NGC 6240 might be the product of the collision of such objects which in their normal state have a X-ray luminosity of erg s-1 (Fabbiano 1989). Since there is no known mechanism to boost the number of X-ray binaries by two orders of magnitudes in the interaction process it appears practically ruled out that the erg s-1 soft X-rays come from binaries. Supernova remnant activity can indeed be boosted in a starburst triggered by the interaction, but this leads us directly to the superwind model.
6.1.1 Superwind estimate
Sophisticated two-dimensional hydrodynamical simulations of galactic superwinds are available (e.g. Suchkov et al. 1994). However, such studies mainly address the “prototype” M 82 so that their particular examples hardly reach the temperatures and luminosities found in our fits. Lacking precise constraints our goal is limited to the estimate whether the huge thermal rs-component luminosities from the fits are feasible. Hence, we use a scalable theory rather than a hydrodynamical model with specific initial conditions. We utilize the most sophisticated models of this type which were built by Mac Low & McCray (1988; for an application see also Schulz 1990) who had extended the seminal work by Weaver et al. (1977).
Densities and distribution functions of the ISM in the center of NGC 6240 are not known. The extent of the supershell can be estimated from the five-finger structure on available H images (Schulz 1984, Keel 1990, Thronson et al. 1990) that yield kpc including a correction for a disk inclined by up to 40\degr from edge-on. The strong dust lane on B photographs (best visible in the masked prints made by Fosbury & Wall 1979) suggests a close-to-edge-on view of the main disk.
The large line widths (FWHM) cited in Sect. 1 which most frequently lie in the range between 480 and 620 km s-1, but occasionally reach 900 km s-1 (Keel 1990), are due to the summed effect of outflow, rotation and ‘turbulence’ (the filamentary shell in M 82 shows linewidths of up to 300 km s-1; cf. Bland & Tully 1988). As pointed out by van der Werf et al. (1993), shock velocities exceeding 200 km s-1 would boost the [OI] and [SII] emission-line intensities relative to H and lower [OIII]/[OI] thereby deteriorating the explanation of the optical spectra by a large contribution of shockheated gas. Since , an outflow velocity of the shell of 200 km s-1 is consistent with the data and turbulence components with km s-1 (FWHM km s-1).
As mean density of the swept up ISM we have chosen cm-3, higher than the canonical values of cm-3 from our Galaxy or M 82 (Strickland et al. 1997). The most prominent extended bright parts of the supershell are on the eastern side of the double nucleus which might be due to a slightly asymmetric location of the sources of the wind.
The mechanical input power is given by the supernova rate (MacLow & McCray 1988) for which we adopt 1 SN yr-1 (van der Werf et al. 1993 estimate 2 yr-1; Colbert et al. 1994 obtain 1 yr-1 from the diffuse radio emission but are uncertain about the extra power released in the compact radio knots). With an energy per SN of 1051 erg, we obtain erg s-1. According to Heckman et al. (1996) shock models by Binette et al. (1985) predict (H, yielding erg s-1 with (H erg s-1 from Fosbury & Wall (1979). Largely due to a larger reddening correction, Veilleux et al. (1995) obtain (H erg s-1 which would lead to erg s-1 or 14 supernovae yr-1 which is not compatible with other evidence. We take 3 SN yr-1 or erg s-1 as an upper limit and assume that H has to be partially attributed to ionizing sources other than shocks.
Scaling of the formula of MacLow & McCray (1988) leads to the following expressions (for we followed Heckman et al.(1996) who had carried out the integration over the superbubble model in the ROSAT band):
| (1) |
| (2) |
| (3) |
where , and .
These relations show that, with the observational constraints so far available, it is quite natural to account for the thermal erg s-1 obtained for the rs-component of the rs+pl hybrid model.
However, how can we reach the erg s-1 required for the single-rs fit? We need a factor of 43 in eq. 3. A factor-of-3 increase of would fit to our upper limit of that is in accordance with shocked H (see above) but already strain the conditions for and (Eqs. 1 and 2). Enhancing the density to (a rather high value in the halo into which the bubble expands) would boost by a factor 3.5 and comfortably decrease and to still acceptable values. However, we still need another factor 4.3 requiring a factor of 20 in the expansion-time parameter. However, a yr old bubble would have already commenced other starbursts for which no trace is visible and, more seriously, our theory would no more be applicable.
This exercise of boosting the parameters to high but not excludable values demonstrates the basic difficulty of getting a soft-X ray luminosity of several erg s-1 from a single superbubble.
Some concern about the single-rs fit (model C in Table 2) also arises by the high cold absorbing column, which corresponds to mag (using Bohlin’s et al.(1978) relation). Thronson et al. (1990) find in the double nuclei but elsewhere . The latter value should be more typical for most of the volume occupied by the extended supershell.
6.1.2 AGN contribution
Inverse-Compton (IC) upscattered photons from the FIR photons in the radio sources of NGC 6240 would generate a flux of erg s-1 cm-2 (Colbert et al. 1994). The powerlaw component of model F (Table 2) emits a flux of erg s-1 and is therefore likely to be attributed to an AGN-like source.
It may, however, appear striking that the expected IC scattered flux fits our measured powerlaw if the Compton X-ray emission disk-halo model devised by Goldshmidt & Rephaeli (1995, GR95) is upscaled from the starburst galaxy NGC 253 to NGC 6240 via the FIR ratio. The GR95 model predicts an unattenuated Compton flux of erg cm-2 s-1 in the ROSAT band if NGC 253 were placed at 144 Mpc, the distance of NGC 6240 adopted here. Scaling this by the ratio 175 of the FIR luminosities (the flux formula from Helou et al. (1985) yields for NGC 6240, GR95 use for NGC 253) leads to erg cm-2 s-1 which is, indeed, nearly the same as the power-law flux of NGC 6240 given in the last paragraph.
However, this simple scaling may be misleading because the magnetic fields in the radio sources of NGC 6240 are higher than in NGC 253 (Colbert et al. 1994). In the flux-dominating two radio nuclei the lower limit of the magnetic field is fifty times ( G) larger than that in the central synchrotron source of NGC 253 (G) while in the western extended regions G which is 2.2 times larger. Granted that other conditions are scalable, the boost in the magnetic energy densities () should diminish the above NGC 253-scaled IC flux estimate (roughly ) by factors between (compact components) and (extended regions). Hence, within this scheme it appears that at least the extended radio sources may contribute a significant comptonized power law.
Adopting this scaled GR95 model for NGC 6240 would, however, mean to scale the radiation energy density distribution from NGC 253 by luminosity which requires an identical size of the FIR emitting region in objects that differ in luminosity by a factor of hundred. Even if this might be the case the electron distribution in the extended halo components of NGC 253 and NGC 6240 would have to be similar as well, which is doubtful because of the hundred times smaller propagation lengths for the disk-halo connection via electron convection and diffusion in the latter galaxy. This is due to the increased radiative loss in the central disk (see, e.g., Eq. 8 and the subsequent discussion in GR95).
In their more direct approach, Colbert et al. related the Compton upscattering to the observed synchrotron sources and tested two complementary types of FIR distributions (distributed like the radio sources and uniform distribution). Neither case, regardless of compact or extended sources, yielded any flux above a few percent of that of our pl component.
Finding no direct clue from available observations that IC upscattering of FIR photons plays a significant role we continue to interpret the powerlaw by an AGN-like source. Notwithstanding, GR95-type IC models for extended components might become relevant if some of the presently only crudely known parameters will attain more favorable values for such processes in the future.
The supershell model in Sect. 6.1.1 easily accounts for the rs-component of model F which makes 20% of the total flux. We now have to explain the remaining erg s-1 in the powerlaw. Aside from the X-rays, the only other hint for high-energy radiation of an AGN is given by the high-excitation core in the southern nucleus (Rafanelli et al. 1997) that accounts for % of H. This component is probably due to a ‘window’ in the ISM and does not allow a direct view of the continuum source.
Consequently, the supposed AGN is likely to be seen in scattered light. This is in agreement with our non-detection of variability of the supposed AGN because scattering the X-rays over several kpc would smear out any short-term variability. The electrons in the extended ionized regions of the superwind and supershell itself are one possible source of scatterers. A simple geometry with only one constant-density population of electrons defines a fraction of the AGN luminosity to be seen as scattered luminosity by the condition
| (4) |
where is the Thomson cross-section cm2, our measured powerlaw luminosity of erg s-1. From the central biconical H structure one estimates that a fraction can escape from the central (for simplicity assumed to be isotropic in the first instance), corresponding to an ideal bicone with opening angle for each side. In practice, the structure has a broader base and has a shape something in between a biconical and a bycilindrical configuration, but for a crude estimate this distinction is unimportant.
Basically two types of scatterers are available: Firstly, the dense material close to the baseline and in the broken shells. For isothermal shocks we would expect densities of the order of cm-3. For the bright filamentary material within the innermost 2 kpc an electron density of 500 cm-3 was measured by Heckman et al. (1990). Secondly, low-density, distributed in the bicone, could reach significant electron-scattering depths due to its spatial extent of up to 10 kpc.
The H image from Keel (1990) shows a strong surface-brightness enhancement in the southern nucleus suggesting that luminous high-density material is concentrated there. Adopting from the above cm-3 and pc leads to or a predicted (isotropic) erg s-1. The mass of this ionized gas in the inner bicone would be , compatible with estimated from hydrogen-line luminosities (DePoy et al. 1986; Veilleux et al. 1995; the lower limit applies for pure recombination). The amount of dense ionized gas is only minute compared to the of available cold molecular gas in the center of NGC 6240 (Solomon et al. 1997). Its filling factor is likely to be , but the covering fraction must be large to ensure an effective scattering length of 200 pc. In this scenario the power-law component should be unresolved with current X-ray telescopes.
The second possibility – an extended low-density region – would be much less efficient in scattering and involve a huge mass with unclear origin. E.g. kpc, cm-3 would lead to erg s-1 and ; in case of kpc, cm-3, we would need , but erg s-1 that would exceed of NGC 6240!
We conclude that scattering is feasible but, even in a simple high-density scenario, it requires a rather luminous AGN in the range erg s-1, which corresponds to erg s-1 for a typical AGN continuum, which is an appreciable fraction or nearly all of the FIR luminosity ( erg s-1) of NGC 6240.
The luminosity demand for the AGN is lowered in case of anisotropy of the AGN radiation because in the unified scenario more luminosity is expected along the bicone than in the equatorial plane of the molecular torus. An alternative possibility would be a component like a ‘warm scatterer’, i.e. near-central high density gas that scatters the X-rays into an escape window of the ISM but shows itself relatively little intrinsic emission, is possible.
The need for an AGN in NGC 6240 is also supported by preliminarily reported ASCA data (Mitsuda 1995) that show a power law in the 2–10 keV range plus a strong emission-line complex around FeK.
6.2 NGC 2782
In Sect. 2.1 we obtained erg s-1 (within a factor of 4). This can be compared with expected from data by Boer et al. (1992) who found optical evidence for an expanding supershell with kpc and d/d km s-1 leading to an age of yrs . They measured a total H luminosity of erg s-1 yielding (H) erg s-1 in case B. However, they estimate (on p. 74) that the outflowing shell contributes 1% of the H-recombination lines, but caution on p. 75 that this value might be ten times higher due to incomplete coverage. Since the mechanical power should be hundred times that of H (see Sect. 6.1.1) we obtain erg s-1 or a SN rate of 0.026 to 0.26 yr-1.
Plugging the lower SN rate into eqs. (1) to (3) yields (for ) kpc, km s-1 and erg s-1. While and are in good agreement with the measured data, is a factor 46 too small! Increasing the uncertain parameter by a factor 10, would boost the luminosity by a factor of only 3 and lower size and velocity of the shell to 60% the values they should have. The latter effect can be canceled by taking the upper limit of by a factor of 10, leading to erg s-1 which is consistent with the measured .
The SN rate is comparable to that of M 82 and NGC 253 (Rieke et al. 1980; Kronberg et al. 1985), starburst galaxies with an order of magnitude smaller from their centers (Strickland et al. 1997). The difference is explained by the hundred times smaller ambient density in these objects () than here assumed for NGC 2782 (). If this latter conjecture will one day turn out to be wrong then Seyfert (1943) might have been correct in considering NGC 2782 as a ‘Seyfert galaxy’ of which we now see some X-rays scattered in the outflow region. However, presently the evidence for an AGN in NGC 2782 does not appear compelling.
7 Concluding discussion
We analyzed ROSAT data of the ultraluminous IR galaxy NGC 6240 and of the starburst galaxy NGC 2782. With our best fit of the soft-X ray spectrum of NGC 6240 we found a luminosity (0.1–2.4 keV) of erg s-1 that, by at least an order of magnitude, exceeds that of its ultraluminous rival Arp 220 (see Heckman et al. (1996): to erg s-1). The difference is partly due to a luminous power-law component not present in Arp 220. We interpret this power-law component as scattered light from a hidden AGN with a luminosity that, depending on the poorly known scattering geometry, provides a major fraction of the bolometric luminosity of NGC 6240. About 20% of the total in the ROSAT band are due to thermal superwind-shocked shell material.
Lacking other components the scattered light of the hidden AGN is easiest to see in X rays. The scattered optical continuum is hard to decompose from the strong stellar background that was analyzed by Schmitt et al. (1996) and Shier et al. (1996). Veilleux et al. (1995) noticed ‘featureless’ continuum components in optical spectra of most ULIRGs. Polarization vectors presented in Radovich (1993) reveal a scattering geometry around the center but more detailed work in this regard could be rewarding.
In Sect. 6.1.1 we saw that the hydrogen recombination-line spectrum is too strong to be completely attributed to shock heating. As shown by Schulz & Fritsch (1994), attenuating the ionizing continuum of an AGN by hidden ionized absorbing gaseous columns with, e.g. , leads automatically to a LINER like spectrum as observed in NGC 6240. This thin absorber is nearly transparent to X-rays.
Hence, the emerging picture of the core of NGC 6240 is that of a buried AGN component, which unlike a Seyfert with a fully developed high-excitation spectrum, sees in no direction a completely clear sky.
NGC 2782 has an order-of-magnitude smaller X-ray luminosity than NGC 6240 and can, in excellent agreement with optical data, be consistently explained by superbubble activity if the ambient density is relatively high (average of 1 cm-3 in the inner 2 kpc of the halo). This does not completely exclude a hidden low-luminosity AGN, but so far, there is no positive evidence for it.
Acknowledgements.
We thank an anonymous referee for pointing our attention to the paper by Goldshmidt & Rephaeli (1995). H.S. gratefully acknowledges the hospitality of the Physics and Astronomy Department of Dartmouth College while finishing this work. T.W.B. acknowledges support from the Alexander-von-Humboldt-Stiftung by a Feodor-Lynen Fellowship. The ROSAT project is supported by the German Bundesministerium für Bildung, Wissenschaft, Forschung und Technologie (BMBF/DARA) and the Max-Planck-Society. The optical images shown are based on photographic data of the National Geographic Society – Palomar Observatory Sky Survey (NGS-POSS) obtained using the Oschin Telescope on Palomar Mountain. The NGS-POSS was funded by a grant from the National Geographic Society to the California Institute of Technology. The plates were processed into the present compressed digital form with their permission. The Digitized Sky Survey was produced at the Space Telescope Science Institute under US Government grant NAG W-2166. This research has made use of the NASA/IPAC extragalactic database (NED) which is operated by the Jet Propulsion Laboratory, Caltech, under contract with the National Aeronautics and Space Administration.References
- [1] Balzano V.A., 1983, ApJ 268, 602
- [2] Barbieri C., Rafanelli P., Schulz H. et al., 1993, A&A 273, 1
- [3] Berghöfer T.W., Schmitt J.H.M.M., Danner R., Cassinelli J., 1997, A&A 322, 167
- [4] Binette L., Dopita M.A., Tuohy I.R., 1985, ApJ 297, 476
- [5] Bland J., Tully B., 1988, Nat 334, 43
- [6] Boer B., Schulz H., Keel W.C., 1992, A&A 260, 67
- [7] Bohlin R.C., Savage B.D., Drake J.F., 1978, ApJ 224, 132
- [8] Boller T., Brandt W.N., Fink H.H., 1996, A&A 305, 53
- [9] Briel U., Aschenbach B., Hasinger G. et al., 1994, ROSAT user’s handbook
- [10] Colbert E.J.M., Wilson A.S., Bland-Hawthorn J., 1994, ApJ 436, 89
- [11] DePoy D.L., Becklin E.E., Wynn-Williams C.G., 1986, ApJ 307, 116
- [12] Dickey J.M., Lockman F.J., 1990, ARA&A 24, 499
- [13] Fabbiano G., 1989, ARA&A 27, 87
- [14] Fosbury R.A.E., Wall J.V., 1979, MNRAS 189, 79 (FW79)
- [15] Fried J., Schulz H., 1983, A&A 118, 166
- [16] Goldshmidt O., Rephaeli Y., 1995, ApJ 444, 113 (GR95)
- [17] Greiner J., Danner R., Bade N., Richter G.A., Kroll P., Komossa S., 1996, A&A 310, 384
- [18] Heckman T,M., Armus L., Miley G.K., 1987, AJ 93, 276
- [19] Heckman T.M., Armus L., Miley G.K., 1990, ApJS 74,833
- [20] Heckman D.M., Dahlem M., Eales S.A., Fabbiano G., Weaver K., 1996, ApJ 457, 616
- [21] Helou, G., Soifer B.T., Rowan-Robinson M., 1985, ApJ 298, L7
- [22] Joseph R.D., Wright, G.S., 1985, MNRAS 209, 111
- [23] Keel W.C., 1990, AJ 100, 356
- [24] Kennicut Jr. R.C., Keel W.C., Blaha C.A., 1988, AJ 97, 1022
- [25] Kinney A.L., Bregman J.N., Huggins P.J., Glassgold A.E., 1984, PASP 96, 398
- [26] Komossa S., Greiner J., 1995, AG abstract series 11, 217
- [27] Komossa S., Fink H., 1997, A&A 322, 719
- [28] Kronberg P.P., Biermann P., Schwab F.R., 1985, ApJ 291, 693
- [29] Lutz D., Genzel R., Sternberg A. et al., 1996, A&A 315, L137
- [30] Mac Low M-M., McCray R., 1988, ApJ 324,776
- [31] Mitsuda K., 1995, Ann.N.Y.Acad.Sc. 759, Proc. 17th Texas Symp. Relat. Ap. and Cosm., eds. H.Böhringer, G.E.Morfill, J.E.Trümper (New York: The New York Acad. of Sc.), p. 213
- [32] Moran E.C., Halpern J.P., Helfand D.J., 1994, ApJ 433, L65
- [33] Morris S.L., Ward M.J., 1988, MNRAS 230, 639
- [34] Nandra K.,George I.M., Mushotzky R.F., Turner T.J., Yaqoob T., 1997, astro-ph/9606169, to appear in ApJ
- [35] Nousek J., Lesser A., 1993, ROSAT Newsletter 8, 13
- [36] Pfeffermann E., Briel U.G., Hippmann H. et al., 1987, SPIE 733, 519
- [37] Pounds K.A., Nandra K., Fink H., Makino F., 1994, MNRAS 267, 193
- [38] Puchnarewicz E.M., Mason K.O., Cordova F.A. et al., 1992, MNRAS 256, 589
- [39] Radovich M., 1993, doctoral thesis, University of Padova
- [40] Rafanelli P., Schulz H., Barbieri C. et al., 1997, A&A, in press
- [41] Raymond J.C., Smith B.W. 1977, ApJS 35, 419
- [42] Rieke G.H., Lebofsky M.J., Thompson R.I., Low F.J., Tokunaga A.T., 1980, ApJ 238, 24
- [43] Rieke G.H., Cutrie R.M., Black J.H. et al., 1985, ApJ 290, 116
- [44] Rieke G.H., 1988, ApJ 331, L5
- [45] Sakka K., Oka S., Wakamatsu K., 1973, PASJ 25, 153
- [46] Sanders D.B., Soifer B.T., Elias J.H. et al., 1988, ApJ 325, 74
- [47] Schmitt H.R., Bica, E., Pastoriza, M.G., 1996, MNRAS 278, 965
- [48] Schulz H., 1984, Sterne und Weltraum 23, 311
- [49] Schulz H., 1990, AJ 99, 1442
- [50] Schulz H., Fried J, Röser S., Keel W.C., 1993, A&A 277, 416
- [51] Schulz H., Fritsch Ch., 1994, A&A 291, 713
- [52] Seyfert C.K. 1943, ApJ 97, 28
- [53] Shier L.M., Rieke M.J., Rieke G.H., 1996, ApJ 470, 222
- [54] Solomon P.M., Downes D., Radford S.J.E., Barrett J.W. 1997, ApJ 478, 144
- [55] Strickland D.K., Ponman T.J., Stevens I.R., 1997, A&A 320, 378
- [56] Suchkov A.A., Balsara D.S., Heckman T.M., Leitherer C., 1994, ApJ 430, 511
- [57] Svensson R., 1994, ApJS 92, 585
- [58] Thronson H.A., Majewski S., Descartes L., Hereld M., 1990, ApJ 364, 456
- [59] Trümper J., 1983, Adv. Space Res. 2, 241
- [60] Trümper J., Hasinger G., Aschenbach B. et al., 1991, Nat 349, 579
- [61] Vaiana G.S. et al., 1981, ApJ 245, 163
- [62] van der Werf P.P., Genzel R., Krabbe A. et al., 1993, ApJ, 405, 522
- [63] Veilleux S., Kim D.-C., Sanders D.B., Mazzarella M., Soifer B.T., 1995, ApJS 98, 171
- [64] Voges W. et al., 1997, A&A to be submitted
- [65] Weaver R., McCray R., Castor J., Shapiro P., Moore R., 1977, ApJ 218, 377; 220, 742
- [66] Wisotzki L., Bade N. 1997, A&A 320, 395
- [67] Wright G.S., Joseph R.D., Meikle W.P.S., 1984, Nat 309, 430
- [68] Zimmermann H.U., Becker W., Belloni T., Döbereiner S., Izzo C., Kahabka P., Schwentker O., 1994, MPE report 257
- [69] Zombeck M.V. et al., 1990, in Proc. SPIE Conf. EUV, X-Ray, and Gamma-Ray Instrumentation for Astronomy, Calibration of the ROSAT High Resolution Imager, 1344, 267