11.17.1 - 11.09.4 - 11.01.1 - 11.02.2 - 10.01.1
G. Vladilo, Osservatorio Astronomico di Trieste, Via G.B. Tiepolo 11, 34131, Trieste, Italy
The absorption system towards PKS 0118-272: A candidate Damped Ly system at low redshift ††thanks: Based on observations collected at the European Southern Observatory (La Silla, Chile)
Abstract
We present a study of the absorption system at = 0.558 towards the BL Lac object PKS 0118–272 based on high resolution spectra () obtained at the 3.6m ESO telescope and on direct imaging data obtained at the 3.5m ESO New Technology Telescope. At the redshift of the absorber we detect lines of the low ionization species , , , , , and . Most of the lines are unsaturated and we determine accurate column densities for all the species but . The derived column densities are typical of the interstellar gas in the disk of the Galaxy. By assuming dust-free gas with solar abundances these column densities yield () 2.5 1019 cm-2; however, the relative elemental abundances suggest that some dust is present and that () 2 1020 cm-2. The inferred column density indicates that the absorber is a Damped Ly system. We find [Ti/Fe] = +0.3, in agreement with [Ti/Fe] measurements in DLA absorbers, but [Mn/Fe] = +0.4, at variance with the values [Mn/Fe] 0 common to DLA systems. The measured [Ti/Fe] and [Mn/Fe] ratios match remarkably well the differential depletion pattern of low-density interstellar clouds in the Galaxy. Unlike high-redshift DLA systems (), the =0.558 absorber seems to originate in a galaxy that has already attained the abundances and dust content of present-day disk galaxies. The analysis of our imaging data lends support to the presence of an intervening galaxy. After a careful subtraction of the BL Lac image, an object at 1.6′′ from PKS 0118–272 is detected. At the absorber redshift the projected distance of this close companion (14 kpc) and its absolute magnitude (M –22.3) are consistent with those found for galaxies associated with low-redshift DLA systems.
keywords:
Quasars: absorption lines - Galaxies: ISM, abundances - BL Lacertae objects: individual: PKS 0118–272 - Galaxy: abundances1 Introduction
Damped Lyman (DLA) systems are the class of QSO absorbers with highest neutral hydrogen column density, () 2 1020 cm-2, comparable with that observed in present-day disk galaxies (Wolfe et al. 1986). The comoving mass density of neutral gas in DLA systems, , is a significant fraction of the barionic content of the high redshift universe; shows a decrease with time which is interpreted as gas consumption by star formation (Wolfe et al. 1995). The degree of ionization and the velocity dispersion of the metal lines in the DLA spectra resemble the quiescent neutral gas residing in rotating galactic disks. For all the above reasons DLA systems most likely originate in galactic (or proto-galactic) regions and their study can be used to trace the evolution of galaxies — via their gas component — up to the highest redshift QSOs.
About 90 DLA systems have been currently identified, covering the redshift range (Wolfe et al. 1995, Storrie-Lombardi et al. 1996). Owing to the paucity of QSO spectroscopic studies in the ultraviolet, however, only 6 damped Ly absorptions at redshift have been observed, either with the IUE (Lanzetta et al. 1995) or with the HST (Cohen et al. 1994, Steidel et al. 1995). No DLA systems at have been as yet found in the HST QSO absorption-line key project survey (Bahcall et al. 1996) and only a few DLA systems at moderate redshift are known from 21 cm observations (see Table 4 in Wolfe et al. 1995 and references quoted therein).
The small fraction of low-redshift DLA systems limits the possibility of tracing their evolution up to a look-back time of about two thirds of the age of the universe. It is therefore of interest to find new DLA systems at moderate redshift in order to fill this large temporal gap. Moreover, only at low redshift is it possible to perform a morphological identification of the intervening galaxies via direct imaging techniques. A study of galaxies associated with DLA absorbers at in the sightlines of seven quasars has been performed by Le Brun et al. (1997), who find a wide variety of morphologies and a large spread of luminosities.
High redshift DLAs are now being systematically investigated at high spectral resolution (see Lu et al. 1996, Molaro et al. 1997, Pettini et al. 1997, Prochaska & Wolfe 1997 and refs. quoted in these papers). However, only a very few DLA systems at moderate redshift have been observed at (Lanzetta & Bowen 1992; Meyer et al. 1995; Prochaska & Wolfe 1997). Here we show that the absorption system at = 0.558 towards PKS 0118-27, originally detected in by Falomo (1991) at is most likely a DLA system. We present new spectroscopic () and imaging observations of this system in Sect. 2. The absorption spectrum is analysed in Sect. 3, while in Sect. 4 we discuss the spectroscopic evidence that the absorber is a DLA system. The positive results of a search for an intervening galaxy are reported in Sect. 5. The properties of the absorber are compared with those of DLA systems and of Galactic interstellar clouds in Sect. 6. The results are summarized in Sect. 7.
2 Observations and data reduction
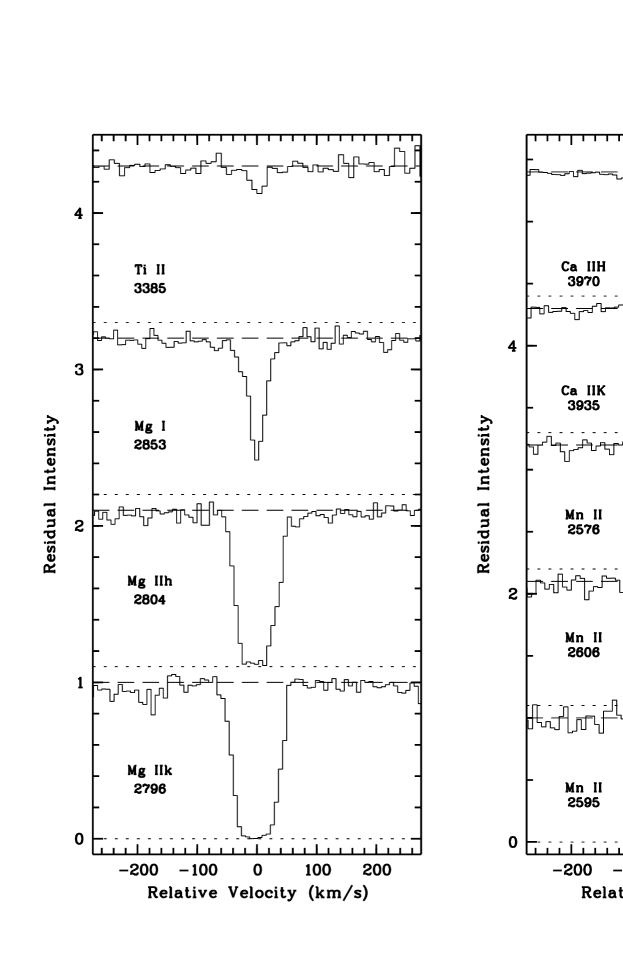
The optical spectra of PKS 0118272 ( = 15.9 mag) were obtained with the CASPEC spectrograph (Pasquini & D’Odorico 1989) at the ESO 3.6m telescope (La Silla, Chile). The 31.6 lines/mm echelle grating and the long camera (f/3) were used. The detector was a thin, back-illuminated Tektronics TK1024AB CCD with 1024x1024 square pixels 24 m in size. The CCD was binned at a step of 2 pixels along the dispersion, yielding a binned pixel size of 0.134 Å at = 500 nm. The slit width was fixed at 300 m (2.1) and the resulting resolving power was , which represents a factor of 20 increase in resolution with respect to previous observations of the same object. The full width at half maximum of the instrumental profile, was measured from the emission lines of the Thorium-Argon arcs recorded for each spectrum. A log of the observations including the central wavelengths of the different spectral ranges covered is given in Table 1. The spectra were reduced using the echelle reduction package implemented within MIDAS. The uncertainty in the wavelength calibation is 0.05 Å, corresponding to 0.2 of a resolution element. The signal-to-noise ratio per pixel, defined as the inverse relative scatter of the continuum, is typically S/N 20. The 3- threshold equivalent width for detection of narrow absorption lines is 40 mÅ, corresponding to 25 mÅ in the rest frame. The spectral ranges of the final, normalized spectrum including the identified lines of the absorber are shown in Fig. 1.
| Date | Exp. time | No. of | |
|---|---|---|---|
| (nm) | (s) | spectra | |
| 14-09-95 | 495 | 3000 | 2 |
| 15-09-95 | 395 | 3300 | 2 |
| 16-09-95 | 570 | 3600 | 2 |
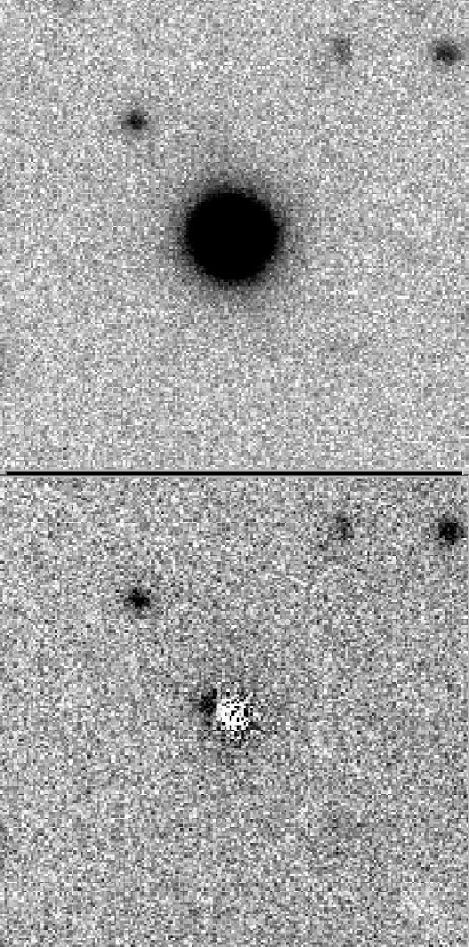
Optical images were obtained with the 3.5m New Technology Telescope (NTT) at ESO using the direct imaging system SUSI (Melnick et al. 1992). Data were acquired using an R-band filter (Cousins system) and a CCD (TK 1024) with 24m pixel size corresponding to 0.13′′ on the sky. Conditions were photometric and seeing was 0.9′′ (FWHM). Observations of standard stars were used to set the photometric zero point. The images were processed in the standard way using IRAF procedures. Images of PKS 0118-272 were taken in August 1992 and March 1993. In the second case several short (2 min) exposure frames were obtained. These images were then co-added to obtain an average frame. The two data sets have similar resolutions and yield practically identical results. The central part of the final average image is shown in Fig. 2.
| Ion | Wλ | |||
|---|---|---|---|---|
| (Å) | (Å) | (Å) | (Å) | |
| 3934.78 | 6130.40 | 0.103 | 0.011 | |
| 3969.59 | 6184.64 | 0.058 | 0.006 | |
| 3384.74 | 5273.44 | 0.045 | 0.008 | |
| 2344.21 | 3652.27 | 0.270 | 0.021 | |
| 2374.46 | 3699.39 | 0.160 | 0.020 | |
| 2382.76 | 3712.33 | 0.340 | 0.020 | |
| 2586.65 | 4029.98 | 0.263 | 0.015 | |
| 2600.17 | 4051.05 | 0.359 | 0.014 | |
| 2576.88 | 4014.76 | 0.071 | 0.015 | |
| 2594.50 | 4042.21 | 0.058 | 0.014 | |
| 2606.46 | 4060.85 | 0.039 | 0.014 | |
| 2852.96 | 4444.92 | 0.160 | 0.012 | |
| 2796.35 | 4356.69 | 0.494 | 0.011 | |
| 2802.53 | 4367.89 | 0.462 | 0.011 |
3 The absorption spectrum
A total of 14 absorption lines of , , , , , and detected at the redshift of the absorber are shown in Fig. 1 and listed in Table 2. This represents the most extensive collection of transitions for a low redshift absorption system. had been detected previously only in two QSO absorbers (Meyer et al. 1995; Prochaska & Wolfe 1997) and detections are also relatively rare (Robertson et al. 1988; Bowen 1991). The neutral and low-ionization species detected are likely to be associated with a neutral hydrogen component present in the system.
The observed profiles do not show multiple component structure at our resolution (FWHM15 km s-1). Only a slight asymmetry, barely visible in some lines (e.g. 2853Å and 2587Å), suggests the presence of an additional, weak component in the blue wing of the main one. The total radial velocity extent of the systems never exceeds 120 km s-1, the value measured in the saturated k line. The kinematics of the system appears to be simple, at least along our line of sight.
In Table 2 we list the rest frame equivalent widths and 1 errors of the detected lines of the system. Equivalent width errors never exceed 20 mÅ in the rest frame. A significant fraction of the lines, including H and K, 3385Å, and the 3 lines, are almost unsaturated, with mÅ. The lines 2852Å and 2374Å are only mildly saturated, with mÅ. The low degree of saturation guarantees a reliable determination of the column densities, with the only exception of , which shows both h and k lines heavily saturated.
Column densities and values were derived by fitting Voigt profiles convolved with the instrumental point spread function. The set of routines FITLYMAN (Fontana & Ballester 1995) included in the MIDAS package were used. Atomic parameters were taken from Morton (1991). The results are shown in Table 3. Quoted errors are 1 and result from the fitting procedure. Broadening parameters were derived independently for the species having at least two transitions (, and ). These values span the range from 16 to 20 km s-1, i.e. much higher than the values expected for pure thermal broadening in low-ionization gas, where K and 3 km s-1 for any of the metals considered here. This suggests that turbulence and/or macroscopic motions dominate the broadening. Hence a common value is expected for ions tracing same volumes of gas, independently of their atomic masses. The value derived from and are equal within the errors, consistently with this interpretation. The lower value derived from the lines is not in contradiction since does not trace exactly the same volumes as and owing to differences in ionization potential. The mean value of the and was adopted as representative of the ionized species and . The column density derived in this way is essentially equal to the one derived by leaving the parameter free during the fitting procedure (see Table 3).
| Ion | comments | ||
|---|---|---|---|
| (cm-2) | (km s-1) | ||
| 12.47 0.06 | 16.2 2.1 | best fit 1 line | |
| 14.00 | 19.2 1.1 | b from and | |
| 12.37 0.07 | 11.6 3.4 | best fit 2 lines | |
| 12.27 0.19 | 13.3 9.2 | best fit 1 line | |
| 12.31 0.01 | 19.2 1.1 | b from and | |
| 12.77 0.06 | 20.1 3.9 | best fit 3 lines | |
| 14.45 0.03 | 18.3 0.5 | best fit 5 lines |
4 Spectroscopic evidence that the =0.558 absorber is a Damped Ly system
The available ultraviolet spectra of PKS 0118–272, taken with the IUE satellite, do not cover the Ly line at =0.558. This prevents the direct determination of the hydrogen column density, which would allow to identify the absorber as a DLA system if () 1020 cm-2. In order to estimate () we used the column densities of the dominant ions of Table 3. Calcium was omitted because can also exist in regions. Magnesium was excluded owing to its large column density error. By assuming solar abundances and no dust depletion we estimated the lower limits, ()min, shown in the second column of Table 4. Here and in the rest of this work solar abundances are taken from Anders & Grevesse (1989), with the exception of the abundance of Fe which was taken from Hannaford et al. (1992). The conservative limits ()min indicate that the total column density is in excess of 2.5 1019 atoms cm-2, the most stringent limit coming from .
A prediction of the column density in the presence of dust can be obtained by adopting for each element X a value of interstellar depletion from Galactic interstellar surveys. Here and in the rest of this paper we adopt the representative values of depletions from the compilation of Jenkins (1987). It is known that the quantities correlate with the mean density along the line of sight, (H). Following the definitions of Jenkins (1987) we consider two situations: base depletion, representative of low-density lines of sight (log (H) = –1.5) and dense depletion, representative of lines of sight with high mean density (log (H) = +0.5). For each element in Table 4 we give the typical value of in each case and the estimated hydrogen column density derived by taking into account the presence of dust, ()est. All the ()est values are well in excess of 1020 atoms cm-2. However, very different and mutually inconsistent estimates result from assuming a dense depletion pattern. Instead, a remarkable agreement at 2 1020 atoms cm-2 is found from the 3 independent predictions if the depletion pattern is typical of moderately depleted interstellar clouds. In any case, even assuming the above quoted lower limit, the high total column density provides indirect evidence that the absorber is a DLA system. Should the system have metallicity below solar, as generally observed in the QSO absorbers, the real () would be even higher.
The column densities of the metals lend support to an origin of the absorber in a galactic disk. In Figs. 3, 4 and 5 we compare the , , , , and column densities measured in the =0.558 system with column densities observed in Galactic interstellar clouds. Both the absolute and the relative values of the column densities of the absorber are undistinguishable from those of interstellar clouds within the disk of the Galaxy. This agreement between several independent quantities is remarkable since the measured column densities and their ratios are affected by a large variety of factors, including chemical composition, presence or absence of dust, and physical state of the absorber. The observed general agreement suggests that the system originates in the disk of a galaxy lying along the line of sight to PKS 0118–272. This origin is consistent with the absorber being a Damped Lyman system.
| Base depletion | Dense depletion | ||||
| Ion | ()min | ()est | ()est | ||
| (cm-2) | (cm-2) | (cm-2) | |||
| 19.3 | –1.02 | 20.3 | –2.70 | 22.0 | |
| 19.4 | –0.84 | 20.2 | –1.28 | 20.7 | |
| 19.0 | –1.27 | 20.2 | –2.03 | 21.0 | |
5 Search for an intervening galaxy in the field
About 15 faint galaxies in the range of magnitude mR = 20.5 to 21.5, are present within 30′′ of the BL Lac object (Falomo 1996). A close up of this field is shown in Fig. 2a. The galaxy closest to PKS 0118-27 lies at 8′′ (PA 40∘), corresponding to a projected distance of 70 kpc ( = 50 km s-1 and = 0) at . This would imply a relatively large size for a galactic disk with () 1020 atoms cm-2. This fact prompted us to search for a closer companion galaxy by subtracting a scaled Point Spread Function (PSF) from the image of the target. As PSF template we used an unsaturated star at 30′′ NE which is within our field of view and has brightness similar to the target. After alignement of the PSF template with the BL Lac image we subtracted several scaled PSF changing the normalization factor. The final value was set to have minimum residuals within a radius of 5 pixels. This PSF subtracted image reveals the presence of a companion galaxy 1.6′′ NE of 0118-272 (Fig. 2b). This companion object is similar in magnitude to the galaxy at 8′′ NE which has mR = 21.1. If they are at the same redshift of the absorber their absolute magnitude is M –22.3 and the closest companion lies at only 14 kpc (projected distance) from the BL Lac source. These magnitudes and distances are in line with the results found by Le Brun et al. (1997) from their study of seven fields around quasars showing DLA absorption at moderate redshift. These authors find galaxies with –23 mag MB –19 mag and impact parameters 10 kpc. The faint companion object at 1.6′′ (Fig. 2b) is the most likely candidate galaxy responsible for the absorption. The magnitude of the close companion galaxy suggests that we are dealing with a normal galaxy. A column density () 2 1020 cm-2 is within the range expected for a normal galaxy at a galactocentric distance of 14 kpc. The detection of a close galaxy with such properties lends further support to the notion that the =0.558 absorber is a DLA system.
6 Properties of the = 0.558 absorber
6.1 Elemental abundances and depletions
To study the elemental abundances we consider elements that have their dominant ionization states in regions, such as , and . For reasons mentioned in Sect. 4.1 we do not consider and . Owing to the lack of a direct () determination we focus our attention on relative abundances, i.e. element-to-element ratios. In Table 5 we compare iron peak abundances in DLA systems, including the absorber towards PKS 0118–272. The usual definition [X/Fe] = log (X)/(Fe) – log (X/Fe) is adopted. Deviations from solar ratios are generally found in the absorbers. The interpretation of such relative abundances, however, is not straitghforward since depletions on dust grains may distort the true abundance ratios. In order to draw conclusions about abundances and depletions we need a set of fiducial cosmic abundances at large look-back times and, in addition, a realistic model for the pattern of elemental depletion. No conclusion could be derived from the observed abundances should we allow a priori an arbitrary chemical evolution and an arbitrary elemental depletion pattern for the absorbers. Instead, by assuming a fiducial set of abundances and depletions, we can make quantitative predictions on the possible range of observed metallicities.
| QSO | Ref. | ||||
| 0118–272 | 0.558 | — | +0.41 | +0.31 | 1 |
| 2206–199 | 0.752 | — | –0.10 | +0.27 | 2 |
| 0454+039 | 0.860 | –1.0 | –0.36 | — | 3 |
| 0014+813 | 1.112 | — | –0.10 | +0.42 | 4 |
| 0450–132 | 1.174 | –1.5 | –0.22 | — | 3 |
| 0449–134 | 1.267 | –1.5 | –0.28 | — | 3 |
| 0935+417 | 1.373 | –1.0 | –0.39 | +0.26 | 5 |
| 0216+080 | 1.768 | –1.0 | –0.07 | — | 3 |
| 0528–250 | 2.141 | –1.3 | –0.58 | — | 3 |
| Ref. | |||||
| Stars with | –1.0 | –0.35 | +0.22 | 6 | |
| Stars with | –2.0 | –0.42 | +0.30 | 6 |
[X/Fe]obs: apparent metallicity not corrected for possible effects of dust (see text for more details).
(1) Present work; (2) Prochaska & Wolfe (1997); (3) Lu et al. (1996); (4) Roth & Songaila (1997; in preparation) ; (5) Meyer et al. (1995); (6) Ryan et al. (1996).
The most natural reference for early galactic abundances comes from the study of metal-poor stars in the Galactic halo (Ryan et al. 1996, and refs. therein). In the last rows of Table 5 we give the typical Mn and Ti abundances relative to Fe found by Ryan et al. (1996) at metallicities [Fe/H] = –1 and –2. The [X/Fe]∗ values given in the table have been estimated from the midmean vector defined by Ryan et al. (1996) and have a scatter of 0.1 to 0.2 dex.
For the depletion pattern, we assume that the dust has the same general properties as Galactic interstellar dust and we adopt the representative values given by Jenkins (1987). By analogy with the interstellar medium, we define the depletion of an element X in the QSO absorber as The intrinsic element-to-element ratios in the DLA, , are related to the observed ratios, , by means of the relation Since the quantities are unknown we assume = and we compute which represents an estimate of the metallicity after correction for dust effects. In Table 6 we give the [X/Fe]est values in two cases: (1) base depletions and (2) dense depletions, representative of interstellar lines of sight with a low and a high amount of dust, respectively.
| Base depletion1 | Dense depletion2 | ||||
|---|---|---|---|---|---|
| QSO | |||||
| 0118–272 | 0.558 | –0.02 | +0.06 | –0.34 | +0.98 |
| 2206–199 | 0.752 | –0.53 | +0.02 | –0.85 | +0.94 |
| 0454+039 | 0.860 | –0.79 | — | –1.11 | — |
| 0014+813 | 1.112 | –0.53 | +0.17 | –0.85 | +1.09 |
| 0450–132 | 1.174 | –0.65 | — | –0.97 | — |
| 0449–134 | 1.267 | –0.71 | — | –1.03 | — |
| 0935+417 | 1.373 | –0.82 | +0.01 | –1.14 | +0.93 |
| 0216+080 | 1.768 | –0.50 | — | –0.82 | — |
| 0528–250 | 2.141 | –1.01 | — | –1.33 | — |
[X/Fe]est = [X/Fe]obs – ( )
1 Dust with Galactic base depletion pattern:
( ) = +0.43 and ( ) = +0.25.
2 Dust with Galactic dense depletion pattern:
( )= +0.75 and ( )= –0.67.
The potential presence or absence of dust and the possibility of a solar- or of a halo-type abundance pattern combine to give four possible basic pictures:
-
•
No dust and solar-like abundances. In this case it should be [X/Fe]dla = [X/Fe]obs = 0 for both Mn and Ti. This possibility is excluded from an inspection of Table 5. We are forced to invoke dust and/or chemical evolution effects.
-
•
Dust and solar-like abundances. In this case the metallicities should be solar after correction for dust effects, i.e. [X/Fe]est 0 for both Mn and Ti. As can be seen in Table 6, this condition is satisfied only by the absorber in PKS 0118–272 for dust with base depletion pattern. None of the absorbers satisfies this condition if a dense depletion pattern is assumed.
-
•
No dust and halo-like abundances. The metallicity is given directly by [X/Fe]obs, without correction for dust; if the chemical history of the absorbers follows that of our Galaxy, then should be [X/Fe]obs [X/Fe]∗ in Table 5. With the exception of the system, all the QSO absorbers show the typical trends of metal-poor stars, i.e. [Mn/Fe] 0 and, when available, [Ti/Fe] 0. In particular, the system in QSO 0935+417 matches remarkably well the Galactic halo abundances of both elements.
-
•
Dust and halo-like abundances. In this case the metallicities corrected for dust should match those of metal-poor stars, i.e.[X/Fe]est [X/Fe]∗ in Table 6. The absorber in QSO 0014+813 approximately matches the condition for base elemental depletion. No absorbers fulfil this requirement for a dense depletion pattern.
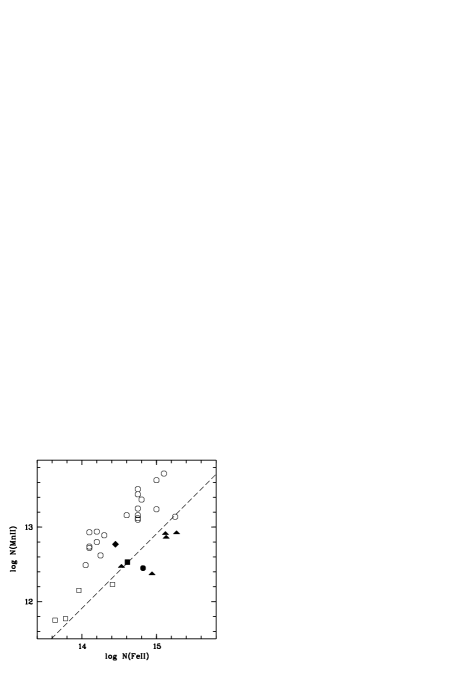
In summary, in the sub-sample of QSO absorbers considered we have some cases consistent with dust-free, metal-poor gas (for example the system in QSO 0935+417), one case consistent with metal-poor gas with dust (the absorber in QSO 0014+813), and finally the system under investigation which is the only case indicating gas plus dust with overall solar-like composition. The full set of observations is consistent with a simple evolutionary scenario in which at early cosmic time the gas is metal-poor and the dust not yet developed, at an intermediate phase the dust starts to form and, finally, closer to the present time, the absorber has attained an overall (gas plus dust) solar composition. If this evolutionary interpretation is correct, the QSO absorbers are migrating in Fig. 3 from the region below the dashed line (i.e. the solar ratio), where dust is absent and the gas is metal-poor, to the region above the dashed line, where dust has already been formed and the metallicity is solar-like. This scenario is consistent with the suggestion by Lu et al. (1996) that high-redshift DLA systems () are essentially dust-free and show a halo-like pattern of metallicities. However, this interpretation has problems in explaining the full set of observed abundances in DLA systems. For instance, the measured [Zn/Fe] ratios do not follow the expected halo-like trend. Moreover, the nitrogen over-abundances and the [S/Zn] solar ratios observed in some DLA systems (Molaro et al. 1996, 1997) are contrary to those expected at low metallicities and suggest that these systems may have a peculiar chemical history (Matteucci et al. 1997). In addition, there are indications that dust is present also at high redshifts, albeit at a dust-to-gas ratio about 10% of the Galactic value (Pettini et al. 1997; Fall & Pei 1989). Finally, deviations from the basic evolutionary scenario can be expected if DLA systems include galaxies of different morphological type, as indicated by the study of Le Brun et al. (1997).
6.2 Dense vs. base dust depletion
This study suggests that the dust, when present, has properties typical of low-density lines of sight, i.e. base depletion rather than dense depletion pattern. This might be the result of a selection bias: if the gas with base depletion has a larger cross section than the gas with dense depletion, then a sample of lines of sight randomly distributed through the absorbers will preferentially intersect gas with low depletion. A larger cross section of gas with low depletion is observed in the Galaxy, where dense depletion is generally found in lines of sight crossing clouds with small geometrical filling factors.
6.3 [Mn/Fe] and [Ti/Fe] ratios as discriminants between dust and chemical evolution
As pointed out by Lu et al. (1996), the opposite behaviour of manganese and iron with respect to differential depletion ( [Mn/Fe] 0 in the ISM) and to chemical evolution ( [Mn/Fe] 0 in halo stars) makes the [Mn/Fe] ratio a good diagnostic for disentangling the two effects. The absorber is the first example which shows clear evidence of dust on the basis of its positive [Mn/Fe] ratio. In principle, [Ti/Fe] is also a good discriminant, since titanium is usually more depleted than iron and so [Ti/Fe] 0 in the ISM, while [Ti/Fe] 0 in halo stars. However, the slope of the interstellar correlation of with the average gas density along the line of sight is much steeper than the slope of the correlation (Jenkins 1987). Thus, in lines of sight with low density titanium is less depleted than iron and [Ti/Fe] 0, as in halo-like abundances. Therefore, caution should be used in using the [Ti/Fe] ratio to unravel dust depletion from metallicity evolution, especially if base depletion is more commonly detected in the absorbers, as discussed in the previous paragraph. The positive [Ti/Fe] ratio in the = 0.558 system is perfectly consistent with the presence of dust with no need to invoke a halo-like abundance pattern.
6.4 vs. correlation
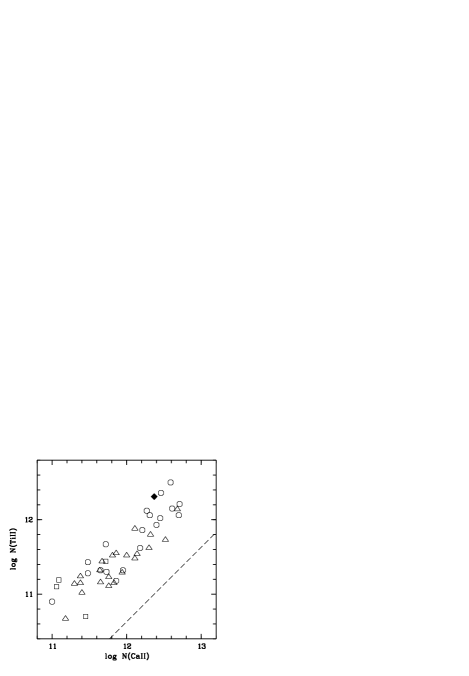
The = 0.558 system towards PKS 0118–272 is the only QSO absorber with both and column density measurements. In Galactic interstellar clouds there is a well known correlation between () and () (Albert et al. 1993 and refs. therein). In Fig. 4 we compare () and () in our system and in Galactic clouds. Considering the high spread of calcium and titanium depletions and the possible presence of ionization effects ( can also exist in regions), it is remarkable that the point corresponding to PKS 0118-27 matches the interstellar - correlation. This result reinforces the conclusion that the absorber originates in the interstellar gas of an intervening galaxy. Chemical evolution effects are not expected since Ti and Ca show similar trends in Galactic halo stars, i.e. [Ca/Fe]∗ [Ti/Fe]∗ (Ryan et al. 1996).
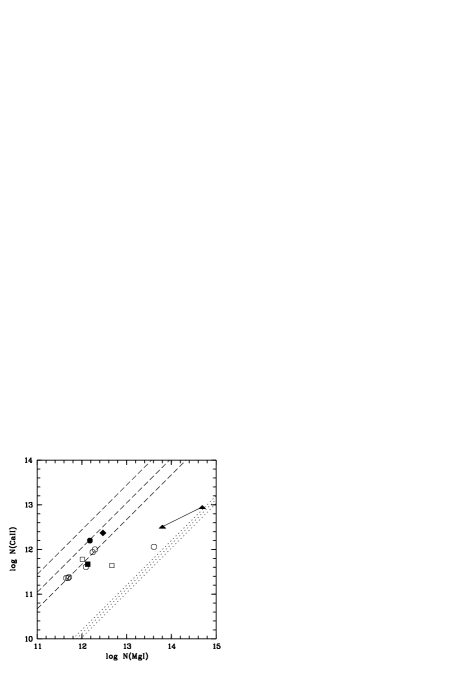
6.5 ratio and physical state
The ratio between and column densities is quite sensitive to the physical parameters of the gas. In the Appendix we derive an expression for the ratio, which is valid for Galactic interstellar gas. The ratio should be insensitive to chemical evolution effects since [Ca/Fe]∗ [Mg/Fe]∗ in metal-poor stars (Ryan et al. 1996). In Fig. 5 we compare measured and column densities with predicted values of the ratio based on the equation derived in the Appendix. Measurements include the few QSO absorbers with both species measured (filled symbols) and Galactic interstellar clouds observed at high spectral resolution (FWHM 5 km s-1) both in and in (empty symbols). The data points corresponding to low redshift absorbers are not separated from, but rather overlapping with those corresponding to interstellar gas. This suggests qualitatively that the physical conditions in the QSO absorption systems are similar to those found in interstellar clouds. The measured ratios span at least one order of magnitude, but there is some evidence of grouping around some specific values. Three out of the 4 QSO absorbers (including our system), together with the Galactic high-velocity components to SN1993J or HD 149881 have –0.2. The absorber at = 0.692 in 3C 286 and the low-velocity SN1993J component originating in the Galactic disk have instead –1.4. The predicted / ratios are shown in Fig. 5 as dotted lines (cold gas with dense depletion pattern) and dashed lines (warm gas with base depletion). The / ratio is expected to be higher in warm gas with low depletion than in cold gas with high depletion. The models of warm gas with low depletion naturally match the Galactic high velocity components of SN1993J, while the models of cold gas with high depletion match the disk component of SN1993J. If the same results can be applied to the QSO absorbers, then the 3 absorbers with relatively high ratio are associated with warm gas and low depletion, whereas the = 0.692 absorber in 3C 286 is associated with cold gas and high depletion. This is consistent with the hypothesis that lines of sight through highly depleted gas are less common than lines of sight with low depletion (see 6.2).
6.6 Kinematics and location of the absorber
Multiple components with velocity spread up to a few hundred km s-1 are frequently found in DLA systems and are interpreted as a signature of a rotating galactic disk. The simple kinematical structure of the absorber (Sect. 3.1) does not exclude that the line of sight is intersecting a galactic disk. In fact, if the galaxy is seen face on, the profile is not be expected to be broadened by disk rotation. Also the absorber at = 1.3726 towards QSO 0935+417, one of the other two DLA systems at moderate redshift studied at high resolution, shows a simple kinematical structure. Therefore, the lack of multiple components does not contradict our conclusion that the =0.558 absorber is a DLA system.
The detection of and gives some indication on the location of the absorbing gas in the intervening galaxy. In our Galaxy the scale heights of and above the Galactic plane are 1 kpc and 1.5 kpc respectively (Albert et al. 1993; Lipman & Pettini 1995). This is consistent with an origin in the disk of the galaxy intercepted by the line of sight.
The observations of PKS 0118–272 are consistent with the presence of a luminous host (MR = –23.5) of the BL Lac. We do not believe, however, that the absorber is associated with the host galaxy. Host galaxies of BL Lac objects are generally elliptical or bulge-dominated systems of absolute magnitude comparable with that of giant ellipticals (Falomo 1996 and refs. therein). Even though several interstellar tracers have been detected in elliptical galaxies, there is no evidence that neutral hydrogen is a common interstellar constituent of ellipticals (Roberts et al. 1991). This fact argues against an origin of the absorber in the host galaxy. In addition, if the absorbing gas were located close to the source, its ionization degree would probably be affected by the extremely high luminosity of the host ( mag; Falomo 1996) and of the BL Lac active nucleus itself. On the contrary, the general properties of the system are indistinguishable from those of interstellar clouds embedded in the radiation field of our Galaxy, as mentioned in the previous paragraphs.
7 Summary and future work
Studies of Damped Ly systems at moderate redshift () are quite rare, but important for linking the properties of high redshift DLA systems with those of present-day galaxies. We expect a gradual variation of the properties with redshift (i.e. cosmic time) as a consequence of galactic evolution. From the present study we find that the = 0.558 absorber in the direction of PKS 0118–272 is most likely a Damped Ly system at low redshift since our indirect estimates of the hydrogen column density yield a conservative lower limit () 2.5 1019 cm-2 and, more likely, () 2 1020 cm-2. The system most likely originates in a galactic disk in front of PKS 0118-272, a conclusion supported by the following results:
-
•
We detect a galaxy at only 1.6′′ from the BL Lac object by applying a PSF subtraction technique to our imaging data. If this close companion is at the redshift of the system, its projected distance is 14 kpc, consistent with typical impact parameters of companion galaxies associated with DLA systems (Le Brun et al. 1997).
-
•
The , and column densities and their ratios are remarkably similar to corresponding values measured in Galactic interstellar clouds. The and column densities obey the well known interstellar correlation between these two quantities, the first evidence of this kind for a QSO absorber. The and column densities and their ratio, which is sensitive to physical conditions in the absorbing gas, are in line with measurements and theoretical predictions for interstellar clouds. These results, together with the relatively low scale height of and in our Galaxy, suggest that the absorber originates in a galactic disk.
We compared the [Mn/Fe] and [Ti/Fe] ratios measured in our system with similar measurements in QSO absorbers, in halo stars and in Galactic insterstellar gas. Since depletion on dust grains acts as a disturbance for measuring the intrinsic metallicity, we corrected the ratios measured in the DLA systems from the effects of dust by using values of Galactic differential depletion in two representative cases: base depletion, typical of lines of sight with low density, and dense depletion, typical of high density interstellar clouds. The outcome of this comparison can be summarized as follows:
-
•
For the first time in a QSO absorber we find [Mn/Fe] 0, a clear signature of dust. Previous studies of DLA absorbers have found [Mn/Fe] 0, a result which has been interpreted as signature of a halo-like metallicity pattern.
-
•
We find a positive [Ti/Fe] ratio, similar to the measurements of this ratio in DLA absorbers. However, we show that the [Ti/Fe] ratio is not well suited for discriminating between dust and chemical evolution.
-
•
Lines of sight with a dense depletion pattern appear to be uncommon among DLA absorbers.
With the limitations due to the small size of the sample, the data seem to be consistent with a simple evolutionary scenario in which at early epochs the absorbers are characterized by gas with low dust content, while closer to the present time gas and dust coexist like in the Galaxy. The absorber towards PKS 0118–272 could be the first DLA system for which we start to see the transition to present-day abundance and dust properties. A more realistic correction of DLA abundances from dust effects, able to take into account variations of metallicities and dust-to-gas ratios among the absorbers, is required to derive firm conclusions on the chemical evolution of the intervening galaxies (Vladilo 1997). Only by accumulating abundance measurements for a large number of DLA systems at high and low redshifts it will be possible to disentangle the different causes that combine to produce the observed properties of these systems, which include chemical evolution, dust evolution, spatial abundance gradients, filling factors of interstellar phases, and differences in morphological types of the DLA galaxies.
Ultraviolet spectroscopy of PKS 0118–272 is required to perform a direct measurement of the column density from the Ly absorption profile; this will allow the absolute metallicity of the system to be determined. High spatial resolution spectroscopy of the the newly discovered companion at 1.6′′ from PKS 0118–272 is needed to measure its redshift and confirm its association with the absorber. Finally, high quality imaging from space is required to establish the morphological type of the companion. This would give the rare opportunity of linking the galactic morphological type to the spectroscopic properties of a DLA system.
Acknowledgements.
We thank J. Bergeron, D. Meyer, and K. Roth for providing results in advance of publication.Appendix: The interstellar ratio. The interstellar depletion of an element X in a diffuse medium with overall solar metallicity is usually defined as:
| (1) |
where and are the column densities of X and of hydrogen in the gas phase, and is the solar abundance. It is assumed that the fraction of the element not present in gas phase, which gives rise to a logarithmic depletion , is in dust. From (1) one has:
| (2) |
where and represent the sum over all ionization states of Ca and Mg atoms in gas phase. In interstellar regions, the fraction of neutral stages of the metals are generally negligible since they are ionized by photons with h 13.6 eV and one can write and From these relations we get and Even if does not represent the true depletion of calcium from gas to dust, it is a useful quantity for comparison with literature data. From the above relations we obtain
| (3) |
The ionization equilibrium equation for magnesium in regions is:
| (4) |
where is the photoionization rate, the collision ionization rate, the electron density, and the total recombination coefficient (radiative plus dielectronic). By multiplying the last two equations we finally obtain
| (5) |
This expression allows us to predict the value of the ratio for a range of physical parameters and depletions representative of interstellar conditions. We adopted the magnesium photoionization rate s-1 from Keenan (1984), the recombination coefficient from Shull & Van Steenberg (1982), the direct ionization rate from Arnaud & Rothenflug (1985), and an electron density = 0.03 cm-3. The ratio generally scales directly as the inverse of the electron density because collisional ionization is negligible compared to photoionization for the range of temperatures considered ( K). Representative values of are computed from the compilation of Crinklaw et al. (1994) by using the definition of base and dense depletions given by Jenkins et al. (1987). We find = –2.13 (base depletion) and = –3.79 (dense depletion). Corresponding values of are taken directly from Jenkins et al. (1987): = –0.16 for base depletions and = –0.72 for dense depletions. These values are derived from a survey of the 1240Å doublet (Jenkins et al. 1986) and should be increased by –0.67 dex if the revised oscillator strength of the 1240Å doublet is adopted (Sofia et al. 1994). For base depletion we have therefore = –2.0 (or –1.3 with the revised oscillator strength), while for dense depletion we have = –3.1 (or –2.4).
References
- [] Albert C.E., Blades J.C., Morton D.C., et al., 1993, ApJS 88, 81
- [] Anders E., Grevesse N., 1989, Geochim. Cosmochim. Acta 53, 197
- [] Arnaud M., Rothenflug R., 1985, A&AS 60, 425
- [] Bahcall J.N., Bergeron J., Boksenberg A., et al., 1996, ApJ 457, 19
- [] Bowen D.V., 1991, MNRAS 251, 649
- [] Bowen D.V., Roth K.C., Blades J.C., Meyer D.M., 1994, ApJ 420, L71
- [] Cohen R.D., Barlow T.A., Beaver E.A., et al., 1994, ApJ 421, 453
- [] Crinklaw G., Federman S.R., Joseph C.L., 1994, ApJ 424, 748
- [] Fall S.M., Pei Y.C., 1989, ApJ 337, 7
- [] Falomo R., 1991, AJ 102, 1991
- [] Falomo R., 1996, MNRAS 283, 241.
- [] Fontana A., Ballester P., 1995, The Messenger 80, 37
- [] Hannaford P., Lowe R.M., Grevesse N., Noels A., 1992, A&A 259, 301
- [] Jenkins E.B., 1987, Proc. Interstellar Processes, eds. Hollenbach D.J. & Thronson H.A., ASSL 134, 533
- [] Jenkins E.B., Savage B.D., Spitzer L. Jr., 1986, Ap.J. 301, 355
- [] Keenan F.P., 1984, MNRAS 206, 449
- [] Lanzetta K.M., Bowen D.V., 1992, ApJ 391, 48
- [] Lanzetta K.M., Wolfe A.M., Turnshek D.A., 1995, ApJ 440, 435
- [] Le Brun, Bergeron J., Boissé P., Deharveng J.M., 1997, A&A in press, (astro-ph/9611031)
- [] Lipman K., Pettini M., 1995, ApJ 442, 628
- [] Lu L., Sargent W.L.W., Barlow T.A., Churchill C.W., Vogt S., 1996, ApJS 107, 475
- [] Matteucci F., Molaro P., Vladilo G., 1997, A&A, 321, 45
- [] Melnick J., Dekker H., D’Odorico S., 1992, The EMMI and SUSY ESO Operating Manual
- [] Meyer D.M., Lanzetta K.M., Wolfe A.M., 1995, ApJ 451, L13
- [] Molaro P., D’Odorico S., Fontana A., Savaglio S., Vladilo G., 1996, A&A 308, 1
- [] Molaro P., Centurión M., Vladilo G., 1997, submitted to MNRAS
- [] Morton D.C., 1991, ApJS 77, 119
- [] Pasquini L., D’Odorico S., 1989, ESO Operating Manual N. 2
- [] Pettini M., King D.L., Smith L.J., Hunstead R.W., 1997, ApJ 478, 536
- [] Prochaska J.X., Wolfe A.M., 1997, ApJ 474, 140
- [] Roberts M.S., Hogg D.E., Bregman J.N., Forman W.R., Jones C., 1991, ApJS 75, 751
- [] Robertson J.C., Morton D.C., Blades J.C., York D.G., Meyer D.M., 1988, ApJ 325, 635
- [] Ryan S.G., Norris J.E., Beers T.C., 1996, ApJ 471, 254
- [] Shull J.M., Van Steenberg M., 1982, ApJS 48, 95
- [] Sofia U.J., Cardelli J.A., Savage B.D., 1994, ApJ 430, 650
- [] Spitzer L. Jr., Fitzpatrick E.L., 1995, ApJ 445, 196
- [] Steidel C.C., Bowen D.V., Blades J.C., Dickinson M., 1995, ApJ 440, L45
- [] Storrie-Lombardi L.J., McMahon R.G., Irwin M.J., Hazard C., 1996, ApJ 468, 121
- [] Vladilo G., 1997, submitted to ApJ
- [] Vladilo G., Centurión M., de Boer K.S., et al., 1994, A&A 291, 425
- [] Wolfe A.M., Lanzetta K.M., Foltz C.B., Chaffee F.H., 1995, ApJ 454, 698
- [] Wolfe A.M., Turnshek D.A., Smith H.E., Cohen R.D., 1986, ApJS 61, 249