Absorption dips in the light curves of GRO J165540 and 4U 163047 during outburst
Abstract
Using the RXTE PCA we discovered deep dips in the X-ray light curves of the black-hole candidates GRO J165540 and 4U 163047 during outburst. Similar kind of dips for GRO J165540 were found in 90 s measurements of the RXTE ASM during the same outburst. The duration of the dips in both sources is in the order of minutes. The occurrences of the dips observed with the RXTE PCA and ASM in GRO J165540 are consistent with the optically determined orbital period, and were found between photometric orbital phases 0.72 and 0.86. This constitutes the first evidence for orbital variations in X-rays for GRO J165540. The PCA data indicate that an absorbing medium is responsible for these dips. The X-ray spectra during the dips can be best described by a heavily absorbed component and an unabsorbed component. In the case of GRO J165540 we are able constrain the extent of the absorbing medium and the central X-ray source.
1 Introduction
X-ray intensity dips caused by an intervening medium have now been found in the light curves of various low-mass and high-mass X-ray binaries (e.g., Parmar & White pw88 (1988), Marshall et al. mmp93 (1993), Saraswat et al. sym96 (1996), and references therein). During the majority of these dips the X-ray spectra harden, which is indicative of photoelectric absorption of radiation from the central X-ray source. However, a simple neutral and uniform medium which absorbs the emission does not fit the X-ray spectra. Instead, the spectra reveal an excess flux at low energies (typically 4 keV) compared to that expected from the amount of absorption estimated from data above 4 keV.
In this Letter we report on such dips seen in the X-ray light curves of the black-hole (candidate) soft X-ray transients GRO J165540 and 4U 163047 during their 1996/1997 and 1996 outbursts, respectively, as obtained with the Proportional Counter Array (PCA) and the All Sky Monitor (ASM) on board the Rossi X-ray Timing Explorer (RXTE).
GRO J165540 was discovered during an outburst in 1994 and has since shown irregular outburst activity (e.g., Zhang et al. zes97 (1997)). Dynamical measurements suggest the compact star in GRO J165540 is a black hole, with a mass of 7 M⊙ (Orosz & Bailyn ob97 (1997), van der Hooft et al. hha97 (1997)). Recently, Ueda et al. (uit97 (1997)) found evidence for a 5.7 hr dip down to 25% of the out-of-dip intensity in the ASCA light curve of GRO J165540, with no clear evidence of spectral hardening. The X-ray dips reported here are considerably deeper (down to 8% of the out-of-dip intensity) and have much shorter duration (minutes). A preliminary announcement of the dips in GRO J165540 observed by RXTE has already been given by Kuulkers et al. (1997c ).
4U 163047 has shown outbursts every 600 days since at least 1969 (e.g. Kuulkers et al. 1997b ). The nature of the compact star in 4U 163047 is unknown. Its X-ray spectral (e.g. Barret, McClintock, & Grindlay bmg96 (1996)) and X-ray timing (Kuulkers, van der Klis & Parmar 1997a ) properties during outburst suggest it is a black-hole. Recently, Kuulkers et al. (1997a ; 1997b ) pointed out similarities in the X-ray behavior between 4U 163047 and GRO J165540, and postulated that they are similar kind of systems.
2 Observations and Analysis
The RXTE PCA (Bradt, Rothschild, & Swank brs93 (1993)) performed a public Target of Opportunity Observations of 4U 163047 on 1996 May 3 20:49–22:41 UTC, and of GRO J165540 on 1997 February 26 19:34–23:30 UTC. The data were collected with a time resolution of 16 s (129 photon energy channels, covering 2.0–60 keV) and 125 s (3 energy channels, covering 2.0–5.0–8.7–13.0 keV). The 16 s data were used in the X-ray spectral analysis. From the high time resolution data we constructed light curves by rebinning the “raw” (i.e., not corrected for dead time) background subtracted count rates to a time resolution of 0.25 s, and hardness values using count rate ratios binned to a time resolution of 0.25 s (GRO J165540) or 0.5 s (4U 163047). All X-ray spectral fits were performed in the range 2–30 keV (out of dip) or 2–20 keV (dip), and a 2% uncertainty was included in the data to account for uncertainties in the PCA response matrix (see e.g., Belloni et al. bmk97 (1997)). The X-ray spectra were corrected for background and dead time. Errors quoted for the spectral parameters were determined using =2.706 (90% confidence).
The ASM (Levine et al. lbcj96 (1996)) on board RXTE scans the sky in series of 90 s dwells in three energy bands, 1.5–3, 3–5, and 5–12 keV. Due to satellite motion and a 40% duty cycle, any given source is scanned 5–10 times per day. For our analysis we used the results provided by the RXTE ASM team, covering the period from 1996 February 21 to 1997 Jun 19.
3 Results
3.1 Intensity and hardness variations
The 2.0–13.0 keV count rates of GRO J165540 and 4U 163047 were generally 11 500 cts s-1 and 3000 cts s-1, respectively. However, both sources showed sharp deep drops in their count rates down to 1000 cts s-1, lasting 50–60 s for GRO J165540 (two events), and 140 s for 4U 163047 (one event), preceded and followed by short dips (Fig. 1, upper panel). We will refer to the out-of-dip count rate as the “persistent emission” (PE).
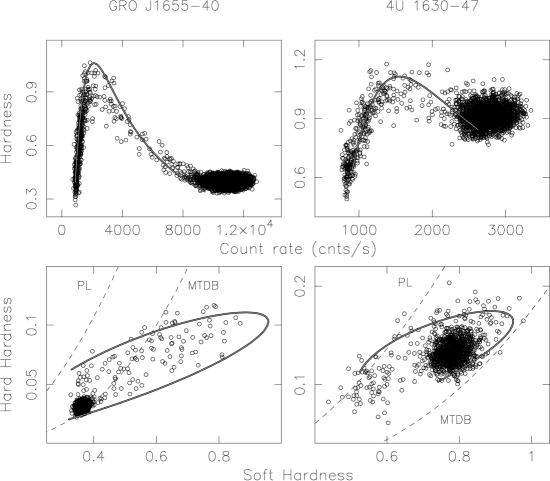
The fall time scales of the main dips of GRO J165540 are 2–4 s, while the rise time scales are 3–5 s. The hardness curve (Fig. 1, lower left panel) and corresponding hardness vs. intensity diagram (HID, Fig. 2, upper panel) of GRO J165540 show that as the intensity drops the X-ray spectrum becomes much harder, until a certain threshold count rate of 2000 cts s-1 is reached. During the last part of the fall the spectrum softens again to almost the same value as the PE level. The reverse behaviour is seen during the rise of the dips. In the HID the source always follows the same loop, also during the small pre- and after-dips and during the short spike in the second dip.
The fall and rise time scale of the main dip of 4U 163047 are 3 s. During its main dip several small flares occurred. The light curve and hardness behavior (Fig. 1, lower right panel; Fig. 2, lower panel) of 4U 163047 resembles that of GRO J165540. Below a certain threshold count rate the hardness is positively correlated with intensity. However, the change in hardness between the persistent and threshold count rate is much smaller than that observed in GRO J165540. Below the threshold count rate the hardness drops below the persistent value.
In Fig. 3 we plot the RXTE ASM light curve of the individual 90 s dwells for GRO J165540. 12 clear drops in the 2-12 keV intensity can be seen down by 25–95%. During these dips the spectral hardness increases. The occurrences of the ASM and PCA dips (Table 1) are best fit with a period of 2.62130.0005 days (1). All these dips occurred between photometric orbital phases 0.72 and 0.86 (Table 1).
3.2 Energy spectra
We constructed a series of 200 sec X-ray spectra just outside the dips, and individual 16 sec spectra at the bottom of the dips. Because of the 16 s time resolution we could not accumulate spectra during the rise and fall of the dips. The average count rates during the dip spectra are all below the threshold count rate.
Fits to the PE with simple single-component models did not give acceptable results. We therefore used the model usually employed for black-hole candidates, i.e., a disk-black body (DBB) plus a power law (Mitsuda et al. mxx84 (1984)), which gave values of 2. Using the mean spectral fits (Table 2) we find that the persistent 2–30 keV X-ray flux was 2.510-8 and 5.810-9 erg cm-2 s-1, for GRO J165540 and 4U 163047, respectively.
The spectral hardening between the PE count rate and the threshold value suggests that absorption is involved in the process giving rise to the dips. To verify this, we also made color-color diagrams (CDs, see Fig. 3). The data points for the two sources during the dips move from the crowded regions (PE) to the upper right part and then bend back to the lower left part of the CD (in the case of 4U 163047 the data points bend back almost immediately). The bend-over point corresponds to the threshold count rate. We also plotted the calculated hardness values for the DBB and power-law component separately for a range of values of the inner disk temperature, , and of the power-law index, , with interstellar absorption column density, . fixed to the persistent value (dashed lines in Fig. 2). With our choice of hardness ratios any linear combination of the two components has to lie between these two lines. Only in the CD of GRO J165540 part of the loop lies below the DBB line; this requires an increase in the absorption column.
Homogeneous absorption of the persistent DBB and power-law components by cold material did not fit the dip spectra well, especially at low energies. The observed flux below 6 keV is much in excess from that expected in this model. We performed simple fits to the spectra by modelling this low energy excess either as a separate component (power law or black body), or by partial absorption of the persistent components (e.g. Marshall et al. mmp93 (1993)). We find that the persistent power-law component is absent during the dips. We focus on the fit results to the spectra at the bottom of the dips (Table 3) to investigate the low-energy excess, since there the absorption is expected to be largest. We fixed to the values derived from the PE fits, except when using the partial covering absorption model for 4U 163047 because this lead to an unstable fit. When using a power law to model the low-energy excess plus an absorbed DBB for the dip spectrum of 4U 163047, the inner disk radius, , could not be constrained and was, therefore, fixed to its PE value.
The fits show that the shape and strength of the low-energy excess is very similar for both sources, and its contribution is only 6–7% of the PE flux. When the low-energy excess is modeled as a separate component, the DBB parameters are consistent with the PE values. When a partial covering model is used to describe the spectra, we get somewhat lower values for with respect to their PE values. Depending on the model we find that the absorption of the DBB component increased up to 25–2001022 and 35–3001022 cm-2 at the lowest mean dip intensities in GRO J165540 and 4U 163047, respectively.
To see if we can qualitatively reproduce the observed shapes of the HID and CD, we calculated several sequences of X-ray spectra and determined intensity and hardness values. The out-of-dip spectrum was modeled by the persistent DBB component (only subject to interstellar absorption) as given in Table 2, plus the low-energy excess contribution modeled by a black body, as given in Table 3. In the dip we linearly increased the absorption of the persistent DBB component from zero up to 150 and 3001022 cm-2, for GRO J165540 and 4U 163047 respectively, fixing the rest of the parameters to those given by the out-of-dip spectrum. The results are plotted in Fig. 2, and show that a gradual increase in absorption of the DBB component can reproduce the observed dip behavior.
4 Discussion
4.1 RXTE PCA and ASM dips
We have discovered short-term (minutes) X-ray dipping behaviour of GRO J165540 and 4U 163047, down to 8% and 30% of the out-of-dip intensity, respectively. We found similar intensity drops in GRO J165540 during 90 s measurements with the RXTE ASM. The duration of the dips is of the same order of those found in Cyg X-1 and Her X-1 (e.g., Kitamoto et al. kmt84 (1984), Leahy l97 (1997)), but is shorter than typically seen in LMXB dip sources (e.g., Parmar & White 1988).
The best fit period of the occurrence of the dips observed in GRO J165540 is consistent with the optical period of the system (Orosz & Bailyn 1997, van der Hooft et al. hha97 (1997)). This therefore constitutes the first evidence of the orbital period in GRO J165540 in X-rays. All these dips occurred between photometric orbital phases 0.72 and 0.86. We note that the X-ray dip in GRO J165540 seen with ASCA (Ueda et al. 1997) occurred near photometric orbital phase 0.6. The phasing of the occurrence of the X-ray dips is very similar to that observed in the low-mass X-ray binary dip sources (e.g., Parmar & White pw88 (1988)), which suggests a similar origin for the cause of the dips. The inclination of such sources which show only dips and no eclipses are in the range 60–75∘ (e.g., Frank , King & Lasota fkl87 (1987)). The inclination inferred for GRO J165540 (Orosz & Bailyn ob97 (1997), van der Hooft et al. hha97 (1997)) is in agreement with this. Since the dip behavior of 4U 163047 is so similar to that seen in GRO J165540, we propose that 4U 163047 is also seen at a relatively high inclination, i.e. 60–75∘.
4.2 An absorbing medium
The observed dips are caused by an intervening medium absorbing the out-of-dip (persistent) emission (PE). A simple neutral and uniform medium which heavily absorbs the PE, however, does not describe the spectra during the dips very well. The dip spectra can be best described by a heavily absorbed persistent component, plus a low-energy component which typically appears below 6 keV. Such an extra low-energy component has also been reported by Ueda et al. (1997) in GRO J165540 during their dip observed with ASCA, and has been seen during dips and eclipses in other low-mass and high-mass X-ray binaries (Sect. 1). We modeled this so-called low-energy excess as a power law or a black body (subject only to interstellar absorption), or alternatively by partial covering absorption of the persistent components. We find that the maximum absorption of the persistent components at the bottom of the dips (25–3001022 cm-2) is comparable to that found during the long dip in GRO J165540 observed with ASCA (Ueda et al. 1997) and the bottom of deep dips and/or eclipses of other binaries.
Several models have been proposed to explain the low-energy excess during dips and/or eclipses (e.g., Marshall et al. mmp93 (1993)). These include either a separate component which is not affected by the variable heavy absorption, or partial covering by a clumpy medium. The former has been proposed to be due to a scattering halo (e.g., Kitamoto, Miyamoto & Yamamoto kmy89 (1989)), or ionized absorber models, in which the absorbing medium is sufficiently ionized to reduce the soft X-ray absorption (e.g., Parmar & White 1988, Marshall et al. 1993). We note that Ueda et al. (1997) reported iron absorption lines during ASCA out-of-dip spectra of GRO J165540 which suggests the presence of highly ionized plasma. Alternatively, the low-energy excess may be the result of accumulating spectra over time scales longer than the intrinsic time scale for variability during the dips (e.g., Parmar et al. pwg86 (1986)).
Our spectral fits indicate that during the dips the persistent power-law component is absent. This suggests that the region where the bulk of the X-rays originate is not only subject to absorption, but that also the power-law emitting region is blocked from our view. Interaction of the inflowing gas stream from the secondary with the outer edge of the disk may cause a thickening of the outer edge and/or material above the disk in the expected 0.6–0.0 phase range (e.g., Parmar & White pw88 (1988)) and may well cause this absorption and shadowing.
Recently, Greiner et al. (gmr96 (1996)) showed that the Galatic superluminal source GRS 1915+105 had “dipping” behavior during its outbursts. The dipping activity in GRS 1915+105 is much more complex than that seen in our observations of GRO J165540 and 4U 163047. This dipping behavior has been proposed to be due to thermal-viscous instabilities in the inner disk (Belloni et al. bmk97 (1997)), and is therefore not related to the dipping behavior we see in GRO J165540 and 4U 163047.
4.3 GRO J165540
For GRO J165540 the system parameters have been well determined (Orosz & Bailyn 1997, Van der Hooft et al. 1997). In this system the time scales of the dips imposes constraints on the sizes of the different emitting and absorbing media. The fall and rise time (3.5 s) constrain the size of the region which is ”obscured”; in fact, this gives an upper limit on the size, because the region over which the column density increases significantly also has a finite width (Leahy, Yoshida, & Matsuoka lym94 (1994)). The duration of the dips (55 sec) constrains the size of the absorbing medium itself.
Since , we may assume that the absorbed X-ray source is much smaller than the absorbing medium. A medium which crosses a point-like central X-ray source may produce irregular X-ray dips, whereas crossing an extended region such as an accretion disk corona may produce smoother and longer energy independent modulations (e.g., Parmar & White pw88 (1988)). If the medium corotates in the binary frame and is located at a radius which is smaller than the outer disk radius (0.85 RL [Orosz & Bailyn 1997], where RL is the effective Roche lobe radius of the black hole) the upper limit on the size of the X-ray emitting region is 460 km. If the medium corotates with matter in the accretion disk (i.e., with a Kepler velocity), the upper limit becomes 1600 km. Similar reasoning gives an approximate upper limit on the size of the absorbing medium of 3800 km or 37 000 km, in the case of rotation within the binary frame or corotation in the accretion disk.
If partial ionization of material in the disk causes the low-energy excess during the dips, one can roughly estimate the location of the absorbing material (e.g., Parmar et al. 1986). For the material causing the intensity dips to be significantly ionized the ionization parameter (where is the central source luminosity, the gas density of the cloud and the distance from the central source to the clouds) must be larger than 100 ergs cm s-1 (see Hatchett, Buff & McCray hbm76 (1976)). Using a typical column density of 1001022 cm-2 at the bottom of the dips, an out-of-dip luminosity of L31037 ergs s-1 (at a distance of 3.2 kpc, Hjellming & Rupen 1995), and following Parmar et al. (pwg86 (1986)), we derive that the material closer than 3105 km from the X-ray source will be significantly ionized. Assuming the absorbing medium is more or less spherical and has a fixed position in the binary system, one gets (e.g., Remillard & Canizares rc84 (1984)) , and therefore 5000 km. So, if ionization plays a role, the absorbing medium should be located in the inner part of the disk. Frank et al. (fkl87 (1987)) suggested that the low-energy excess is caused by scattering of X-rays in hot clouds which are the result of material from the accretion stream which skimmed over the disk and formed a ring near the central X-ray source. Ionization may generate a two-phase medium which produce the dips. The expected circularization radius of the ring of material in this model is rather large for GRO J165540 (1106 km) so that material in this ring can not be easily ionized.
References
- (1) Barret, D., McClintock, J.E., & Grindlay, J.E. 1996, ApJ, 473, 963
- (2) Belloni, T., Méndez, M., King, A.R., van der Klis, M., & Van Paradijs, J. 1997, ApJ, 479, L145
- (3) Bradt, H.V., Rothschild, R.E., & Swank, J.H. 1993, A&AS, 97, 355
- (4) Frank, J., King, A.R., & Lasota, J.-P. 1987, A&A, 178, 137
- (5) Greiner, J., Morgan, E.H., & Remillard, R.A. 1996, ApJ, 473, 107
- (6) Hatchett, S., Buff, J., & McCray, R. 1976, ApJ, 206, 847
- (7) Hjellming, R.M., & Rupen, M.P. 1995, Nature, 375, 464
- (8) Kitamoto, S., Miyamoto, Yamamoto, T. 1989, PASJ41, 81
- (9) Kitamoto, S., Miyamoto, S., Tanaka, Y., Ohashi, T., Kondo, Y., Tawara, Y., & Nakagawa, M. 1984, PASJ, 36, 731
- (10) Kuulkers, E., Parmar, A.N., Kitamoto, S., Cominsky, L.R., & Sood R.K., 1997b, MNRAS, in press
- (11) Kuulkers, E., van der Klis, M., & Parmar, A.N., 1997a, ApJ, 474, L47
- (12) Kuulkers, E., Belloni, T., Méndez, M., van der Klis, M., Wijnands, R., Van Paradijs, J. 1997c, IAU Circ., 6637
- (13) Leahy, D.A., 1997, MNRAS, 287, 622
- (14) Leahy, D.A., Yoshida, A., & Matsuoka, M. 1994, ApJ, 434, 341
- (15) Levine, A.M., Bradt, H., Cui, W., Jernigan, J.G., Morgan, E.H., Remillard, R., Shirey, R.E., & Smith, D.A. 1996, ApJ, 469, L33
- (16) Marshall, F.E., Mushotzky, R.F., Petre, R., & Serlemitsos, P.J. 1993, ApJ, 419, 301
- (17) Mitsuda, K., Inoue, H., Koyama, K., et al. 1984, PASJ, 36, 741
- (18) Orosz, J.J., & Bailyn, C.D. 1997, ApJ, 477, 876, and erratum in ApJ, 482, 1086
- (19) Parmar, A.N., & White, N.E. 1988, Mem. Soc. Astr. It. 59, 147
- (20) Parmar, A.N., White, N.E., Giommi, P., & Gottwald, M. 1986, ApJ, 308, 199
- (21) Remillard, R., Canizares, C.R. 1984, ApJ, 278, 761
- (22) Saraswat, P., Yoshida, A., Mihara, T., et al. 1996, ApJ, 463, 726
- (23) Ueda, Y., Inoue, H., Tanaka, Y., Ebisawa, K., Nagase, F., Kotani, T., & Gehrels, N., 1997, ApJ, in press
- (24) van der Hooft, F., Heemskerk, M.H.M., Alberts, F., Van Paradijs, J. 1997, A&A, submitted
- (25) Zhang, S.N., Ebisawa, K., Sunyaev, R., et al. 1997, ApJ, 479, 381
Figure captions
Figure 1: The light curves (upper panel) and hardness curves
(lower panel) of GRO J165540 (left panel) and 4U 163047 (right panel).
Hardness is defined as the ratio of
the count rates in the 5.0–13.0 keV and 2.0–5.0 keV bands.
The time resolution in all
panels is 0.25 s, except for the lower right panel where it is 0.5 s.
T=0 s corresponds to 1997 May 3, 21:22:21 UTC for GRO J165540 and
1996 Feb 26, 20:48:46 UTC for 4U 163047.
Figure 2: Upper panel: hardness-intensity diagrams for GRO J165540
(0.25 s time resolution; left) and 4U 163047
(0.5 s time resolution; right), where hardness is defined as in Fig. 1.
The line through the data points corresponds to a simple model of the X-ray
spectra as described in the text.
Lower panel: ratio of the count rates in the
8.7–13.0 keV and 2.0–5.0 keV bands (”hard hardness”) versus the ratio of
the count rates in the 5.0–8.7 keV and 2.0–5.0 keV bands
(”soft hardness”) for GRO J165540 (left) and
4U 163047 (right). The data points (1 s averages) are given by open
circles. The upper left dashed line is for the power-law component,
whereas the lower right dashed line is for the disk black-body component.
The line through the data points corresponds to a simple model of the X-ray
spectra as described in the text.
Figure 3: RXTE ASM lightcurve of GRO J165540 of data from individual dwells of 90 s from 1996 Feb 21 (JD 2 450 135) to 1997 Jun 19 (JD 2 450 618). Datapoints separated by 2 d have been connected to guide the eye. Clearly, deep sharp dips can be seen. The arrows at the bottom denote the dips used in the text. Indicated is also the time of the dips observed with the PCA.
| Time | aafootnotemark: | Time | aafootnotemark: | Time | aafootnotemark: |
| (JD2 450 000) | (JD2 450 000) | (JD2 450 000) | |||
| 205.0796 | 0.86 | 225.2172 | 0.73 | 487.4261 | 0.75 |
| 220.0827 | 0.78 | 225.2183 | 0.73 | 487.4909 | 0.78 |
| 220.0850 | 0.78 | 228.1535 | 0.85 | 505.9143bbfootnotemark: | 0.81 |
| 222.6122 | 0.74 | 228.1546 | 0.85 | 505.9163bbfootnotemark: | 0.81 |
| 222.8194 | 0.82 | 254.3466 | 0.85 | 555.7916 | 0.83 |
| 222.8205 | 0.82 | 280.2353 | 0.72 | 555.7927 | 0.83 |
| 222.8681 | 0.84 | 296.2989 | 0.85 | 565.9994 | 0.73 |
| 222.8692 | 0.84 | 314.4044 | 0.75 | ||
| aafootnotemark: Photometric orbital phase (Orosz & Bailyn 1997). | |||||
| bbfootnotemark: RXTE PCA, see Sect. 3.1. | |||||
| Source | Apl | /dof | |||||
| (cts s-1) | (1022 cm-2) | (keV) | (km) | cm-2 s-1 keV-1) | |||
| GRO J165540 | 10807 | 2.170.11 | 1.1100.002 | 24.71.0bbfootnotemark: | 2.480.02 | 0.290.01 | 1.6/54 |
| 4U 163047 | 2759 | 12.30.3 | 1.2770.005 | 17.90.3ccfootnotemark: | 3.650.12 | 268 | 2.0/54 |
| aafootnotemark: Model: [ADBB], where is the interstellar absorption column density, | |||||||
| the photon energy, and DBB = Disk Black-Body model. | |||||||
| bbfootnotemark: Assuming a distance of 3.2 kpc (Hjellming & Rupen 1995) and inclination of 70∘ (Orosz & Bailyn 1997; Van | |||||||
| der Hooft et al. 1997). | |||||||
| ccfootnotemark: In units of , where is the inclination of the accretion disk and d10 the distance in units of 10 kpc. | |||||||
| power law + absorbed DBBaafootnotemark: | |||||||
| dipbbfootnotemark: | Apl | ccfootnotemark: | /dof | ||||
| (1022 cm-2) | (cm-2 s-1 keV-1) | (1022 cm-2) | (keV) | (km) | |||
| GRO J165540 | 2.17ddfootnotemark: | 4.6 | 34 | 27 | 1.10.2 | 7 | 2.0/41 |
| 4U 163047 | 12.3ddfootnotemark: | 4.50.1 | 73 | 3427 | 0.90.1 | 17.9ddfootnotemark: | 1.2/42 |
| black body (BB) + absorbed DBBeefootnotemark: | |||||||
| dip | fffootnotemark: | ccfootnotemark: | /dof | ||||
| (1022 cm-2) | (keV) | (km) | (1022 cm-2) | (keV) | (km) | ||
| GRO J165540 | 2.17ddfootnotemark: | 0.600.04 | 345 | 79 | 1.10.1 | 15 | 1.4/41 |
| 4U 163047 | 12.3ddfootnotemark: | 0.600.03 | 496 | 76 | 1.40.2 | 12 | 1.6/41 |
| partial covering absorption of DBBggfootnotemark: | |||||||
| dip | /dof | ||||||
| (1022 cm-2) | (1022 cm-2) | (keV) | (km) | ||||
| GRO J165540 | 2.17ddfootnotemark: | 0.9850.007 | 19117 | 0.890.03 | 10029 | 1.7/42 | |
| 4U 163047 | 5.71.0 | 0.970.01 | 299 | 1.190.07 | 67 | 1.2/41 | |
| aafootnotemark: Model: [A[DBB()]], where the photo-electric absorption cross section. | |||||||
| bbfootnotemark: GRO J165540 dip: =878 cts s-1; 4U 163047 dip: =860 cts s-1. | |||||||
| ccfootnotemark: In the case of 4U 163047 in units of , see also Table 2. | |||||||
| ddfootnotemark: Parameter fixed to the persistent emission value. | |||||||
| eefootnotemark: Model: [BB(,[DBB()]]. | |||||||
| fffootnotemark: Apparant black-body radius at 3.2 kpc (GRO J165540) or 10 kpc (4U 163047). | |||||||
| ggfootnotemark: Model: [][DBB()], where is the covering fraction. | |||||||