High-Speed Optical Spectroscopy of a Cataclysmic Variable Wind: BZ Camelopardalis
Abstract
BZ Cam is the first cataclysmic variable star with an accretion disk wind evident in its optical spectrum. The wind was found by Thorstensen, who discovered intermittent P Cygni profiles occurring simultaneously in He I 5876 Å and H We have since obtained spectra with 0.4-Å pixel-1 dispersion and 60-s time resolution.
We find a wind much faster and more rapidly variable than the radiatively accelerated winds of OB stars, Wolf-Rayet stars, or luminous blue variables. Instead of showing blob ejection, the whole wind of BZ Cam appears to turn on and off. We use this to measure the acceleration law of a CV wind for the first time. The velocity increases linearly with time, attaining blue edge velocities near , and absorption velocities near , in 6 to 8 min after starting near rest. We also find a subsequent linear deceleration to nearly rest in 30 to 40 min, perhaps an effect of dilution as the wind expands. No periodicity from rotational outflow is obvious.
This wind is erratic and incessantly variable, and perhaps bipolar and face-on, but not highly collimated. The P Cygni absorption events trace out sawtooth waves, occurring within 30 to 40 white dwarf radii from the disk. This is the approximate size of the disk, as well as the disk/wind transition region recently postulated by Knigge and Drew. We estimate a distance of pc, and an orbital inclination such that
1 Introduction
“It is good to see you are keeping BZ.”
– Prof. J. R. Thorstensen
Mass loss from cataclysmic variable binary stars (CVs) is nothing new. Classical novae are well known to eject shells during their thermonuclear eruptions. CV winds were discovered with space ultraviolet spectra (Krautter et al. 1981; Córdova & Mason 1982). These winds’ velocities span 3000 – 5000 , the range of white dwarf escape velocities.
BZ Cam is an unusual CV, however. Long called just 0623+71, it lies in a nebula, discovered by Ellis, Grayson, & Bond (1984) and designated EGB 4. The nebula itself is unusual, having a bow-shock morphology (Krautter et al. 1987; Hollis et al. 1992). Also unusual about BZ Cam is that its optical spectrum reveals a wind. This was serendipitously discovered by Thorstensen, Thomas, & Patterson (1993), and published by Patterson et al. (1996), or Paper I. They found P Cygni profiles, or blue-shifted absorption indicating outflows, occurring intermittently in both the He I 5876 Å and H emission lines.
BZ Cam does not show photometric behavior usually considered to be outbursts (Garnavich & Szkody 1988). Such CVs are often called nova-likes, because their spectra resemble those of novae between eruptions—sometimes. Nova-likes also resemble dwarf novae during their accretion-powered outbursts, both having winds, for example. CV winds are thought to be bipolar, since the P Cygni profiles in their ultraviolet resonance lines are not seen in eclipsing CVs (Córdova & Mason 1985). BZ Cam does not show blue-shifted absorption clearly detached from the main line profile, as in the symbiotic binary MWC 560 and attributed to highly collimated jets (Tomov et al. 1992), but jets are rare in CVs, anyway (Livio 1997; Shahbaz et al. 1997).
Nearly all accretion disks, from those found in star formation to those of AGNs, have outflows: see the review on CV winds by Drew (1997), as well as many other papers on disk outflows in the same volume. CVs are close binary stars in which an approximately main-sequence K or M star fills its Roche lobe and spills onto a white dwarf. The orbital motion makes the gas stream settle into a ring around the white dwarf. Ill-understood viscous dissipation spreads the ring into a disk, and gas accretes onto the white dwarf. CVs’ luminosities are usually dominated by the light of their accretion disks. Sometimes, the white dwarf’s magnetic field can partially or completely disrupt the gas flow through the disk: such systems are called magnetic CVs. For reviews on magnetic CVs, see Cropper (1990), Patterson (1994), and Warner (1995a), as well as many other articles in this last volume. For recent reviews on CVs in general, see Livio (1994) and Warner (1995b).
In this paper, we present spectra of BZ Cam with five times the spectral resolution and 12 times the time resolution of those of Paper I. These are among the first high-speed spectra of the wind in any CV. They show the acceleration and apparent deceleration of a CV’s wind for the first time.
2 Observations
We used the 4.2-m William Herschel Telescope and its ISIS double spectrograph (Unger et al. 1988) on 1995 February 6 – 7 and 7– 8 UT, or Nights 1 and 2. The blue arm of ISIS was centered on He I 5876 Å, and the red arm on H We will refer to the resulting spectra as the blue and the red spectra, respectively (even though we know 5876 Å is yellow). The R1200B and R1200R gratings were used with TEK CCDs, with the dichroic centered on 6100 Å. All spectra had 0.4 Å pixel-1 dispersion.
The weather was photometric on Night 1, with seeing of 0.6 – 0.8′′ throughout the run. Some high clouds early on Night 2 were probably avoided, as shown by the First Quarter Moon. The slit was 1.0′′ wide on the sky. It was set to a position angle of to cover BZ Cam and a second star, 96′′ northwest, as a photometric comparison.
All exposures had 20-s integrations and 10 s of dead time, to read out the CCDs. This yielded over 1300 spectra, total. To improve the signal-to-noise ratio (S/N), we co-added the spectra in pairs, so all shown have 60-s time resolution. Typical S/N at the continuum was 36 after co-adding, for all spectra.
A problem we discovered with the data acquisition system haunted us throughout the run. Every time 400 spectra were taken, a bug deep in the system software would awaken and stall it, demanding a reset of nearly all the equipment. This caused the larger gaps in the trailed spectrum plots shown in Figures 1 and 3. The smaller gaps were introduced by taking spectra of Cu-Ne comparison lamps for wavelength calibration, as well as of standard stars for flux calibration. Lamps and standards were taken at the beginning and end of each night, as well, and at the ends of the large gaps. The lamp spectra show the velocity scale was stable to within 5 . The Na D lines, being interstellar (see Section 3.5), were stationary to within 9.2 km s This reassures us that the spectrograph and wavelength scale were stable. Observing HD 32963 ( : Foster et al. 1997) allowed calibrating the absolute velocity scale, to within . The Na D lines gave an average absolute heliocentric radial velocity, for all blue spectra, of . All velocities and times reported are heliocentric, all times being for start of exposure.
3 The spectra
3.1 Graphic representation
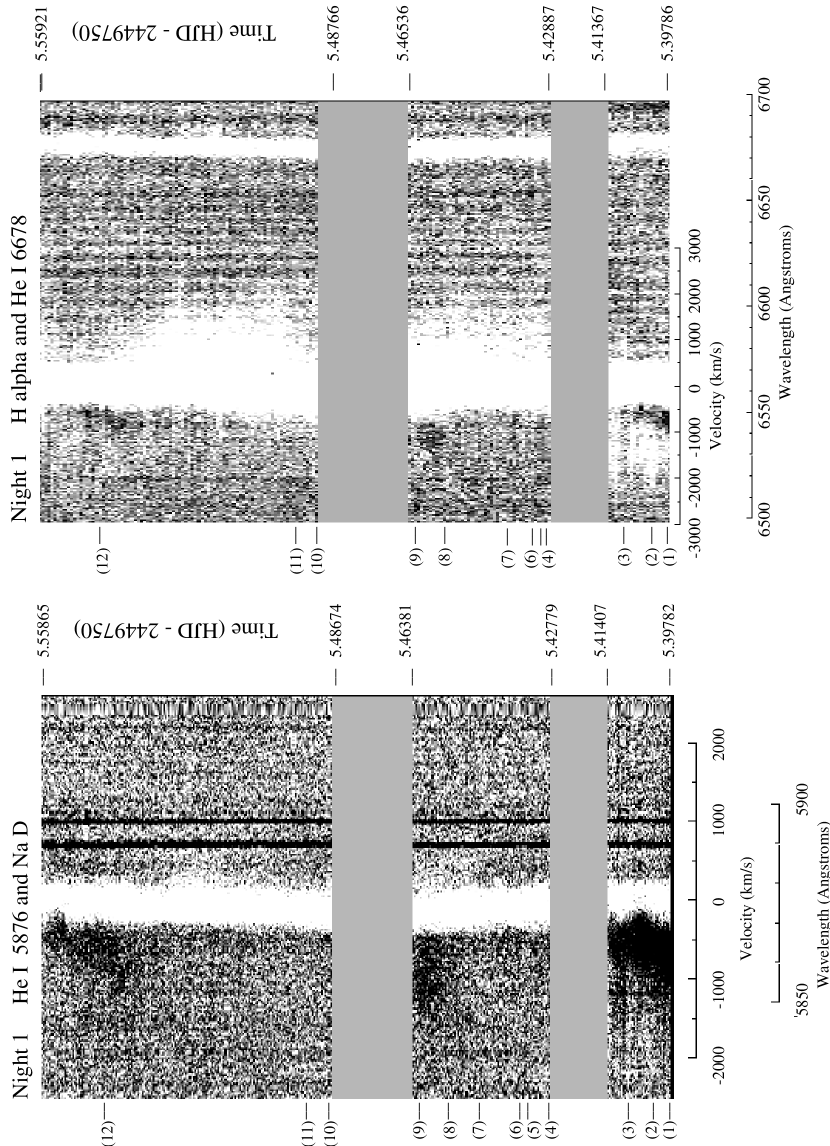
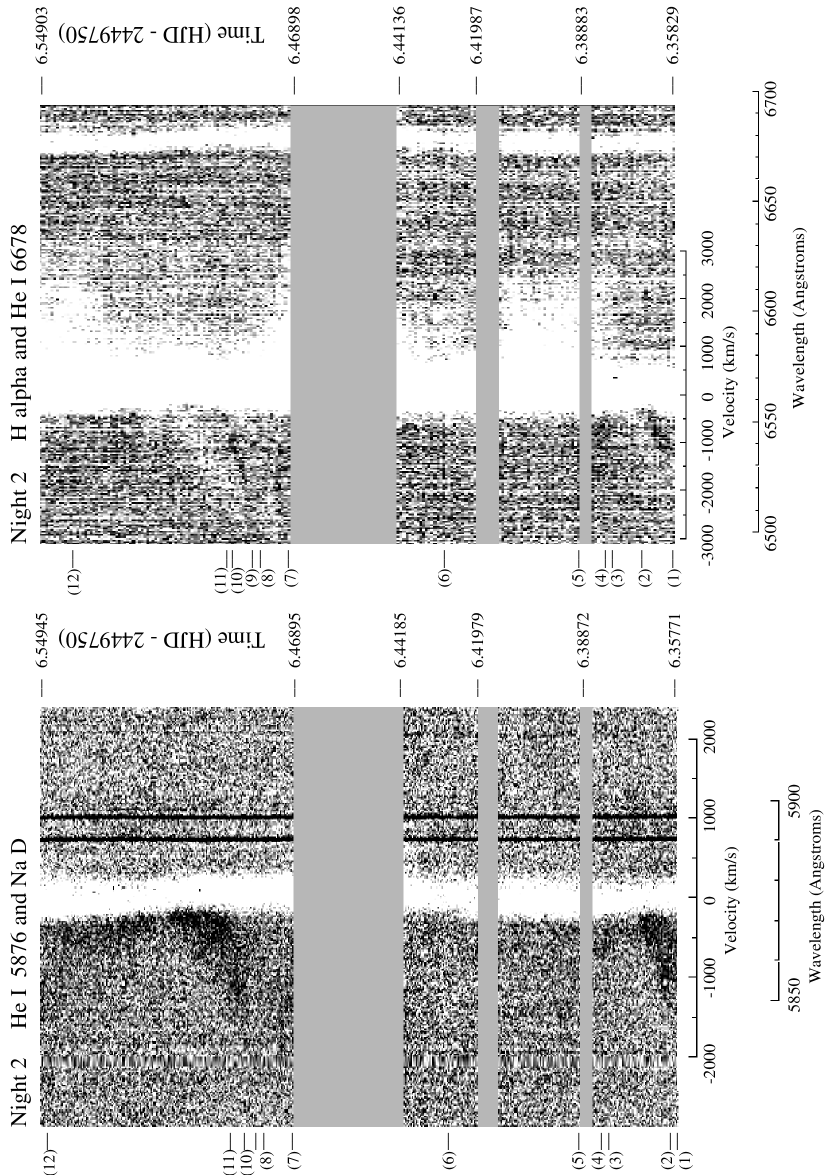
In Figures 1 and 3, the time-resolved spectra have been stacked next to each other, with the flux intensity depicted by the greyscale. Emission lines appear white, and absorption lines appear black. All spectra were rectified, to improve contrast in the plots. The rectification fitted a first-order cubic spline to each spectrum, and subsequently divided the spectrum by it. We chose this relatively simple function to avoid removing genuine continuum features—or installing spurious ones, which we carefully checked for by inspecting all spectra, before and after rectification. This was prompted by finding the unexpected line profile phenomena described below, for example the emission to the blue of H (denoted as em2).
The P Cygni events appear in Figures 1 and 3 as dark smudges to the left of the emission line. Diffuse white emission to the red of the main H emission line are features we will call red wings; they were also present in the spectra of Paper I. The two black vertical stripes are the Na D lines. Vertical striping in the grey continuum of the H image is from flat-field division that should have been smoother.
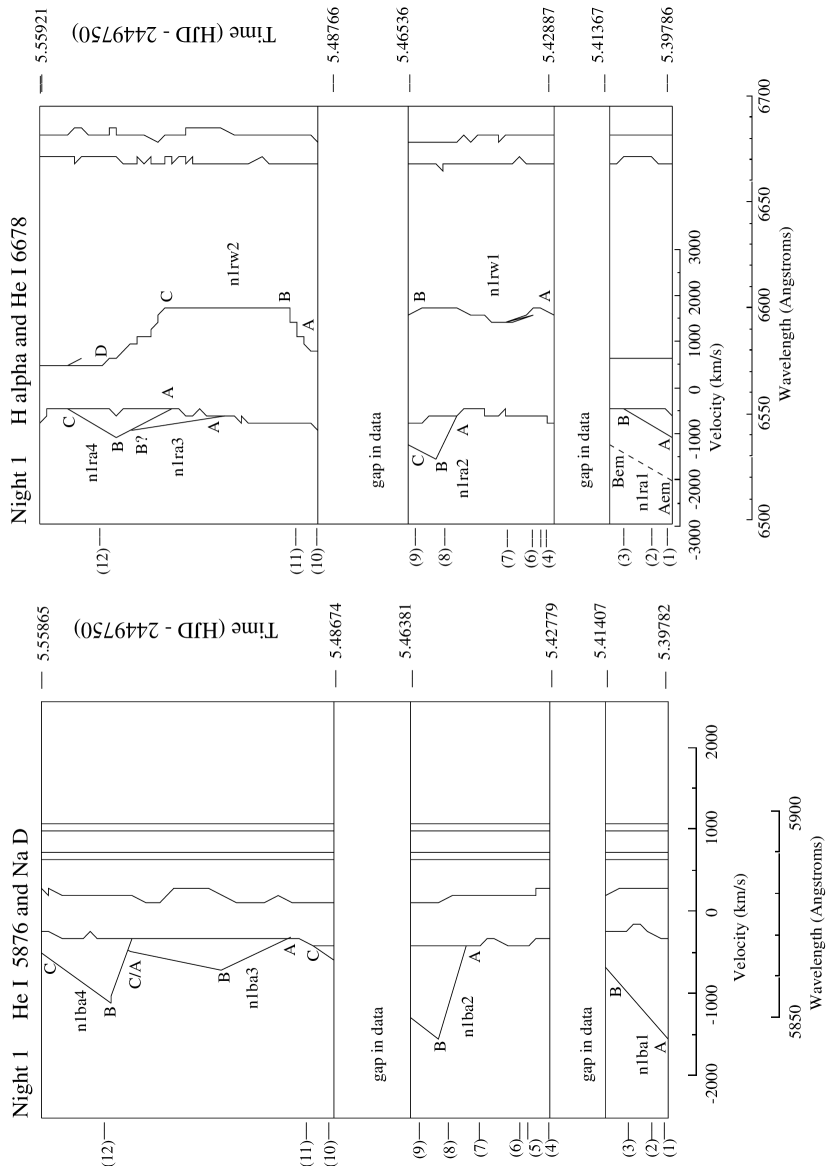
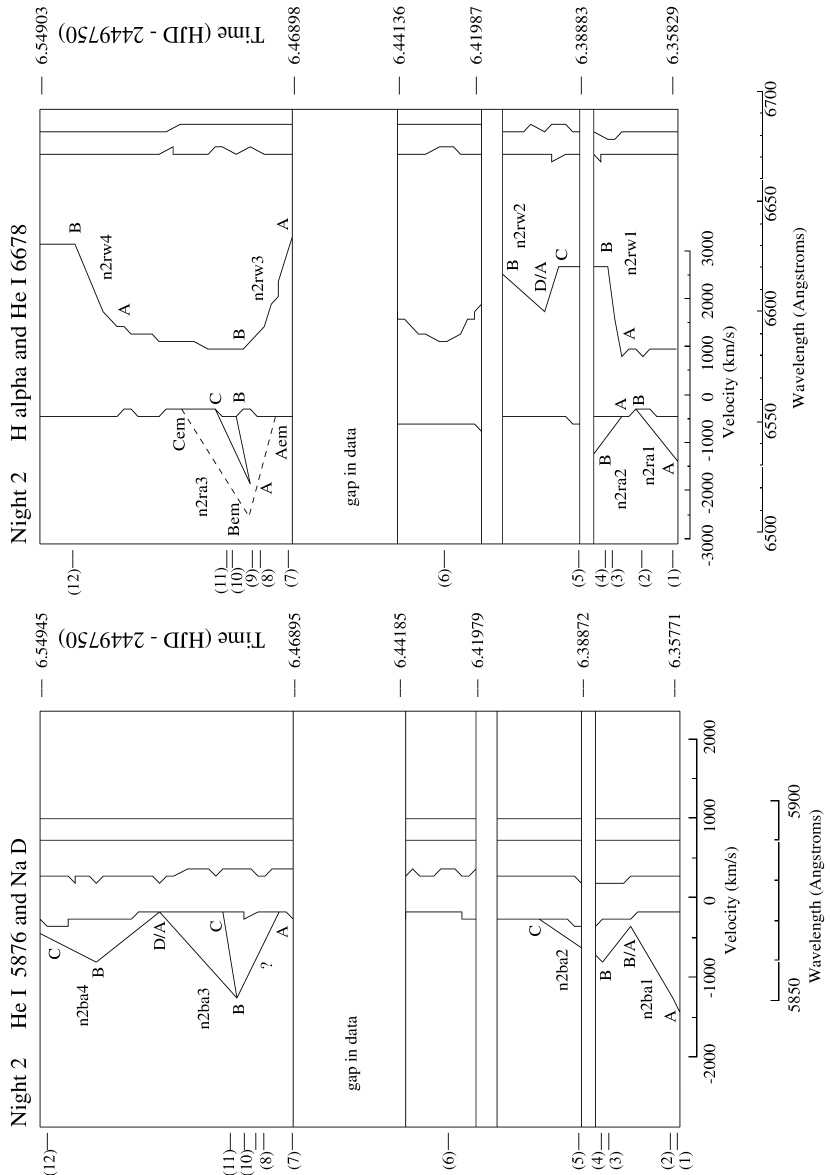
Figures 2 and 4 are schematic maps, included to help describe Figures 1 and 3. Features are labeled in a system we have devised. As examples, n1ba4 denotes Night 1 blue absorption 4, or the fourth P Cygni event on Night 1 in the blue spectrum; n2rw3 denotes Night 2 red wing 3, or the third thickening of the H red wing on Night 2.
3.2 The line components
Velocities and equivalent widths of various line profile features are plotted in Figures 5 and 6. Figure 7 is a schematic key to explain our notation for these features. Many are similar to those of Prinja & Rosen (1995), but as we examined the spectra, we noticed more features. Not all spectra showed all the features shown in Figure 7, however. Some do not have red wings; some do not have the blue emission component (em2); many don’t even show P Cygni absorption.
The dotted horizontal line in Figure 7 represents the normalized continuum. We define as the maximum blueward velocity of any emission component, where it met the continuum. Clearly, measurements of depend on S/N. is the velocity of the centroid of the main emission line component. is the velocity of the centroid of the second emission line component, to the blue of the main component. and are these components’ respective equivalent widths, including only area above the reference continuum. Figure 7 shows the limits they extend from and to, in all cases where they met the continuum: at to blue, and to red. In no case did
is the velocity of the centroid of the absorption component; of all these measured velocities, it is the one most clearly traced in Figures 1 and 3. is the equivalent width of this absorption component, the area below the reference continuum. marks the local minimum in the emission line, in cases of a pronounced red emission component. is the centroid of the local maximum, to the red of this local minimum. represents the maximum redward velocity of any emission component.
Errors were estimated by count statistics (Horne, Wade, & Szkody 1986). This ignores systematics, but a rigorous error analysis is impossible with so many unknowns, e.g., how, where, and at what velocities the lines form.
3.3 Spectrum variability
At least eight definite P Cygni absorption events appeared, in a total of 6.6 hours of observations spread over 7.5 hours (see Figures 1 – 4 and Table 1). This agrees with the rate of Paper I, with events recurring on the average of about every two hours, and lasting for an average of about one hour: about half the time, an event was occurring.
CV winds have long been thought to resemble those of OB stars, because of their similar temperatures and line profiles (Krautter et al. 1981; Mauche & Raymond 1987; Drew 1987, 1997). We were therefore surprised to find that, except for an initial acceleration, the absorption troughs of the P Cygni profiles of He I 5876 Å moved redward over time, not to the blue as expected for an outflow. The maximum velocity of these absorption troughs was about from the rest frame. The events appeared from within 6 to 8 to as many as 20 min, and lasted for 30 to 40 min. In both acceleration and deceleration, the velocities were linear functions of time.
As in Paper I, the P Cygni events showed no correlation with orbital phase. This is more obvious with He I 5876 Å, since the orbital velocity variation shows clearly in Figures 1 and 3, the observations on both nights lasting just over one orbital period (3.679 hours, Paper I). The intervals between events were uneven: on Night 1, events occurred near maximum blueshift and maximum redshift; on Night 2, events occurred near descending node and maximum redshift. Still, the data have gaps, were taken on only two nights, and have short time baselines modulo one day. A long, multi-longitude, time-resolved spectroscopic study may yet show periodic behavior.
H also showed P Cygni events, occurring simultaneously with those of He I 5876 Å. The red wing of H extended by up to on both nights. This red-shifted emission may indicate rotating outflow, being a complement to blue-shifted absorption (Drew 1987; Mauche & Raymond 1987). However, it was uncorrelated with the P Cygni events: n1ra2 and n1rw1 occurred simultaneously, but n1ra1, n2ra1, and n2ra3 are not associated with an extended red wing. Red wing events can appear and disappear quite suddenly, within minutes.
There may be structure in both lines (see Figure 8), in spectra 2 and 12 of Night 1 in He I, and in spectrum 2 of Night 2 in He I. Perhaps this is blob ejection, but this is quite unlike the discrete absorption components in hot star winds, being small perturbations for example, in the O7.5 giant Persei (Prinja, Howarth, & Henrichs 1987), or in Wolf-Rayet stars (Moffat et al. 1988), or in the central stars of planetary nebulae (Méndez et al. 1990; Balick et al. 1996). In BZ Cam, the whole wind turns on and off. This is somewhat reminiscent of luminous blue variables, but on a much faster timescale, and at much higher speeds, since LBV winds vary over hundreds of over hundreds of days (Wolf 1992).
Included in Figures 5 and 6 for H are velocities measured by the method of Schneider & Young (1980), of convolving the line profiles with the derivative of a Gaussian and taking the centroids as the velocities. A Gaussian of 275 km s-1 FWHM was used, to allow comparison with Paper I. These velocities were then fit by least squares to a sinusoid of period held fixed at 0.1533 days. The fit is terrible (see Table 2), but then Paper I had similar problems, due to line profile variations. A more appropriate ephemeris would use velocities less disturbed by this: we therefore adopted for H which best fits a sinusoid, and based the ephemerides in this paper on it. This is of course just a relative ephemeris, measured from emission lines, and so not necessarily tracing the motion of either star (e.g., Thorstensen et al. 1991).
3.4 He I 6678 Å, inclination, and opening angle
He I 6678 Å traces a sinusoid as it moves about the orbit. Throughout Figure 8, it may show doubling in its line profile, but the line is faint and noisy. Nevertheless, whenever the line does appear doubled, the two peaks have a separation of , or about 12 pixels.
Comparing this to calculated line profiles (Horne & Marsh 1986), we estimate the orbital inclination This should be considered a lower limit, since BZ Cam has a strong wind, which could easily blur the line profile. One may alternatively assume the peaks come from the disk’s edge (Shahbaz et al. 1997), so the projected velocity is . The Keplerian velocity of the disk edge is where is the white dwarf mass in and is the orbital period in hours. Throughout the range of plausible white dwarf masses, from 0.3 to 1.4 the predicted varies only from to respectively. A weak upper limit may be estimated by assuming an average wind speed of 4000 . With the observed maximum , and we estimate Surely with no eclipses.
The opening angle of the wind may be estimated by where is the range in radial velocity of the emission components with respect to their mean velocities. From the widths of the red wing and em2 features, we estimate This implies for Surely since If there is no restriction on the wind’s opening angle.
3.5 Na D, distance, and
A CV with BZ Cam’s orbital period should have an approximately dM4 secondary star (Patterson 1984). Such a star should have (Bessell 1991), over 9 magnitudes fainter than the system (see below). Even with an equivalent width of 20 Å for Na D, typical for a dM4 star (Montes & Martin 1997), the secondary’s contribution to Na D should be negligible. There may be some contribution from cooler parts of the disk, but the Na D lines were stationary (see Section 2), and so largely interstellar. We expect absorption from the nebula to be negligible, since although Hollis et al. (1992) found the nebula to be 35 times denser than the surrounding ISM, the pathlength through the nebula is % the pathlength to Earth, the nebula subtending only 2′ (Krautter, Klaas, & Radons 1987).
The average equivalent widths of both Na D lines was 0.42 0.08 Å. With the relation of Allen (1973), we deduce a distance for BZ Cam of pc, versus 500 pc assumed by Krautter et al. (1987) and by Hollis et al. (1992).
BZ Cam varies over with an average (Garnavich & Szkody 1988). From through-the-slit magnitudes, we estimate that during our observations, with variability less than the errors. This brightness was similar to that in Paper I of . We assume and typical for nova-likes (Bruch & Engel 1995), and (Verbunt 1987) with (Seaton 1979). Paczyński & Schwarzenberg-Czerny (1980) give an inclination correction for an optically thick disk = -0.96 for and negative for For a distance of 830 pc, this implies an average ranging over —among the most luminous CVs, typically near (Warner 1987).
4 Discussion
4.1 Is BZ Cam really a CV?
Two aspects of BZ Cam are unusual, for a CV: its nebula and its line-profile variability. One should therefore consider carefully whether BZ Cam really is a CV, and whether it has an accretion disk.
BZ Cam is certainly a close binary star system, as shown by its sinusoidally variable radial velocity. BZ Cam shows many hallmarks of a CV, since it flickers, its orbital period is 3.679 h, and its spectrum resembles that of many nova-like CVs, with relatively weak lines on a strong continuum (Williams 1983; Paper I).
Both disk and magnetic CVs show erratic flickering in their light curves, thought to be from accretion, but still poorly understood. Still, it may be possible that BZ Cam is a detached close binary, and its observed flickering is not that of a CV, but is instead the erratic, “semi-irregular” variability of planetary nebula nuclei with strong winds (Bond & Ciardullo 1989; Handler et al. 1996). The observed photometry of BZ Cam, however, varies on the order of tens of seconds or faster (Pajdosz & Zoła 1992; Paper I). This seems too rapid for a planetary nucleus, which varies over hours. Photometry of planetary nuclei could have shown faster variability from flickering, but did not: it did show unrelated non-radial pulsations occurring over minutes (Ciardullo & Bond 1996).
Lines in semi-irregular planetary nuclei do show radial velocity variations. These generally have amplitudes of (Méndez, Herrero, & Manchado 1990), though, much smaller than in BZ Cam. However, the WC8 nucleus of NGC 40 has spectroscopic flickering in the center of its C III 5696 Å emission line that occurs over hours, with amplitudes of —which interestingly, change in velocity linearly with time (Balick et al. 1996). Hollis et al. (1992) argue that EGB 4 is not a planetary nebula, because they find the uncharacteristically low mass of , and because it is entirely shock-ionized.
BZ Cam may or may not have an accretion disk. The direct evidence of a disk is scanty: 0.8-Å resolution spectra should have shown a disk’s distinctive double-peaked profiles in the emission lines (Honeycutt, Kaitchuck, & Schlegel 1987). Other nova-likes with orbital periods similar to BZ Cam’s, the dreaded SW Sex stars (Thorstensen et al. 1991; Hellier 1996), also show single-peaked emission, even when they have deep eclipses. Our spectra of BZ Cam show no clear cases of double peaks in H but as mentioned in Section 3.4, the He I 6678 Å line had double peaks in about half the spectra containing this line.
The spectra of Williams (1983) were all taken at the same resolution, and so invite comparison. They show BZ Cam with a strong continuum, with H the strongest emission line, having equivalent width of only Å. The H and He I lines were in weak absorption, with equivalent widths ranging from 3 to 12 Å. The Balmer jump was in absorption, and there was little high-excitation emission from He II 4686 Å. In contrast, Williams’s spectra of magnetic CVs show H equivalent widths ranging from 16 to 87 Å, other Balmer lines and Balmer jumps invariably in emission, and He II 4686 Å emission lines among the strongest in the spectra. Magnetic CVs also do not show P Cygni profiles in their ultraviolet spectra. (An exception may be 1H 0551819: Mouchet et al. 1996.) Disk CVs often do, as does BZ Cam (Woods, Drew, & Verbunt 1990; Griffith, Fabian, & Sion 1995). Magnetic CVs show red wings in H (Crosa et al. 1981), but these are attributed to the gas stream, since they vary with orbital phase, unlike in BZ Cam. BZ Cam also does not show the coherent optical pulsations of magnetic CVs (Pajdosz & Zoła 1992; Paper I). Polarimetry, another indicator of magnetic CVs, appears not to have been published.
To summarize, BZ Cam is definitely a close binary. That it is anything but a CV seems improbable. It is likely to have a disk, although the evidence for this is not stunning. Still, the evidence for the alternative, that it is magnetic, is worse. The low -velocity (Table 2; Paper I) and narrow emission line widths suggest an almost face-on accretion disk. This may explain why we see P Cygni events, since nearly all accretion disks seem to be attended by bipolar outflows (e.g., Livio 1997). As shown in Section 3.5, its absolute magnitude appears to be brighter than average for a CV, but not astoundingly so. The simplest solution that fits all properties is that BZ Cam is a nearly face-on CV with a high-than-average mass transfer rate.
4.2 Mass loss and the acceleration of a CV wind
Why does BZ Cam do this? Only now is evidence for mass loss in CVs accumulating from their optical spectra, including AT Cnc, which showed a P Cygni profile in H (Smith et al. 1997), and V1315 Aql, which Hellier (1996) argues to show a P Cyni profile convolved onto its lines, although it is an eclipsing SW Sex star. V1193 Ori also at least once showed an H red wing, not unlike that in BZ Cam (Ringwald, Thorstensen, & Hamwey 1994). It would be of interest to check these CVs’ fields for faint nebulae.
Still, if this were common behavior for CVs, might it not have been seen long ago, in the hundreds of radial velocity studies done of CVs (e.g., Kraft 1964; Ritter & Kolb 1997)? It may partly be because BZ Cam may be nearly face-on, but this behavior has not been noticed around other bright, face-on, luminous CVs, such as RW Sex (Beuermann, Stasiewski, & Schwope 1992) or the old nova V603 Aql (Patterson et al. 1997). We note there is no published time-resolved spectroscopy of the bright VY Scl star MV Lyr while in its high state.
If there is a connection between high disk mass transfer rate and high wind mass transfer rate, one might surmise that BZ Cam has an high disk mass transfer rate, as corroborated by its high luminosity. We therefore hypothesize that BZ Cam shows P Cygni events and red wings because it has a roughly bipolar outflowing wind, seen face-on, although a spherical outflow cannot be excluded. Ejected shells coming toward Earth give the lines P Cygni profiles. When they expand and become dilute, they turn into emission lines, which disappear when they get faint. Ejected shells moving away from Earth manifest themselves as redshifted emission. Intermittent redshifted absorption features are not seen because they are blocked by the accretion disk.
This implies that BZ Cam has a disk. The blocking cannot be from an optically thick part of blue-shifted wind, since it is not always present when the red wing is (shown by events n1rw2 and n2rw2: see Figures 1 – 4). H is a lower excitation line than He I 5876 Å, which would explain why its blue-shifted absorption turns into blue-shifted emission as the wind expands, and why that of He I 5876 Å does not.
That the apparent deceleration of the wind may be due to dilution as it expands is supported by the simultaneous behavior of He I 5876 Å and H in nearly all events. The shapes of all these events in the trailed spectrum plots are roughly the same in both lines, but H switches to emission when He I stays in absorption.
Since the flow occurs on characteristic timescales and velocity scales, one may therefore estimate the length over which the wind accelerates. Assuming constant acceleration from rest perpendicular to a face-on disk, where in 6 – 8 min, or cm s and cm. This is comparable to estimated disk radii in luminous CVs (Sulkanen, Brasure, & Patterson 1981; Harrop-Allin & Warner 1996). At with a white dwarf radius it is also comparable to the size of the disk/wind transition region postulated by Knigge et al. (1997) and Knigge & Drew (1997).
Figures 1 and 3 show that the P Cygni events trace out sawtooth waves in time, suggesting the presence of shocks. Are we seeing shocks in a transition region, then? Instabilities in hot star winds were unexpected and are still poorly understood. Another source of the random variation of the P Cygni profiles may possibly be magnetism, long known to power the apparently random, rapid activity in stellar flares and prominences.
References
- Allen (1973) Allen, C. W. 1973, Astrophysical Quantities, Third Edition (London: Athlone Press), p. 266
- Balick et al. (1996) Balick, B., Rodgers, B., Hajian, A., Terzian, Y., & Bianchi, L. 1996, AJ, 111, 834
- Bessell (1991) Bessell, M. S. 1991, AJ, 101, 662
- Beuermann et al. (1992) Beuermann, K., Stasiewski, U., & Schwope, A. D. 1992, A&A, 256, 433
- Bond & Ciardullo (1989) Bond, H. E., & Ciardullo, R. 1989, in I.A.U. Colloquium 114, White Dwarfs, edited by G. Wegner (Berlin: Springer-Verlag), p. 473
- Bruch & Engel (1994) Bruch, A., & Engel, A. 1994, A&AS, 104, 79
- Ciardullo & Bond (1996) Ciardullo, R., & Bond, H. E. 1996, AJ, 111, 2332
- Córdova & Mason (1982) Córdova, F., & Mason, K. O. 1982, ApJ, 260, 716
- Córdova & Mason (1985) Córdova, F., & Mason, K. O. 1985, ApJ, 290, 671
- Cropper (1990) Cropper, M. 1990, Sp. Sci. Rev., 54, 195
- Crosa et al. (1996) Crosa, L., Szkody, P., Stokes, G., Swank, J., & Wallerstein, G. 1981, ApJ, 247, 984
- Drew (1987) Drew, J. E. 1987, MNRAS, 224, 595
- Drew (1997) Drew, J. E. 1997, in Accretion Phenomena and Associated Outflows, edited by D. T. Wickramasinghe, L. Ferrario, and G. V. Bicknell (San Francisco: A. S. P. Conf. Ser.), p. 465
- Ellis et al. (1984) Ellis, G. L., Grayson, E. T., & Bond, H. E. 1984, PASP, 96, 283
- Foster et al. (1996) Foster, K. W., et al. 1996, The Astronomical Almanac (Washington, DC: U. S. Naval Observatory), p. H42
- Bond & Ciardullo (1989) Garnavich, P., & Szkody, P. 1988, PASP, 100, 1522
- Griffith et al. (1995) Griffith, D., Fabian, D., & Sion, E. M. 1995, PASP, 107, 856
- Handler et al. (1997) Handler, G., Méndez, R. H., Medupe, R., Costero, R., Birch, P. V., Alvarez, M., Sullivan, D. J., Kurtz, D. W., Herrero, A., Guerrero, M. A., Ciardullo, R., & Breger, M. 1997, A&A, 320, 125
- Harrop-Allin & Warner (1994) Harrop-Allin, M. K., & Warner, B. 1996, MNRAS, 279, 219
- Hellier (1996) Hellier, C. 1996, ApJ, 471, 949
- Hollis et al. (1992) Hollis, J. M., Oliversen, R. J., Wagner, R. M., & Feibelman, W. A. 1992, ApJ, 393, 217
- Honeycutt et al. (1987) Honeycutt, R. K., Kaitchuck, R. H., & Schlegel, E. M. 1987, ApJS, 65, 451
- Horne & Marsh (1986) Horne, K., & Marsh, T. R. 1986, MNRAS, 218, 761
- Horne et al. (1986) Horne, K., Wade, R. A., & Szkody, P. 1986, MNRAS, 219, 791
- Knigge & Drew (1997) Knigge, C., & Drew, J. 1997, ApJ, 486, 445
- Knigge (1997) Knigge, C., Long, K. S., Blair, W. P., & Wade, R. A. 1997, ApJ, 476, 291
- Kraft (1964) Kraft, R. P. 1964, ApJ, 139, 457
- Krauter et al. (1987) Krautter, J., Klaas, U., & Radons, G. 1987, A&A, 181, 373
- Krauter et al. (1981) Krautter, J., Klare, G., Wolf, B., Duerbeck, H. W., Rahe, J., Vogt, N., & Wargau, W. 1981, A&A, 102, 337
- Livio (1994) Livio, M. 1994, in Interacting Binaries, edited by H. Nussbaumer and A. Orr (Berlin: Springer-Verlag), p. 135
- Livio (1997) Livio, M. 1997, in Accretion Phenomena and Associated Outflows, edited by D. T. Wickramasinghe, L. Ferrario, and G. V. Bicknell (San Francisco: A. S. P. Conf. Ser.), p. 845
- Mauche & Raymond (1987) Mauche, C. W., & Raymond, J. C. 1987, ApJ, 323, 690
- Méndez et al. (1981) Méndez, R. H., Herrero, A., & Manchado, A. 1990, A&A, 229, 152
- Moffat et al. (1988) Moffat, A. F. J., Drissen, L., Lamontagne, R., & Robert, C. 1988, ApJ, 334, 1038
- Montes & Martin (1997) Montes, D., & Martin, E. L. 1997, A&AS, in press (astro-ph/9709004)
- Mouchet et al. (1996) Mouchet, M., Siess, L., Drew, J., Lasota, J. P., Buckley, D. A. H., & Bonnet-Bidaud, J. M. 1996, A&A, 306, 212
- Paczynski & Schwarzenberg-Czerny (1980) Paczyński, B., & Schwarzenberg-Czerny, A. 1980, AcA, 30, 127
- Pajdosz & Zoła (1992) Pajdosz, G., & Zoła, S. 1992, in Evolutionary Processes in Interacting Binary Stars, edited by Y. Kondo, R. Sistero, and R. S. Polidan (Dordrecht: Kluwer), p. 441
- Patterson (1994) Patterson, J. 1984, ApJS, 54, 443
- Patterson (1994) Patterson, J. 1994, PASP, 106, 209
- Patterson et al. (1997) Patterson, J., Kemp, J., Saad, J., Skillman, D. R., Harvey, D., Fried, R., Thorstensen, J. R., & Ashley, R. 1997, PASP, 109, 468
- Patterson et al. (1996) Patterson, J., Patino, R., Thorstensen, J. R., Harvey, D., Skillman, D. R., & Ringwald, F. A. 1996, AJ, 111, 2422 (Paper I)
- Prinja et al. (1987) Prinja, R. K., Howarth, I. D., & Henrichs, H. F. 1987, ApJ, 317, 389
- Prinja & Rosen (1995) Prinja, R. K., & Rosen, S. 1995, MNRAS, 273, 461
- Ringwald et al. (1994) Ringwald, F. A., Thorstensen, J. R., & Hamwey, R. M. 1994, MNRAS, 271, 323
- Ritter & Kolb (1997) Ritter, H., & Kolb, U. 1997, A&AS, submitted
- Schneider & Young (1980) Schneider, D. P., & Young, P. J. 1980, ApJ, 238, 946
- Seaton (1979) Seaton, M. J. 1979, MNRAS, 187, 73p
- Shahbaz et al. (1997) Shahbaz, T., Livio, M., Southwell, K. A., & Charles, P. A. 1997, ApJ, 484, L59
- Smith et al. (1997) Smith, R. C., Sarna, M. J., Catalán, M. S., & Jones, D. H. P. 1997, MNRAS, 287, 271
- Sulkanen et al. (1981) Sulkanen, M. E., Brasure, L. W., & Patterson, J. 1981, ApJ, 244, 579
- Thorstensen et al. (1991) Thorstensen, J. R., Ringwald, F. A., Wade, R. A., Schmidt, G. D., & Norsworthy, J. E. 1991, AJ, 102, 272
- Thorstensen et al. (1993) Thorstensen, J. R., Thomas, G., & Patterson, J. 1993, preprint, made from a poster shown at the Interacting Binary Stars meeting, San Diego State University, July 13 – 15
- Tomov et al. (1992) Tomov, T., Zamanov, R., Kolev, D., Georgiev, L., Antov, A., Mikolajewski, M., & Esipov, V. 1992, MNRAS, 258, 23
- Unger et al. (1988) Unger, S. W., Brinks, E., Laing, R. A., Tritton, K. P., & Gray, P. M. 1988, Observer’s Guide, Version 2.0 (La Palma: Isaac Newton Group), p. 91
- Verbunt (1987) Verbunt, F. 1987, A&AS, 71, 339
- Warner (1987) Warner, B. 1987, MNRAS, 227, 23
- Warner (1995a) Warner, B. 1995a, in Cape Workshop on Magnetic Cataclysmic Variables, edited by D. A. H. Buckley and B. Warner (San Francisco: A. S. P. Conf. Series v. 85), p. 3
- Warner (1995b) Warner, B. 1995b, Cataclysmic Variable Stars (Cambridge Univ. Press, Cambridge)
- Williams (1983) Williams, G. 1983, ApJS, 53, 523
- Wolf (1992) Wolf, B.. 1992, in Nonisotropic and Variable Outflows from Stars, edited by L. Drissen, C. Leitherer, and A. Nota (San Francisco: A. S. P. Conf. Ser., vol. 22), p. 327
- Woods et al. (1997) Woods, J. A., Drew, J. E., & Verbunt, F. 1990, MNRAS, 245, 323


|
||||||||||||||||||||||||||||||||||||||||||||||||||||||||||||||||||||||||||||||||||||||||||||||||||||||||||||||||||||||||||||||||||||||||||||||||||||||||||||||||||||||||||||||||||||||||||||||||||||||||||||||||||||||||||||||||||||||||||||||||||||||||||||||||||||||||||||||||||||||||||||||||||||||||||||||||||||||||||||||||||||||||||||||||||||||||||||||||||||||||||||||||||||||||||||||||||||||||||||||||||||||||||||||||||||||||||||||||||||||||||||||||||||||||||||||||
|
|||||||||||||||||||||||||||||||||||||||||||||||||||||||||||||||||||||||||||||||||||||||||||||||||||||||||||