Emission Lines from Companion Galaxies of QSOs
Abstract
Anticipating new spectroscopic studies of quasar companions, we calculate expected emission line spectra for the companion galaxies. Under the assumption of isotropic photoionizing radiation, we predict equivalent widths for H, H, [O iii] 5007, [O ii] 3727, [Ne iii] 3869, and Mg ii 2798 lines. We consider 6 quasars, two of which (PKS 2135-14 and PKS 2349-014) have very close companions with projected separation kpc. For these companions the calculated emission lines should be easily observable, with for the [O iii], [O ii], and H lines. Presence of strong emission lines from the companions occupying only a tiny solid angle would suggest that 1) quasar radiation is isotropic; 2) companion galaxies have measurable amount of gas, which can be assessed using the photoionization models; 3) host galaxies, if present, have been depleted of gas or do not interact with the companions.
keywords:
quasars: emission lines — quasars: general — quasars: individual (PKS 2135-14, PKS 2349-014, PHL 909, NAB 0205+02, HE 1029-1401, PKS 0405-123)1 Introduction
There is increasing observational evidence that quasar activity is associated with compact groups of galaxies (Bahcall & Chokshi (1991); Yee & Ellingson (1993), and references therein). Recent HST observations (Bahcall, Kirhakos, & Schneider 1995a ,b, 1996; Bahcall et al. (1997), hereafter BKSS) of nearby luminous (; ) quasars revealed extremely close companion galaxies, within 2″ from the QSOs ( 4 kpc in projection). Table 1 summarizes the known parameters for the companions of six nearby quasars. The first three columns give quasar’s name, its redshift and absolute magnitude. The other columns describe the quasar companions, including their redshifts, magnitudes, and projected separations from the quasar, , both in arcseconds and kiloparsecs. The last column is the covering factor , discussed in §2.
The physical conditions in the interstellar medium of the companions are different from the Galaxy. Powerful ultraviolet radiation from the QSO, if isotropic, is able to ionize a large fraction of the gas. For a distant observer, the companion galaxies would look like giant HII regions. Therefore, spectroscopic observations of the companion galaxies of quasars directly test anisotropy of the quasar ionizing radiation suggested by the implied AGN model (cf. for example Antonucci (1993)). The results of such observations may be important in understanding the quasar environment.
Stockton & MacKenty (1987) observed extended line emission around a sample of quasars in their narrow-band [O iii] 5007 survey. In many cases, the emission regions are not confined to the nearest detected companion and instead show asymmetric structures, such as bridges and tidal tails. The Stockton-MacKenty results suggest that at least in some cases companion galaxies are experiencing violent interactions with the QSOs and that their gas may have been removed by interstellar shocks. However, very little observational evidence exists on the emission-line spectra of the close companions. Our work is intended to motivate future observations by showing that gas content and metallicity can be assessed by obtaining spectra of the companions. We calculate the emission line spectrum expected from a single gas cloud with various galactic parameters, which is illuminated by the hard UV radiation from a central QSO source. Comparing our models with the results of narrow band imaging or high-resolution spectroscopy yields estimates of the gas density and its distribution.
We outline in §2 the calculations and the method that can be used to study the ISM in the companion galaxies. Next, we discuss in §3 the results for individual companions. Finally, in §4, we speculate on what can be learned about quasars and their environment from the study of emission lines of the companion galaxies.
2 Computing the emission lines
We use the photoionization program CLOUDY , version 84.12 (Ferland (1993)) to calculate the emission line spectrum of a cloud of gas exposed under the quasar radiation. The density of the gas, , is assumed constant throughout the cloud. The shape of the incident QSO’s spectrum is from Mathews & Ferland (1987) and is normalized to the total quasar luminosity, . The underlying continuum of the companion is assumed to be the standard spectrum of a Sbc galaxy, as reported by Coleman, Wu, & Weedman (1980), normalized to . We explore five orders of magnitude in the gas density (values characteristic of a normal galaxy), and four orders of magnitude in the ionizing flux. The equivalent widths of the emission lines are evaluated relative to the outgoing continuum of the companion galaxy that includes the component of the incident radiation absorbed and re-radiated by the gas. For a similar exploration of clouds within, not outside, the AGN see Baldwin et al. (1995).
The gas in the cloud will be partially (or fully) ionized by the quasar radiation and will resemble a giant HII region. The principle differences from galactic HII regions are the geometry of the cloud and the shape of the ionizing continuum. The companion galaxy usually occupies a small solid angle as seen from the quasar, and therefore only a fraction of the ionizing flux will hit the inner surface of the cloud. This fraction is characterized by the covering factor
| (1) |
where is the solid angle subtended by the cloud, is the surface of the cloud closest to the quasar, and is the distance to the quasar.
Unlike a galactic HII region, the ionization region around the quasar does not have a definite boundary because of the power-law spectrum of the ionizing radiation (Bahcall, Bahcall, & Kozlovsky (1971); Halpern & Steiner (1983)). The electron density declines smoothly with radius and it is not possible to separate completely the ionized and neutral zones. Nevertheless, it is instructive to introduce a parameter analogous to the Strömgren radius of the HII region. Since CLOUDY imposes spherical geometry on the cloud, the ionized region is a spherical shell with surface area and mean radial width .
| (2) |
where cm3 s-1 is the hydrogen recombination coefficient, and and are the electron and proton densities, respectively. A filling factor, , accounts for the non-uniform distribution of the gas in the cloud. is the total rate of ionizing photons from the quasar. For the chosen shape of the quasar continuum, The “Strömgren width”, , provides a useful estimate of the effective volume occupied by the ionized gas that determines the line emission strength from the cloud.
Table 2 gives the values of for our sample. Only two close companions have ionization zones comparable to their size, and in the rest of the galaxies the Strömgren zone is ionization limited (its size ). The actual widths of the companions (column 4), as well as their covering factors , were estimated from the HST images.
In the CLOUDY calculations we use solar abundances of elements. Our choice is supported by the recent result that the abundances of the heavy elements considered here (O, N, Ne, and Mg) differ by less than 50% in the solar neighborhood (Edvardsson et al. (1993)), and by the current models of chemical evolution of galaxies (for example, Pagel (1989)) that predict slow evolution of metallicity over the last Gyr. External galaxies, however, show a spread of metallicities. While including abundances as free parameters would significantly complicate our models, it is still necessary to investigate the extent to which varying metallicity of the gas may change the predicted spectrum. Interstellar dust can also modify the thermal balance in the clouds (Shields & Kennicutt (1995)). We have conducted test calculations including the depletion of certain elements onto dust grains (as described in Baldwin et al. (1991)) and varying metallicity parameter in a wide range of .
At very low metallicity (), the forbidden line emission (for example, [O iii]) increases as rises, while the hydrogen Balmer line intensity is essentially constant. Increasing metal abundance leads to more efficient cooling and correspondingly lower electron temperature. At about solar metallicity the temperature effect starts to dominate and both [O iii] and H decline even as increases (McCall, Rybski, & Shields (1985)). Including dust grains in the calculations gives rise to the opposite phenomenon. The main effect of the grains is depletion of metals from the interstellar medium (Shields & Kennicutt (1995)). This reduces cooling efficiency of the gas and leads to higher temperature than in the dust-free case. Therefore the variation of the predicted emission lines with is reduced.
The test calculations have been performed for all quasar companions considered in §3. In the range , the intensity of the [O iii] line varied by an average of 45% for the two close companions and by 53% for the other companions with lower ionization level. In the range for the close companions, [O iii] was reduced by about 90% compared to its value at . The [O iii]/H line ratio changes more slowly than the [O iii] intensity at high metallicity because of similar drop in H. In all calculations involving the two close companions the average electron temperature was in the range K, and for the low-ionization companions K. From these tests we conclude that choosing solar abundances maximizes the forbidden line emission from the quasar companions.
2.1 Distribution and density of gas in the close companions
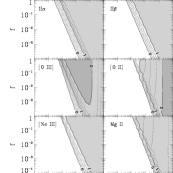
When companions are very compact or very close to the quasar, such that , essentially all gas is ionized and the intensity of the emission lines is directly proportional to the effective volume occupied by the gas, . The unknown parameters are the gas density and the filling factor . We have computed a two-dimensional set of ionization models, varying from to cm-3, and from 1 to .
Figure 1 shows the contours of the equivalent widths for the H, H, [O iii] 5007, [O ii] 3727, [Ne iii] 3869, and Mg ii 2798 lines, corresponding to the rest frame of the cloud. The [O iii] line illustrates the transition from the matter-bounded to ionization-bounded models. On the left side of the plot and the contours of coincide with the lines of constant Strömgren radius (). From the simple three-level model of an oxygen atom we can predict . For large densities, drops below and the line intensity becomes essentially independent of the amount of gas, . Also as density increases, the ionization level of oxygen decreases and the [O ii] line becomes stronger.
In the H, H, and [Ne iii] panels there is a plateau on the high-density side where the equivalent widths are essentially constant. Here all of the ultraviolet photons are trapped inside the cloud, and the ionization zone is limited by the quasar intensity. For example, (H) cannot rise much more than 30 Å for any combination of the gas density and the filling factor.
Note that [O iii] line is also present if [O iii] 5007 is observed. We do not include this line because of the approximate relation for K (Osterbrock (1989)). If the two lines are not resolved, the equivalent width of the [O iii] 5007 line should be corrected accordingly.
The intersection of the isocontours of all the observed gives the point on the diagram that corresponds to the ionization model best reproducing the observations. Besides an estimate of , we obtain also the full emission-line spectrum of the object (within the simple, constant density model). Therefore we predict the intensity and equivalent widths for other strong lines, and these in turn can be tested by future observations. Given good data from several lines (including upper limits), it seems possible to construct a model with a realistic gas distribution covering a range of densities .
2.2 Density of gas in the ionization-bounded companions
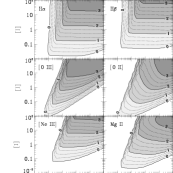
If the companions are sufficiently far from the quasar, the strength of the emission lines is limited by the number of ionizations. At high enough density, the effective volume of the ionized region is and the equivalent widths of the hydrogen lines are proportional to a single ionization parameter
| (3) |
This parameter is, in principle, directly observable. Values of for the companion galaxies in our sample are given in the last column of Table 2. It could be related to the usual ionization parameter : . The two parameters are similar in value but has the advantage of being independent of the gas density. This allows us to separate the intensity of the incident flux from the parameters intrinsic to the companion.
Figure 2 shows the results of our calculations for the same emission lines, now as function of and . The two hydrogen lines, H and H, demonstrate the simple variation of the equivalent widths. When the density is large, almost independently of . On the other hand, for cm-3 the ionization is complete and . The corners of the contours lie on a single line (i.e. ). Note that both permitted and forbidden lines show a general break along that line.
Behavior of the oxygen lines can be understood using the three-level model of the oxygen atom. The dominant excitation mechanism is collisions with electrons unless the radiation field is so strong that recombination to excited levels becomes important. For the [O iii] line, collisional excitation prevails if , which is always satisfied in our models. We have also checked that the quasar radiation is strong enough that photoionization of neutral oxygen atoms wins over the charge exchange with protons (see Spitzer (1978)) if cm-3.
For low densities ionization is so high that the ion abundances of the heavy elements are controlled by recombination from the next ionization state. As a result, all equivalent widths follow the approximate relation . In the limit of a weak radiation field (or high density), the ion concentrations scale differently and so do the equivalent widths of the lines. The ionization zone is limited by , and , .
Figure 2 allows us to find the best ionization model describing a set of the observed emission lines. The ionization parameter of the cloud could be determined directly from the observations (see eq. [3]). Ideally the contours of the equivalent widths should all intersect in one point with the horizontal line of the known , and even one measured line would suffice to obtain the value of the gas density. However given the uncertainty of measurements, it is desirable to have several lines in order to better constrain the estimate of .
How does the observational uncertainty in propagate to the inferred values of ? We have considered a range of values of and obtained the corresponding range of allowed densities. Our tests show that the relative error in is of the same order as that in , with for a wide region on the diagram. Therefore, observational errors are not strongly enhanced in the estimate of the gas density.
3 Discussion of individual galaxy companions
In this section, we apply the results of our calculations to the individual companions listed in Table 1. In calculation of luminosities of quasars and their companions we use a solar V magnitude of (Worthey (1994)) and the Hubble constant km s-1 Mpc-1. Note that choice of does not affect the predicted equivalent widths because the ionizing fluxes from the quasars are invariant to distance scaling.
To account for the third spatial dimension, we correct the projected separations of the companions from the quasars by a factor of . These larger values are used in calculation of the ionization models. The second column of Table 2 gives the corrected separations for all of the companions.
3.1 Close companions
3.1.1 PKS 2135-14
Stockton (1982) presented a spectrum and a detailed discussion of the closest companion to PKS 2135-14. Its compact nature is best revealed on the HST image (BKSS), where the companion is unambiguously distinguished from the nebulosity surrounding the quasar. Based on the spectrum of the companion, Canalizo & Stockton (1997) showed that it is actually a foreground star. Therefore, the narrow line emission is produced by the gas in the fuzzy nebulosity extending over more than kpc. Our ionization models describe the state of this extended gas.
We read the equivalent widths of the [O iii], [O ii], and H lines by visual inspection of the spectrum in Stockton (1982). Table 4 shows our estimates of ; uncertainty in the values should be taken to be at least 20%. We construct the best fitting photoionization model using the calculations described in §2.1. Figure 3 shows contours of for the three measured lines. One striking feature of the plot is that all three contours run reasonably close along the line corresponding to the constant Strömgren radius (). Therefore any model along the line is, in principle, capable of reproducing the observed emission. However, the isocontours never cross in one point, suggesting that more than one constant density model is required for the adequate fit of observations, provided the estimated equivalent widths are correct.
We considered a simple combination of high and low density clouds (see Table 4). The high density clouds are needed to reproduce the [O ii] emission, since most of the oxygen is doubly ionized at small densities ( cm-3) at the apparently small observed separation from the quasar. The low density clouds are likely to be present in the large extended nebulosity. We stress that the choice of high and low density clouds is not uniquely set by the available data.
The two models together produce the right amount of the [O ii] emission, 23% less of the [O iii], and 50% more of the H than is estimated from the observed spectrum. The H line should be conspicuous, with , but it lies outside the spectral range of Stockton’s data. The [Ne v] 3426 line becomes moderately strong if we take any lower density for the model . However it is barely detectable in the spectrum, and the estimated upper limit on its equivalent width is about 3 Å. Thus the gas density of the model is limited to cm-3. On the other hand, a larger filling factor () leads to a significant overestimate of the H line while still not producing enough of the [O iii].
Another companion is located 6″ to the East from PKS 2135-14. Canalizo & Stockton (1997) confirmed that it is a galaxy at the redshift of the quasar, however its spectrum does not show strong emission lines.
3.1.2 PKS 2349-014
The closest companion of PKS 2349-014 exhibits a tidal interaction with the host QSO (see Bahcall et al. 1995a). Its redshift has been confirmed by Miller, Tran & Sheinis (1996). The estimated three-dimensional distance from the quasar is 4.2 kpc. There are also apparent tidal tails and a large nebulosity surrounding, but offset from, the quasar. If the quasar has a host galaxy similar to the Milky Way, the companion would inspiral due to dynamical friction in yr.
We have computed two illustrative models with plausible gas densities of cm-3 and 4 cm-3, respectively. We expect that the highly ionized, and therefore heated, gas would tend to be evenly distributed over the volume of the companion. Because of the faint continuum of the companion, the predicted equivalent widths in the second model are very large (see Table 4). For example, . Spectroscopic observations of the companion galaxy are necessary to constrain the ionization model and to estimate the present amount of gas.
Because of the extreme proximity of the companion, radiation pressure from the quasar may affect the distribution of the gas. We use CLOUDY calculations to estimate the radiative acceleration on a hydrogen atom in the companion. We assume an isothermal distribution of mass of the companion and adopt the mass-to-light ratio of characteristic of moderately young stellar population. We find that for the models I and II, gravity of the companion dominates the radiation pressure out to 18 kpc and 8 kpc, respectively, much farther than the actual extent of this object. Therefore, the gas clouds are not driven out of the companion. We have checked that the momentum transfer due to absorption of ionizing radiation by hydrogen atoms (for example, Haehnelt (1995)) is at least an order of magnitude weaker than the force due to resonant Ly scattering.
3.2 Ionization-bounded companions
3.2.1 NAB 0205+02
NAB 0205+02 from the survey by Bahcall, Bahcall, & Schmidt (1973) has a mysterious companion at a projected separation of 22 kpc; this companion is very compact but is bright in the [O iii] line. Stockton & MacKenty (1987) estimated the equivalent width of [O iii] line of at least 400 from the narrow line image. On the other hand, the object was not detected at all on their line-free continuum image. Recent HST F606W broad band observation of the companion (BKSS), which includes the [O iii] line, shows that the image consists of two tiny clumps connected to each other by a bridge. There is no evidence on the HST image that the quasar host extends all the way to the companion, suggesting that the gas in the object is not affected by direct interaction with the host. The line emission in the companion may, in principle, be caused by photoionization or collisional excitation by sources internal to the companion. We assume here that it is not the case and discuss instead the situation when photoionization by the quasar is the dominant source of energy for the emission lines.
The Strömgren radius for the companion (see Table 2) is less than the apparent extent of the object ( 3.5 kpc in NS direction, and 0.5 kpc in SW direction), so that the gas will be only partially ionized for cm-3. The amount of [O iii] emission is therefore determined by the ionization parameter , which in turn depends on the covering factor. Assuming that the size of the object along the line-of-sight is the same as in the NS direction, we get an upper limit on of , or . Using the estimated three-dimensional separation from the quasar of 26.5 kpc, we found that no simple ionization model, with the ionizing source centered on the quasar, yields an equivalent width of the [O iii] line as large as is observed. The smallest covering factor needed to produce is , and the gas density in this case is 0.3 cm-3.
Can the emitting gas be distributed more broadly than the HST image shows? Apparently, the narrow-line image of Stockton & MacKenty (1987; their Figure 2e) is large but this could be the effect of lower resolution relative to HST . Nonetheless, we present the ionization model with that best fits the observations. If the model is confirmed by new spectroscopic data, a better understanding of the distribution of gas and stars in the companion will be required. If not, a much more elaborate ionization model will be needed to describe this unusual object.
The one-cloud ionization model predicts large equivalent widths for virtually all of the emission lines listed in Table 4. The [O ii], H, H, [Ne iii], and Mg ii lines have calculated in excess of 40 Å. Also included in Table 4 are strong [N ii] and H lines. Our simplest model gives an upper limit (for ) on the total mass of the gas in the companion of .
The faint continuum of the companion suggests the possibility that most of the light might be produced by thermal bremsstrahlung rather than starlight. The bremsstrahlung luminosity of the companion would be (Osterbrock (1989))
| (4) |
where is the free-free Gaunt factor, is the density of ions of charge , and kpc3 (for ) is the volume of the gas. The observed companion luminosity is (BKSS), and therefore one needs a density of cm-3 to produce the right amount of emission. This in turn requires a larger covering factor of in order to match the observed ([O iii]) with the gas density larger than 3 cm-3. As noted before, the covering factor can hardly be larger than . Also, self-gravity of the gas will not be strong enough to resist the radiation pressure force, as indicated by the CLOUDY calculations. Therefore the continuum of the companion cannot be accounted for by thermal bremsstrahlung only. Most likely, the detected emission arises from a combination of emission lines and faint starlight.
3.2.2 PHL 909
Galaxy F in the Bahcall, Kirhakos, & Schneider (1996) list of objects around PHL 909 is 65 kpc away from the quasar. Boroson (1996) has estimated the equivalent widths of the [O ii] and [O iii] lines as 10 Å and 2 Å, respectively.
Figure 4 shows the corresponding contours of the lines as function of and , using the calculations from §2.2. The intersection of the two lines gives a slightly larger covering factor than is estimated from the HST image, so that we had to lower the gas density in order to produce the observed . The best ionization model is obtained with cm-3 for . Because of the large distance to the quasar, the ionization flux is not very powerful and there are no strong lines predicted. Besides the oxygen lines, there could be detectable H and [N ii] 6584 lines both with .
3.2.3 HE 1029-1401
Wisotzki (1994) showed that the quasar HE 1029-1401 is surrounded by a loose group of galaxies with strong emission lines. Table 4 gives the equivalent widths for the [O iii], [O ii], and H lines for the closest galaxy with a redshift similar to the quasar. The companion is at deprojected distance of about 150 kpc, and the covering factor is small (). Even with and cm-3, photoionization by the quasar is too weak by an order of magnitude to produce the measured lines (Table 4).
The observed emission can be explained by star formation within the companion galaxy. The continuum level at H () is related to the total luminosity using the standard spectrum of an Sbc galaxy from Coleman et al. (1980); we find . The observed equivalent width of the H line gives then the intensity of the line, erg s-1. Using Kennicutt’s (1983) relation for the star formation rate (SFR) of spiral galaxies to the luminosity of the H line and assuming , we find SFR , which can be achieved by a normal size spiral galaxy.
3.2.4 PKS 0405-123
The companion galaxy to PKS 0405-123 has been observed by Marr & Spinrad (1985), and its redshift has been confirmed by Ellingson & Yee (1994). The spectrum of the galaxy has a strong [O ii] emission line, with the estimated equivalent width of . The luminosity of the companion () suggests that it may be a large spiral galaxy. There is no HST observation of this quasar field and the available image from Marr & Spinrad (1985) does not permit robust determination of the covering factor of the companion. We estimate the size of the galaxy to be 10 kpc, and assume it is almost face-on towards the quasar. This gives . Using Figure 2, we estimate the gas density to be about 8 cm-3. The ionization model predicts some measurable emission in H, Mg ii and [N ii], with . If the companion is inclined with respect to the quasar, will be smaller and the ionizing flux from the quasar will not be strong enough to produce the observed [O ii] emission.
4 Summary
The primary goal of this paper is to encourage new spectroscopic observations of quasar companions in order to learn more about the companion galaxies, isotropy of the quasar emission, and the relation between the galaxies and the quasars. We have calculated the equivalent widths of the strongest emission lines expected to be produced by quasar photoionization of close galactic companions and applied our models to the six companions with the observed lines.
In our exploratory calculations we have assumed constant density gas clouds and solar abundancies of the elements. Choice of the solar metallicity maximizes the forbidden line emission. For the close companions of PKS 2135-14 and PKS 2349-014, the predicted equivalent widths are very strong, . Our results suggest (see Figures 1 and 2, and Tables 4 and 4) that a narrow range of gas densities of around 1 cm-3 may produce the observed emission lines. In three cases (the two close companions mentioned above and the exotic companion of NAB 0205+02) the models constrain the amount of gas to be of order .
Determining the amount of gas in or around the close companions is important for understanding the dynamical interactions of quasars with their environment. HST images (e.g., Bahcall et al. 1995a and BKSS) show clearly that, at least in some cases, quasars are interacting violently with their galactic companions. The long tidal tail observed near PKS 2349-014 suggests the presence of a massive host galaxy. The small quasar-companion separation of kpc indicates that the companion is well inside the typical scale of a large galaxy. Gas shocks in the interstellar medium of the host might be expected to remove all of the gas from the small companion. Since the radiation pressure of the quasar is not strong enough to push away all the gas of the companion, absence of the strong emission lines predicted by our isotropic photo-ionization models could suggest an anisotropic ionizing flux or shock interactions with the massive host.111 An alternative explanation for the lack of line emission in the companions (proposed by J. Goodman) could be a very short lifetime of the quasar. If the central engine is powered by the disrupted material of a single star and lasts for only several years, the ionizing radiation from the quasar may have not yet reached the companions some 10,000 light years away. On the other hand, if strong photoionized emission lines are observed, a possible explanation might be an almost “naked” central quasar, which accretes gas from disrupted dwarf companions. This possibility has been suggested recently by Bahcall et al. (1995a) and by Fukugita & Turner (1996).
The degree of anisotropy of the quasar ionizing radiation, which is important for understanding the unified AGN model (e.g. Antonucci (1993)), can be tested directly. If the continuum emission from the quasar is concentrated in narrow beams, the small solid angle of the companion galaxies makes them unlikely to be ionized. The companion of NAB 0205+02 presents a particularly strong test. Its tiny covering factor () guarantees that the companion will not be ionized unless the quasar radiation is isotropic. Spectroscopy of that object can determine if the line emission is consistent with photoionization by the quasar.
The gas in the host galaxy itself should be strongly ionized by the quasar and all of the emission lines considered in this paper are expected to be observable. For the simplest model of a disk galaxy with the constant gas density, the effective radius of the ionization zone is kpc, where . As noted by Begelman (1985) and Chang, Schiano, & Wolfe (1987), total depletion of gas and dust occurs in the inner few kiloparsecs. Thermal expansion of the gas in the direction perpendicular to the galactic plane leads to an amorphous envelope of hot gas around the quasar extending up to several tens of kpc. Stockton & MacKenty (1987) found such large emission envelopes to be ubiquitous around quasars. Therefore the period of quasar activity should be longer than the timescale for thermal expansion and subsequent cooling of the gas, or years.
Close companions to three other quasars, PKS 1302-102, 3C 323.1 (=Q1545+210) and PG 1202+281, have been detected with HST (Bahcall, Kirhakos, & Schneider 1995b ) but no spectra are currently available. Stockton & MacKenty (1987) found an extremely strong [O iii] emission around Q1545+210, but they could not unambiguously associate the emission with the companion 7 kpc away from the quasar. We would like to attract reader’s attention to the 6 companions discussed in this paper and the other 3 objects mentioned above. They present a new interesting opportunity to understand quasars.
Acknowledgements.
This project would not be possible without support and encouragement from Professor John Bahcall. We gratefully acknowledge use of the Gary Ferland’s program CLOUDY . Don Schneider provided a computer readable version of the spectrum of Sbc galaxy from Coleman et al. (1980). T. Boroson generously measured, and allowed us to use here, the equivalent widths of the [O ii] and [O iii] emission lines on his spectrum of galaxy F in the field of PHL 909. We thank J. Bahcall, B. Draine, G. Ferland, J. Goodman, J. Ostriker, M. Rees, and L. Spitzer for helpful discussions. This project was supported in part by NSF grant AST-9424416.| Quasar | Companion | ||||||
|---|---|---|---|---|---|---|---|
| (″) | ( kpc) | bbCovering factor of the companions, estimated from their HST images. | |||||
| PKS 2135-14 | 0.200 | -23.5 | 0.200 (?) | -19.4 | 2.0 | 4.2 | |
| PKS 2349-014 | 0.173 | -23.4 | 0.173 | -17.7 | 1.8 | 3.4 | |
| NAB 0205+02 | 0.155 | -23.0 | 0.155 | -15.4 | 12.0 | 21.6 | |
| PHL 909 | 0.171 | -22.9 | 0.169 | -20.1 | 28.2 | 53 | |
| HE 1029-1401 | 0.086 | -23.2 | 0.086 | -18.5 | 112 | 120 | |
| PKS 0405-123 | 0.574 | -24.3 | 0.570 | -20.2 | 13 | 49 | |
| ( kpc)aaSeparation from the quasar corrected for the projection effect; . | (kpc)bbFor cm-3, . The Strömgren radius scales as (see eq.[2]). | ( kpc) | ||
|---|---|---|---|---|
| PKS 2135-14 | 5.1 | 1.5 | 3 | 0.9 |
| PKS 2349-014 | 4.2 | 2.3 | 1 | 1.3 |
| NAB 0205+02 | 26.5 | 0.5 | 1 | |
| PHL 909 | 65 | 9 | 0.07 | |
| HE 1029-1401 | 147 | 6 | 0.05 | |
| PKS 0405-123 | 60 | 10 | 0.1 |
| PKS 2135-14 | PKS 2349-014 | |||||
|---|---|---|---|---|---|---|
| Model | Model | |||||
| (Å) | [1] | (low-density) | (high-density) | total | Model I | Model II |
| [O iii] 5007 | 69 | 9.8 | 43.3 | 53 | 53 | 247 |
| H | 5 | 2.0 | 5.6 | 8 | 8 | 24 |
| [O ii] 3727 | 8 | 7.9 | 8 | 19 | ||
| H | 6.3 | 17.4 | 24 | 26 | 73 | |
| Mg ii 2798 | 3.4 | 3 | 25 | |||
| [Ne iii] 3869 | 3.8 | 4 | 4 | 22 | ||
| [Ne v] 3426 | 2.3 | 2 | 25 | 6 | ||
| Parameters of ionization models | ||||||
| (cm-3) | 3 | 45 | 1 | 4 | ||
| 1 | 1 | |||||
| () | ||||||
References. — [1] Stockton (1982).
| NAB 0205 | PHL 909 | HE 1029 | PKS 0405 | |||||
|---|---|---|---|---|---|---|---|---|
| (Å) | [1] | Model | [2] | Model | [3] | Model | [4] | Model |
| [O iii] 5007 | 415 | 2 | 2 | 39 | ||||
| [O ii] 3727 | 118 | 10 | 9 | 52 | 6 | 12 | 12 | |
| H | 48 | 1 | 13 | 1.5 | 2 | |||
| H | 147 | 4 | 5 | 6 | ||||
| Mg ii 2798 | 94 | 3 | 3 | 5 | ||||
| [Ne iii] 3869 | 42 | |||||||
| [N ii] 6584 | 32 | 4 | 4 | 6 | ||||
| H | 27 | 1 | ||||||
| Parameters of ionization models | ||||||||
| (cm-3) | 0.3 | 0.83 | 1 | 7.5 | ||||
| () | ||||||||
References
- Antonucci (1993) Antonucci, R. 1993, ARA&A, 31, 473
- Bahcall, Bahcall, & Kozlovsky (1971) Bahcall, J. N., Bahcall, N. A., & Kozlovsky, B. 1971, A&A, 13, 1
- (3) Bahcall, J. N., Kirhakos, S., & Schneider, D. P. 1995a, ApJ, 447, L1
- (4) Bahcall, J. N., Kirhakos, S., & Schneider, D. P. 1995b, ApJ, 450, 486
- Bahcall, Kirhakos, & Schneider (1996) Bahcall, J. N., Kirhakos, S., & Schneider, D. P. 1996, ApJ, 457, 557
- Bahcall et al. (1997) Bahcall, J. N., Kirhakos, S., Sahe, D. H., & Schneider, D. P. 1997, ApJ, 479, 642
- Bahcall, Bahcall, & Schmidt (1973) Bahcall, N. A., Bahcall, J. N., & Schmidt, M. 1973, ApJ, 183, 777
- Bahcall & Chokshi (1991) Bahcall, N. A., & Chokshi, A. 1991, ApJ, 380, L9
- Baldwin et al. (1991) Baldwin, J., Ferland, G. J., Martin, P. G., Corbin, M., Cota, S., Peterson, B. M., & Slettebak, A. 1991, ApJ, 374, 580
- Baldwin et al. (1995) Baldwin, J., Ferland, G., Korista, K., & Verner, D. 1995, ApJ, 455, L119
- Begelman (1985) Begelman, M. C. 1985, ApJ, 297, 492
- Boroson (1996) Boroson, T. A. 1996, private communication
- Canalizo & Stockton (1997) Canalizo, G., & Stockton, A. 1997, ApJ, 480, L5
- Chang, Schiano, & Wolfe (1987) Chang, C. A., Schiano, A. V. R., & Wolfe, A. M. 1987, ApJ, 322, 180
- Coleman, Wu, & Weedman (1980) Coleman, G. D., Wu, C.-C., & Weedman, D. W. 1980, ApJS, 43, 393
- Edvardsson et al. (1993) Edvardsson, B., Andersen, J., Gustafsson, B., Lambert, D. L., Nissen, P. E., & Tomkin, J. 1993, A&A, 275, 101
- Ellingson & Yee (1994) Ellingson, E., & Yee, H. K. C. 1994, ApJS, 92, 33
- Ferland (1993) Ferland, G. J. 1993, Hazy, a Brief Introduction to Cloudy (Univ. Kentucky Phys. Dept. Internal Report)
- Fukugita & Turner (1996) Fukugita, M., & Turner, E. L. 1996, ApJ, 460, L81
- Haehnelt (1995) Haehnelt, M. G. 1995, MNRAS, 273, 249
- Halpern & Steiner (1983) Halpern, J. P., & Steiner, J. E. 1983, ApJ, 269, L37
- Kennicutt’s (1983) Kennicutt, R. C. 1983, ApJ, 272, 54
- Marr & Spinrad (1985) Marr, J., & Spinrad, H. 1985, PASP, 97, 684
- Mathews & Ferland (1987) Mathews, W. G., & Ferland, G. J. 1987, ApJ, 323, 456
- McCall, Rybski, & Shields (1985) McCall, M. L., Rybski, P. M., & Shields, G. A. 1985, ApJS, 57, 1
- Miller, Tran & Sheinis (1996) Miller, J., Tran, H., & Sheinis, A. 1996, BAAS, 28, 20.04
- Osterbrock (1989) Osterbrock, D. E. 1989, Astrophysics of Gaseous Nebulae and Active Galactic Nuclei (Mill Valley: University Science Books)
- Pagel (1989) Pagel, B. E. J. 1989, Rev. Mexicana Astron. Astrof., 18, 161
- Shields & Kennicutt (1995) Shields, J. C., & Kennicutt, R. C. 1995, ApJ, 454, 807
- Spitzer (1978) Spitzer, L. Jr. 1978, Physical Processes in the Interstellar Medium (New York: John Wiley & Sons)
- Stockton (1978) Stockton, A. 1978, ApJ, 223, 747
- Stockton (1982) Stockton, A. 1982, ApJ, 257, 33
- Stockton & MacKenty (1987) Stockton, A., & MacKenty, J. W. 1987, ApJ, 316, 584
- Wisotzki (1994) Wisotzki, L. 1994, A&A, 292, 45
- Worthey (1994) Worthey, G. 1994, ApJS, 95, 107
- Yee & Ellingson (1993) Yee, H. K. C., & Ellingson, E. 1993, ApJ, 411, 43