Kinematics of the Hercules Supercluster
Abstract
The Hercules Supercluster consists of the Abell clusters 2147, 2151, and 2152. Previous studies of the kinematics have been confounded by the difficulty of correctly assigning galaxies to the individual clusters, which are not well-separated. Our study has a total of 468 available velocities for galaxies in the region, 175 of them new. 414 galaxies are in the supercluster, about three times the number used in the previous supercluster study. We verify the existence of the three individual clusters and compute their individual dynamical parameters. We investigate several techniques for assigning galaxy membership to clusters in this crowded field. We use the KMM mixture-modeling algorithm to separate the galaxies into clusters; we find that A2152 has a higher mean velocity than previous studies have reported. A2147 and A2152 also have lower velocity dispersions: 821 and 715 km s-1. The assignment of galaxies to either A2152 or A2147 requires velocity and position information. We study the kinematics of the supercluster using the two-body formalism of Beers, Geller, and Huchra (1982) and conclude that A2147 and A2151 are probably bound to each other, and that the supercluster as a whole may also be bound. The mass of the supercluster, if bound, is ; with the supercluster luminosity, , this yields .
1 Introduction
Ostriker, Peebles, & Yahil (1974) were among the first to suggest that the mass-to-light ratios of spiral galaxies increase with increasing scale. They noted that this trend appeared to continue to larger scales, indicating that galaxies might provide the critical mass density for the universe. Bahcall (1997) has suggested that the evidence now shows that of galaxies increases only up to a scale of 0.1-0.2 Mpc and then levels off, remaining roughly constant for groups and clusters of galaxies up to a scale of 1.5 Mpc. It is important to know whether this holds on much larger scales, e. g. superclusters. If so, it might imply that there is no additional dark matter on supercluster scales (of Mpc). Since the constant value of implies a value for of roughly 0.2, this would imply that an universe would have to have most of the matter outside groups, clusters, and superclusters. Results for a few superclusters seem to imply that the necessary dark matter does not exist on supercluster scales. Mass determinations for the Local Supercluster imply (Huchra 1988), and Postman, Geller, & Huchra’s (1988) mass for the Corona Borealis supercluster gives (they also state that an increase in from 1 Mpc to 10-20 Mpc scales is not required to account for the supercluster’s observed peculiar velocities.) The Hercules Supercluster is a nearby, well-studied supercluster; determining its mass is a useful step in studying the properties of dark matter on large scales.
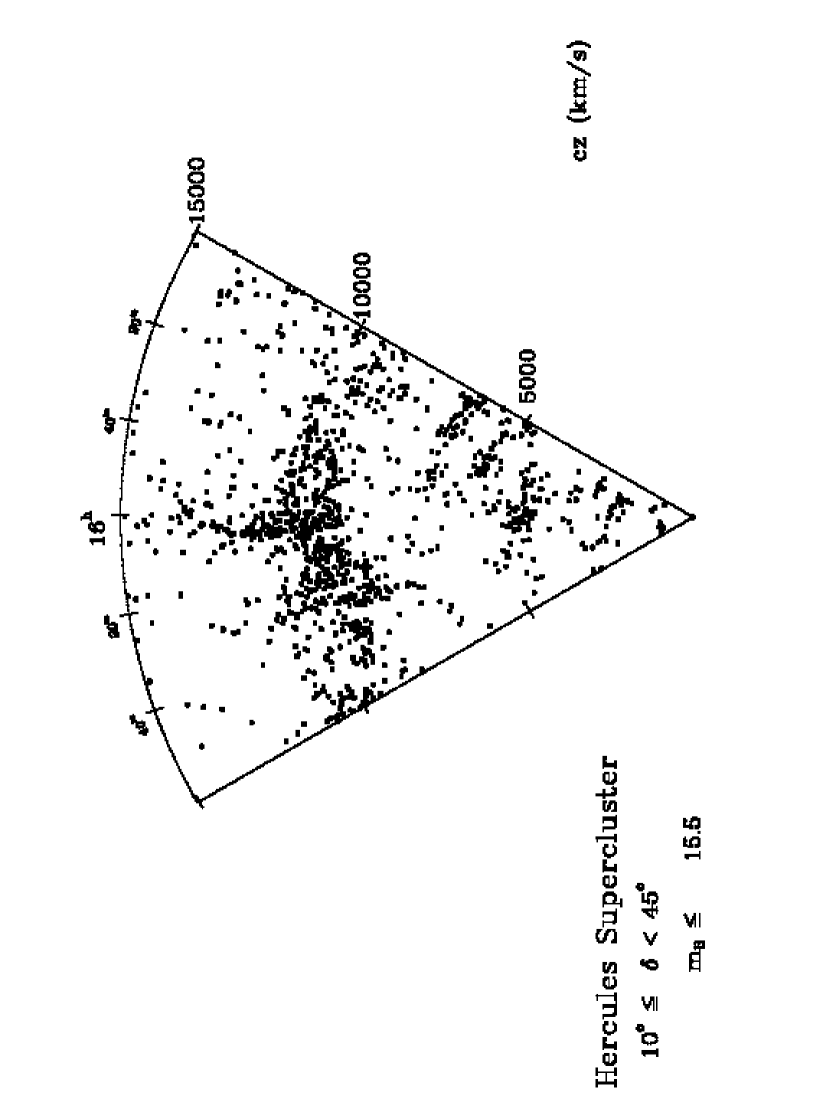
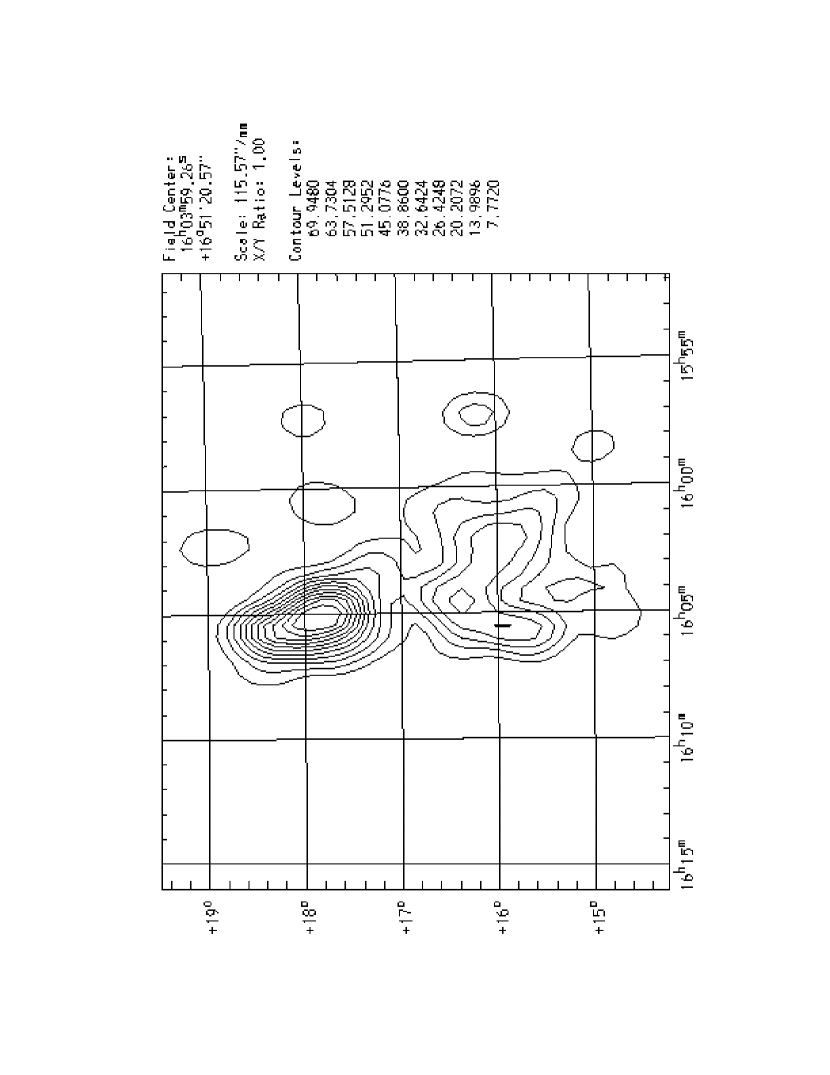
The first person to point out the Hercules supercluster (Shapley (1934)) compared it to the Virgo cluster, and stated that “[i]f it were not for its great distance (perhaps thirty megaparsecs or more) the twin supergalaxy in Hercules …would be equally interesting.” The region (Figure 1) contains two superclusters: the double cluster Abell 2197/99 ( 16h, , 11000 km s-1), and the ‘Hercules supercluster’, consisting of the rich cluster Abell 2151 (the ‘Hercules cluster’) and the double cluster Abell 2147/2152 (all at 16h, , 11000 km s-1). At a low density enhancement, all of these clusters, plus A2107, A2063, and A2052, can be considered part of a single supercluster (Postman, Geller & Huchra (1992); Bahcall & Soneira (1984)). We have obtained 175 new redshifts in a 22.5 square degree area which includes the Hercules supercluster; we combine these with redshifts from the literature in a study of the kinematics of this system. The goal of this survey is to determine the membership and masses of the three clusters, and whether they form a bound system.
Previous studies of Hercules galaxies can be grouped into three categories: studies of the region containing the supercluster, studies of the richest cluster, Abell 2151, and studies of the supercluster itself. Studies of the region include work by Freudling and collaborators (1988, 1991), who used the Tully-Fisher relation to study peculiar velocities, and Maccagni, Garilli, & Tarenghi (1994), who studied the galaxy distribution with optical data. Giovanelli, Chincarini & Haynes (1981) and Dickey (1997) studied the supercluster in HI, concluding that there were strong environmental effects on the mass of neutral hydrogen in the supercluster galaxies. Several groups (Dressler & Shectman 1988a ; Bird, Davis & Beers (1995); Huang & Sarazin (1996)) have studied the structure of A2151 with the optical galaxy distribution and X-ray maps. All groups report the presence of substructure in the cluster. The supercluster kinematics, especially involving A2147 and A2152, have been less well-studied. The last major kinematical study was done by Tarenghi et al. (1979, 1980), using a total of 150 redshifts (124 in the supercluster) in a 28 square degree field. They concluded that it was difficult to separate the galaxies into three clusters unambiguously and that, contrary to what is seen in other rich clusters, the Hercules regions dominated by early-type galaxies showed little evidence for gravitational relaxation.
The three clusters that form the Hercules supercluster have both interesting differences and similarities. All three are classified as Bautz-Morgan type III (Bautz & Morgan (1970); Leir & van den Bergh (1977)) and Rood-Sastry type F (Struble & Rood (1982)). All three are irregular and have spiral fractions of 50%; A2147 is the most regular of the three and has the lowest spiral fraction (Tarenghi et al. (1980)). A2147 and A2151 both have cooling flows (Henriksen & White (1996); Huang & Sarazin (1996)). Henriksen (1992) reported that A2151 and A2152 have similar X-ray luminosities ( erg s-1),111We use km s-1 Mpc-1. while A2147 has a much larger luminosity ( erg s-1). Ebeling et al. (1996), using ROSAT data, explain some of this discrepancy by showing that most of the X-ray flux from A2147 is from an AGN in the cluster and not its ICM. They give the X-ray luminosities of A2147 and A2151 as erg s-1 and erg s-1, respectively. The clusters all have unusual individual characteristics: A2151 contains well-known substructure (Bird, Davis & Beers (1995)), A2147 contains “an unusual diffuse radio source” (Burns et al. (1994)), and A2152 has by far the highest velocity dispersion ( km s-1) in the study by Zabludoff et al. (1993b) of dense cluster cores.
2 Observations and Data Reduction
Our ‘Hercules supercluster’ region of interest, comprising 22.5 square degrees ( and , B(1950)), now has a total of 294 velocities available from the literature. Of these, approximately 262 are possible cluster members ( km s-1). To augment this data, we constructed a catalog of galaxies in the region by combining and comparing two catalogs: one from the Minnesota Automated Plate Scanner (APS) scans of the Palomar Sky Survey (Pennington et al. (1993)) and one we generated using FOCAS (Valdes (1982)) and the Digitized Sky Survey (Lasker (1991)). The catalog was magnitude-calibrated using and CCD images of portions of the region obtained at the 1.2m telescope of the Whipple Observatory on Mt. Hopkins (see Appendix for more details).
We measured new redshifts from the magnitude-ordered version of our Hercules catalog, using the 1.5m telescope at FLWO with the FAST Cassegrain spectrograph (Fabricant et al. (1997)), a 300 l mm-1 grating, and a CCD detector. Integration times were typically 10 to 20 minutes, and data reduction was carried out with standard cross-correlation techniques (Kurtz et al. (1992)). We also obtained some new redshifts from a separate study of the Hercules -band luminosity function (Huchra et al. (1997)). All the data for galaxies in the region is in Table Kinematics of the Hercules Supercluster, where the columns are (1) name, (2) RA (J2000), (3) declination (J2000), (4) heliocentric velocity in km s-1, (5) velocity error, (6) magnitude (from the CCD calibration described in the appendix), (7) morphological type, and (8) velocity source.222 Table Kinematics of the Hercules Supercluster is available from the authors in electronic form. A velocity error of 100 km s-1 was assumed for velocities without published errors. Our redshift sample is complete to an magnitude of 15.1; our Hercules catalog of 293 galaxies without previously measured redshifts has a magnitude limit of .
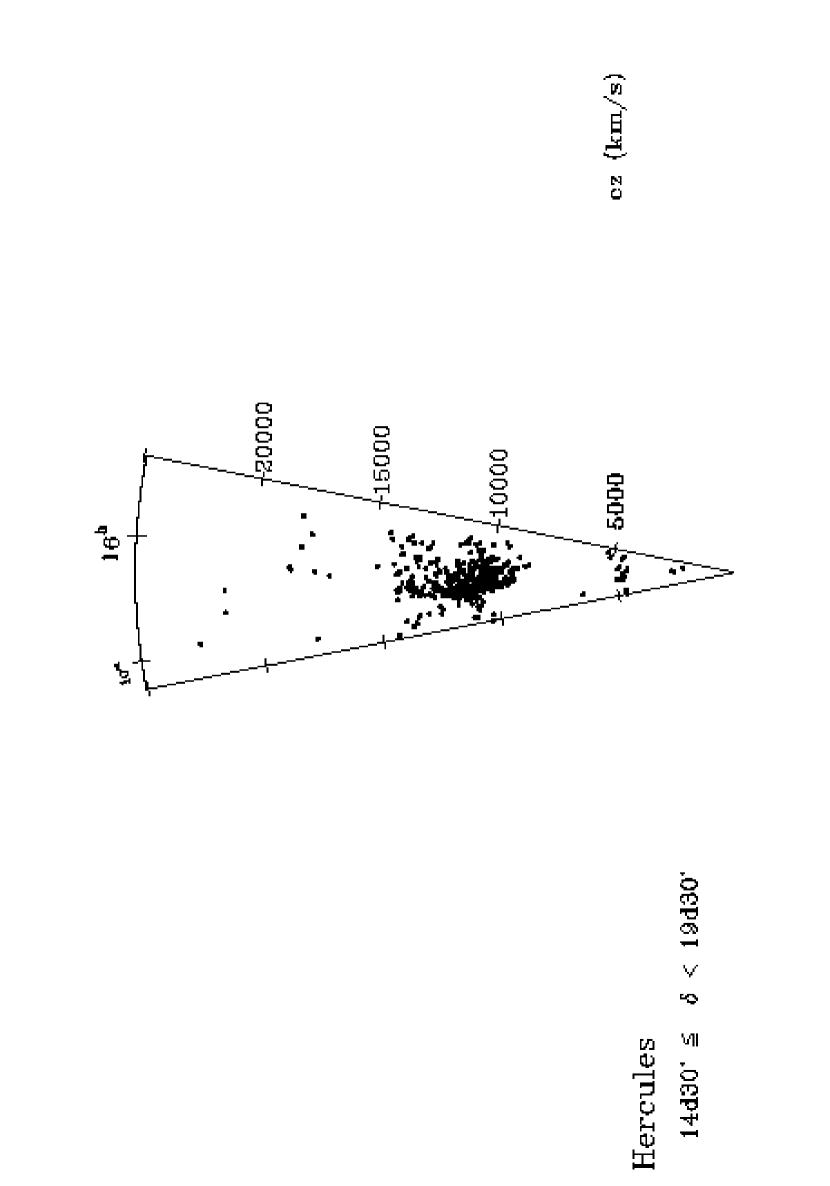
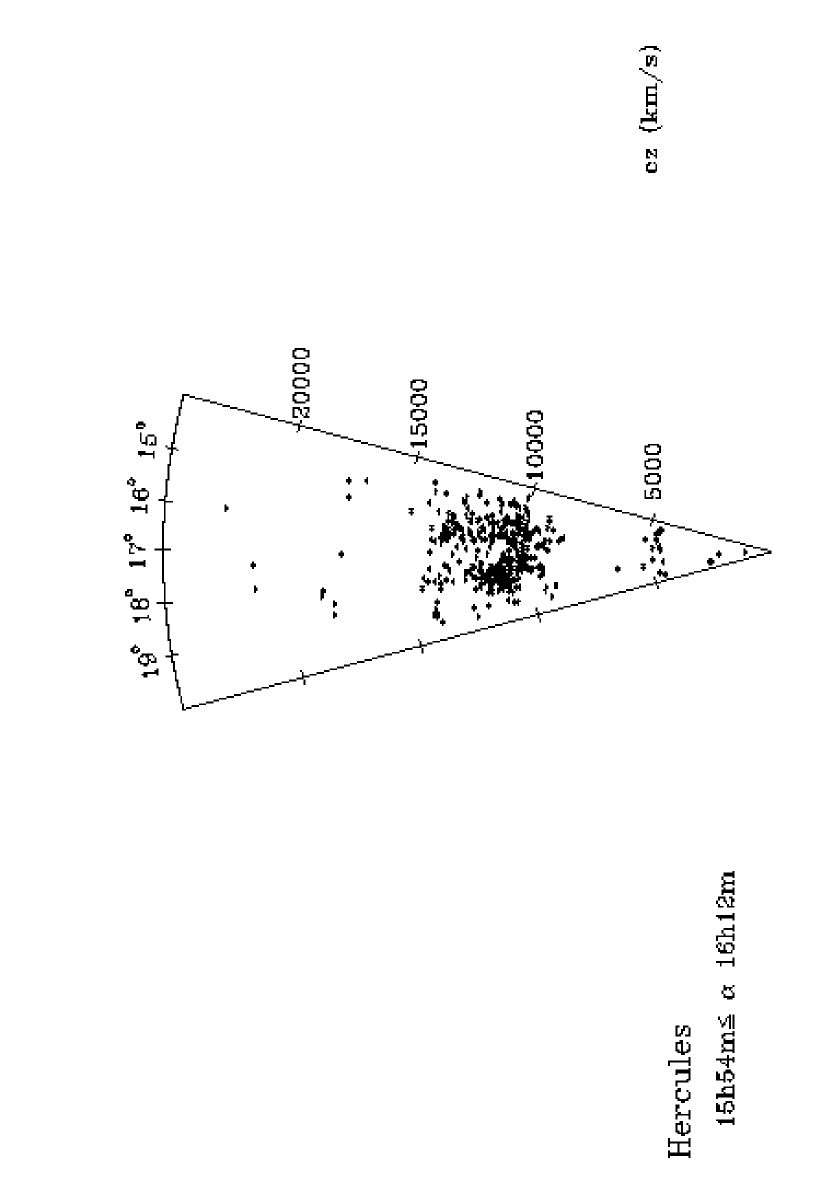
Of the total of 175 new redshifts, 152 belong to possible cluster members; thus we can do a kinematical study of the supercluster with more than three times as many redshifts as Tarenghi et al. (1980). Figure 2 shows the positions of the galaxies with new and literature velocities; most of the new velocities are in A2147, A2152, or the “dispersed” supercluster, since A2151 has been extensively observed. Figure 3 shows the distribution in velocity of the literature and new velocities. The galaxies with new velocities in these bins have a similar distribution on the sky (within the limits of small-number statistics) to the galaxies with literature velocities in the same bins. The cone diagrams in Figures 4 and 5 show all velocities in our field; from this it can be seen that the Hercules supercluster suffers from relatively little foreground or background contamination.
3 Cluster Separation
Tarenghi et al. (1980) noted the difficulty in separating the Hercules supercluster into the three Abell clusters. The presence of X-ray gas in all three clusters (Henriksen (1992)) suggests that they are separate dynamical entities; we wanted to confirm this using our position and velocity information before trying to separate the clusters. The most obvious test is to find out whether the velocity distribution is composed of a single Gaussian. We did this using a Lilliefors test, a variant of the K-S test in which the parameters of the Gaussian to be compared to the velocity distribution are derived from the distribution itself. We also computed several indicators of substructure: the skewness and kurtosis of the velocity distribution, and several statistics which measure substructure by computing the values of a quantity for each galaxy and its nearest neighbors. The statistic of Dressler & Shectman (1988b) measures the deviation of the average velocity and velocity dispersion computed for each galaxy and its nearest neighbors in projection from the global average velocity and global velocity dispersion. The statistic of West & Bothun (1990) measures the deviation of the position centroids computed for each galaxy and its nearest neighbors in velocity from the global centroids. The statistic of Bird (1994) combines position and velocity information by computing the projected mass estimator (see Section 4.1) for each galaxy and its nearest neighbors in projection.
We performed a Lilliefors test on the velocities of all objects in the supercluster using the ROSTAT statistics package of Beers et al. (1990); a Gaussian was rejected at the 99% level. We computed the substructure statistics following the procedure outlined by Bird (1994); the number of nearest neighbors used was equal to the square root of the number of galaxies. Unlike Bird, we used the standard mean and dispersion estimators, instead of biweight estimates. We computed the significance of the statistics by comparing the value of the statistic computed for the cluster to values computed for Monte Carlo realizations of the cluster generated by scrambling the velocities of the galaxies. The significance is the fraction of Monte Carlo realizations that have a value of the statistic less than that computed for the cluster. The significance of the skewness and kurtosis were evaluated by noting that their values are equal to the probability that a Gaussian distribution would have the same skewness or kurtosis as the observed distribution. The substructure statistics for the supercluster are shown in Table 2. All statistics except the test indicated the presence of substructure, significant at the ( %) level. From the Lilliefors and substructure tests we easily conclude that the supercluster is not a single dynamical entity, and that it is reasonable to attempt to assign galaxies to clusters.
3.1 Techniques
Several approaches can be used to assign cluster memberships and probabilities. Two well-known cluster-finding techniques are “friends-of-friends” (Huchra & Geller (1982)), which is a percolation algorithm, and the minimal spanning tree (Barrow, Sonoda & Bhavsar (1985)). The “friends-of-friends” algorithm finds companions of a galaxy and then the companions of the companions. All galaxies connected to the initial galaxy in this way are part of one cluster. The separations in position and velocity () at which two galaxies are considered to be companions change with the magnitude limit of the survey and the distance of the galaxies. The minimal spanning tree (MST) of a dataset is the shortest graph which connects all objects in the set with no circular paths; there are several simple algorithms for constructing such a structure. With the MST in hand, clusters can be constructed by “separating” the tree – that is, cutting “branches” longer than a certain length. Objects still connected after separation are part of the same cluster.
Neither of the above methods produces membership probabilities, although these could be assigned for friends-of-friends using density parameters. Two methods were explored that do assign probabilities: the KMM ( “Kaye’s Mixture Model”) algorithm (Ashman, Bird & Zepf (1994)) and fuzzy clustering (Jain & Dubes (1988); Kaufmann & Rousseeuw (1990)). The KMM algorithm defines the probability of an object’s membership in a cluster as the Gaussian distance from the object to the cluster center:
| (1) |
properly normalized by the sum of its membership probabilities in all clusters. It fits a user-specified number of Gaussian clusters to the data, maximizing a likelihood function based on the membership probabilities. The user must supply an initial guess for the locations of the clusters, but the final result does not depend sensitively on this guess (see below). Final membership probabilities are calculated after the KMM algorithm has converged. Fuzzy clustering also requires that the user specify the number of clusters, , but calculates membership probabilities directly, without first dividing the objects into clusters. The goal is to minimize the objective function
| (2) |
where is the membership probability of object in cluster and is the distance between objects and (a sum of projected distance on the sky and line-of-sight velocity difference weighted by a factor ), i. e.
| (3) |
To minimize the objective function, we used the algorithm given in Kaufmann & Rousseeuw (1990), which iteratively finds the local minimum using the method of Lagrange multipliers.
While there have been some tests of these individual methods against simulations (e. g. Barrow, Sonoda & Bhavsar (1985); Ashman, Bird & Zepf (1994)) there is little information available on their comparative performance in the context of separating nearby clusters. We therefore tested these methods on simulated clusters made to resemble our actual data. Clusters were simulated by picking galaxies’ velocities at random from a Gaussian distribution and their positions at random from a truncated King model for the surface density. Velocity dispersions ranging from 700 to 1000 km s-1 and core radii from 0.45-0.55 Mpc, which are typical for the Hercules clusters, were used. A magnitude-limited background was also included. We simulated fields of three clusters, varying the distance between clusters in position and velocity space using a 25-model grid with 5 different values each of position and velocity separation. Since all of the methods require user input parameters we tuned the performance of each algorithm by using the best result from a range of parameters.
In order to quantify the accuracy of the various separation methods, we defined a “separation statistic” , to be calculated for each of our simulated cluster sets. The algorithm for calculating is as follows:
-
1.
Calculate the centers of each cluster found by the cluster-finding method.
-
2.
For each method, determine which ‘found’ cluster corresponds to each original input cluster (the one closest in position on the sky).
-
3.
Calculate the “correctness” for each galaxy in each method. If the cluster the galaxy was assigned to by the method corresponds to its original input cluster, the “correctness” is 1; otherwise it is 0. For KMM and fuzzy clustering, each galaxy is assigned to the cluster for which it has the greatest membership probability.
-
4.
Calculate as the sum of , normalized by the total number of galaxies:
| (4) |
The -statistic can thus be considered a count of the “correct” answers. The background galaxies were used in the cluster-finding methods but were not included in the calculation of the statistic.
Figure 6 shows the values of the separation statistic for all four methods as a function of average position and velocity separations. The low values for all methods at low separations reflect the fact that no method could effectively separate the clusters in the region (, ). Overall, KMM and fuzzy clustering are the better performers. As expected, the performance of all the methods generally improves as the average separation increases; the improvement is larger for the angular separations. This is probably because the King model for the spatial positions of the galaxies is more centrally concentrated than the Gaussian used for their velocities. Friends-of-friends performs poorly as separation increases due to fragmentation: with input parameters such that the clusters were separated from each other, they were also separated into smaller pieces. This suggests that friends-of-friends is probably better suited to finding well-separated and compact clusters in data (as was its original purpose) than separating nearby clusters.
To compare fuzzy clustering and KMM we calculated another statistic. For the purposes of this study we were interested in determining which method of assigning galaxies to clusters produced the best estimate of the properties of the clusters, not just in determining which galaxy belongs to which cluster. To quantify this property of the separation methods, we calculated the six parameters (mean RA, dec, velocity, velocity dispersion, virial mass, and projected mass) of each cluster using the membership probabilities as weights, as described in Section 4.1. Then we compared these to the input parameters used to generate the clusters and calculated the RMS residuals, e. g.
| (5) |
The first sum is over the 3 “clusters” found by the algorithms; the second is over the 6 parameters computed for each. A lower value of the statistic represents better performance. (We note that this statistic should not be used to compare the results of clustering methods on clusters generated with different input parameters. For example, consider two sets of input clusters, where set is more widely separated in velocity than set . Even if the clustering results are equally accurate for both sets, the incorrectly assigned galaxies in the results for set will be more likely to have velocities further from the mean and hence bias the calculated velocity dispersions upward.)
From the results of Tarenghi et al. (1980) and Zabludoff et al. (1993b), we estimated the average separations of the three cluster pairs to be approximately 1.4° and 350-550 km s-1. For the artificial clusters closest to these parameters, KMM had the better -statistic in each case. This was because fuzzy clustering’s results are “too fuzzy”: although the galaxies are usually assigned to the correct cluster, they still have significant membership probabilities (up to ) in the clusters to which they are not assigned. (While this may be appropriate for a few galaxies for which the cluster assignment really is uncertain, it is physically unreasonable for most galaxies to “belong” to more than one cluster.) The overly fuzzy assignments result in the mean velocities of the three clusters being biased toward the mean of all the velocities, and the velocity dispersions being biased upward.
These two statistics show that the performance of various clustering methods depends heavily on the separation of the input clusters. The method to be used should depend on the problem at hand. Based on the results of our statistics, and for the Hercules Supercluster, the KMM method is the best for our purposes.
We tested the robustness of the KMM cluster-assignment algorithm using a jackknife procedure on our supercluster data. The KMM input data (galaxy positions and velocities) were randomly ordered, and the KMM algorithm was run on subsets of the original data. We fit three clusters to the data, corresponding to the three Abell clusters. The subset sizes were linearly increased from 100 galaxies to the full dataset of galaxies used in later analysis. The KMM input parameters (such as the initial cluster positions) were kept constant. The jackknife results showed only a small amount of scatter in the central positions and velocities of the clusters. The largest scatter was, as might be expected, for A2152, the cluster with the fewest galaxies and the largest spatial and velocity dispersion. Even so, the dispersion of estimated central velocities was only 112 km s-1, and the largest deviation of estimated central position about 12. We also tested the KMM procedure by using a range of initial cluster positions and velocities, similar to the procedure used by Colless & Dunn (1996). We found results similar to theirs – namely, that KMM converged to similar results with either good initial cluster velocity estimates (within 2000 km s-1) or initial positions (within 30′). The algorithm failed to converge to these clusters only when both position and velocity information were omitted. From these tests we concluded that the KMM results should be robust.
3.2 Results
The KMM algorithm is sensitive to outliers (Bird, Davis & Beers (1995)), so we restricted our final analysis to galaxies within 0.85° (1.6 Mpc) of the projected cluster centers. To find these centers we assigned each galaxy to the nearest of the Tarenghi et al. (1980) cluster centers-of-mass (A2151: 16h 5m 26s, 17°47′50″, A2152: 16h 5m 6s, 16°19′41″, A2147: 16h 1m 59s, 16°2′55″(J2000)) and then recalculated the centers using only galaxies within 0.85° of the center. This process was iterated until there was no further change in the center location; this typically only required three or four iterations. The resulting dataset had a total of 301 galaxies and did not include outlying groups which might bias the KMM solution. The remaining 113 galaxies in the supercluster velocity range (the “dispersed component” in the terminology of Tarenghi et al. (1980)) were analyzed kinematically but not fit to clusters. Resulting velocity histograms for the solutions are in Figure 7.
After inspecting the KMM results, we made one change to the cluster assignments. KMM assigned nine galaxies with velocities greater than 12000 km s to A2147. At first glance this seems reasonable: since these galaxies are on the west side of A2147, they are unlikely to be part of A2152, a degree away on the sky. We decided after inspecting the velocity histogram (Figure 7), however, that these galaxies were more likely part of the dispersed supercluster or a separate background group than of A2147, so we reassigned them. This reassignment also makes the velocity dispersion of A2147 more compatible with its measured X-ray temperature (see Section 4.1). After the reassignment there are 293 cluster galaxies and 122 members of the dispersed supercluster.
Our computed parameters for A2151 (see Table 3) were similar to other reported values. This is not surprising, as it is reasonably well-separated from the other two clusters, has the most available velocities, and had relatively few new velocities added. However, our solutions for the separation of A2152 and A2147 were different from previously reported results. A2152 had a significantly higher mean velocity than previously reported (1294297 km s-1, error computed using formulas in Section 4.1), and both A2147 and A2152 had lower velocity dispersions (821 and 715 km s-1), as compared to Zabludoff et al.’s 1081 km s-1 (A2147) and 1346 km s-1 (A2152). About 15 galaxies had significant membership probabilities (%) for more than one cluster; these galaxies were fractionally assigned to the appropriate cluster. Thus, in the velocity histograms, the number of galaxies in each bin is not necessarily an integer. Figure 8 shows the cluster assignments of all 292 galaxies for the KMM solution and the locations of the 122 members of the “dispersed supercluster”.
4 Cluster Dynamics
4.1 Cluster parameters
We computed the usual cluster parameters for all three of our cluster assignment solutions. In computing the mean velocities and dispersions given in Table 3, fractionally assigned galaxies were included in the calculation for a cluster weighted by their membership probabilities, , e.g.
| (6) |
| (7) |
confidence levels for these parameters were computed using the formulas of Danese, De Zotti, and di Tullio (1980), modified to take the membership probabilities into account:
| (8) |
| (9) |
where
| (10) |
and
| (11) |
is a numerical factor which depends on the confidence level and the number of measurements . Errors in the weights were not taken into account in our modifications of these formulae.
We obtained few new velocities in the region of A2151, and, as expected, our mean velocity and dispersion results were compatible, within the error, to previously published results. However, our results for A2152 and A2147 were quite different from previous results: we found lower velocity dispersions, of 715 and 821 km s-1, and a greater mean velocity separation between the two clusters, mostly due to an increase in the mean velocity of A2152. We redid the KMM analysis without our new velocities and found, using a Student’s -test, that the increase in mean velocity between the solution derived with the new velocities and the one without was statistically significant at the 99.3% level.
We estimated the masses of the individual clusters using two standard methods: the virial theorem and the projected mass estimator of Heisler, Tremaine, & Bahcall (1982). The contribution of each galaxy to the mass of a cluster was weighted by its membership probability in that cluster. For example, we used the following expression for the virial mass of a cluster:
| (12) |
Similar modifications were made for the projected mass. The results are in Table 3; the errors in the masses are 1 confidence levels. Previously determined masses for the Hercules clusters are in Table 4; our masses for A2151 are in general agreement with those of Bird, Davis & Beers (1995) and Tarenghi et al. (1980). Our virial masses for A2147 and A2152 are smaller than those of Tarenghi et al. (1980) by up to a factor of three, because we find lower velocity dispersions. Our projected masses are larger than the virial masses and therefore closer to the virial masses of Tarenghi et al. This is not due to our larger cluster membership cutoff; when we used their value of 0.8° and re-calculated the masses, the projected masses decreased by less than 15% and the ratio of virial to projected mass changed by less than 5%.
We also compared our computed velocity dispersions with X-ray data on the clusters. The compilation of David et al. (1993) contains X-ray temperatures for A2151 and A2147; however, we were unable to find a published X-ray temperature for A2152. We use the relation of Girardi et al. (1996) (; 2 error bars) to compute X-ray predicted velocity dispersions. For A2151 ( keV), the prediction is km s-1, compatible with our measured value of 705 km s-1. For A2147 ( keV), the prediction for A2147 is km s-1, compatible with our measured value of 821 km s-1 (after the background is removed; without the background removed our velocity dispersion is 992 km s-1). We conclude that our velocity dispersions are compatible with the available X-ray temperatures. The X-ray-derived mass for A2147 from Henriksen & White (1996), , is much larger than both our mass and that of Tarenghi et al. (1980). Henriksen & White did not correct for the presence of the AGN detected by Ebeling et al. (1996); contamination from this source may have resulted in their overly large mass.
Because our sample goes to a fainter magnitude limit, we have a total of 122 “dispersed” cluster members while Tarenghi et al. (1980) have 35. The velocity histogram for the dispersed component is in Figure 7 with the cluster histograms. Our results for the kinematics of the dispersed population are fairly similar, however: we find a mean velocity and dispersion of 128 km s-1 and km s-1, while they find a mean and dispersion of 238 km s-1 and km s-1. We confirm their result that the velocity dispersion of the clusters is smaller than that of the dispersed component. The only ‘substructure’ in the dispersed component is the group of galaxies at 15h 59m, 16° 12′, also observed in the Burns et al. (1987) survey of poor groups, and the possible background group to A2147 (see Section 4.2).
We estimated the mass-to-light ratios of the clusters by adding up the luminosities of the cluster galaxies and making a faint-end correction. The luminosities were calculated from the magnitudes, using (Lin et al. (1996)), -corrections of the form , and corrections for galactic absorption from Burstein & Heiles (1984), with . We derived the faint-end correction factor from the luminosity functions derived by Lugger (1989) for A2147 and A2151 (we assume the luminosity function of A2152 to be similar to that of A2147). Although these functions were determined without the use of redshifts, they are derived from data which are background-corrected and have a faint limit several magnitudes fainter than ours. We corrected the Schechter function parameters given by Lugger (, for A2147 and A2152, and for A2151) to ; the faint-end correction is then
| (13) |
The total luminosity was then estimated with the relation The resulting total luminosities and mass-to-light ratios are in Table 5. We can compare these mass-to-light ratios to the closure mass-to-light ratio, which is
| (14) |
where is the field luminosity density: . Lin et al. (1996) give Mpc-3 which yields . A2151 has a mass-to-light ratio well below this value, while A2152’s ratio is about one third and A2147’s ratio about one half of the closure density. This suggests either that these two clusters are extremely massive, or that the masses are contaminated by the presence of substructure or supercluster interlopers, or that our photometry has a serious zero-point error we failed to detect. These results are much larger than those of Postman, Geller, & Huchra (1988), who derived a mass-to-light ratio of 256 in for the clusters in the Corona Borealis Supercluster.
4.2 Velocity Structure
Previous work has shown that the presence of substructure can significantly affect the virial masses of clusters, and that A2151 has significant substructure on scales of less than 1 Mpc (Bird, Davis & Beers (1995)). We attempted to detect the presence of substructure in the clusters. Using a Lilliefors test, we found that the velocity distributions of A2147 differed significantly from a Gaussian. We also ran the substructure tests used on the supercluster on each of the individual clusters. For the purposes of these tests we assigned each galaxy to the cluster in which its membership probability was largest, since it was not obvious how to generalize these tests for fractional membership. The results indicated the presence of substructure in A2151, significant at the 99.9% level, for both the and statistics. A2152 also had significant (99.9%) values of the and statistics; however we are hesitant to claim detection of substructure since this result is based on only 56 redshifts. A2147 had a significant result for and marginally significant one for ; we regard this as tantalizing but again not convincing. We tried running the KMM algorithm on A2147 and A2152, using several random guesses for initial group positions and velocities, but the algorithms did not converge to dynamically distinct groups. This illustrates that the initial guesses are important, and may require additional information such as X-ray maps and brightest galaxy positions. Using our data, the KMM algorithm, and the subcluster parameters of Bird, Davis and Beers (1995) as input to KMM, we were able to reproduce their KMM results for the substructure in A2151. The possible or definite presence of substructure in the clusters means that the virial masses may be unreliable.
Velocity segregation between galaxies of different morphological type can also be important in clusters. We separated all 292 galaxies used in the cluster fitting into elliptical/S0 and spiral groups based on morphological classifications from the literature (Dressler & Shectman 1988; Maccagni, Garilli & Tarenghi 1995; Huchra 1996), or from our CCD frames and the Digitized Sky Survey images if published classifications were not available. We calculated the mean velocities and velocity dispersions for the ellipticals and spirals (Table 6), and tested for statistically significant (at the 95% level) differences between the two groups (using a t-test for the mean velocities, and an F-test for the velocity dispersions). We found differences in both the mean and dispersion for A2151 only. Tarenghi et al. (1980) found the same differences in A2151 (although the found the spirals to have a higher, rather than lower, velocity dispersion), and a difference in the dispersion of A2147. We do find a difference between the ellipticals and spirals in A2147 when we add in the high-velocity galaxies removed earlier (see Section 3.2) since 2/3 of these are spirals.
The velocity differences in A2151 are probably accountable for by substructure, although the results of other groups on the kinematics of the morphological-type groups in A2151 confuse, rather than clarify, the question of which type has the larger velocity dispersion. Zabludoff & Franx (1993), separating the galaxies into three groups: (elliptical, spiral, and S0), found a significant difference only between the mean velocities of the ellipticals and spirals. Bird, Davis & Beers (1993; BDB) compared the kinematics of the three morphological groups in two substructures. They found the that spirals had greater mean velocities, and that S0s had a far larger velocity dispersion in the central substructure. Maccagni, Garilli & Tarenghi (1994; MGT) compared E/S0 and S groups (for different substructures than BDB), finding higher mean spiral velocities for all three substructures and similar velocity dispersions for the NNE and central substructures. They find a much higher velocity dispersion for their SSW substructure. We conclude that our finding that the spirals in A2151 have a greater mean velocity than the other types agrees with all of these groups and fits well with the idea that presence of substructure in this cluster. The larger velocity dispersion we find for the E/S0 galaxies may be due to the large dispersion of the S0s found by BDB.
We were intrigued by one results quoted by MGT: in their SSW substructure they found the spiral and elliptical/S0 velocity dispersions to be 1133 km s-1 and 142 km s-1. This is a difference of a factor of eight! However, there are only 8 ellipticals and 16 spirals in this substructure, and they suggest the spirals may be part of a field structure. The ‘SSW’ structure of MGT actually includes the entire southern region of A2151. We calculated the dynamical parameters of a SW structure defined as . This group contains seven ellipticals and seven spirals. We found similar Results to those of MGT (see Table 6), with the ellipticals having a lower mean velocity and a much lower velocity dispersion than the spirals; however, the t- and F-tests did not show these differences to be statistically significant. We did find statistically significant differences between the means and dispersions of the SW and A2151 spirals, and between the velocity dispersions of the SW ellipticals and the A2151 ellipticals, and the SW galaxies and A2151 galaxies unseparated by type. It is difficult to be certain given the small-number statistics, but the evidence appears to point toward the existence of a separate group of galaxies in the SW of A2151. This point will be revisited in Section 5.2.
5 Galaxy and cluster morphology
5.1 Cluster appearance in different galaxy type
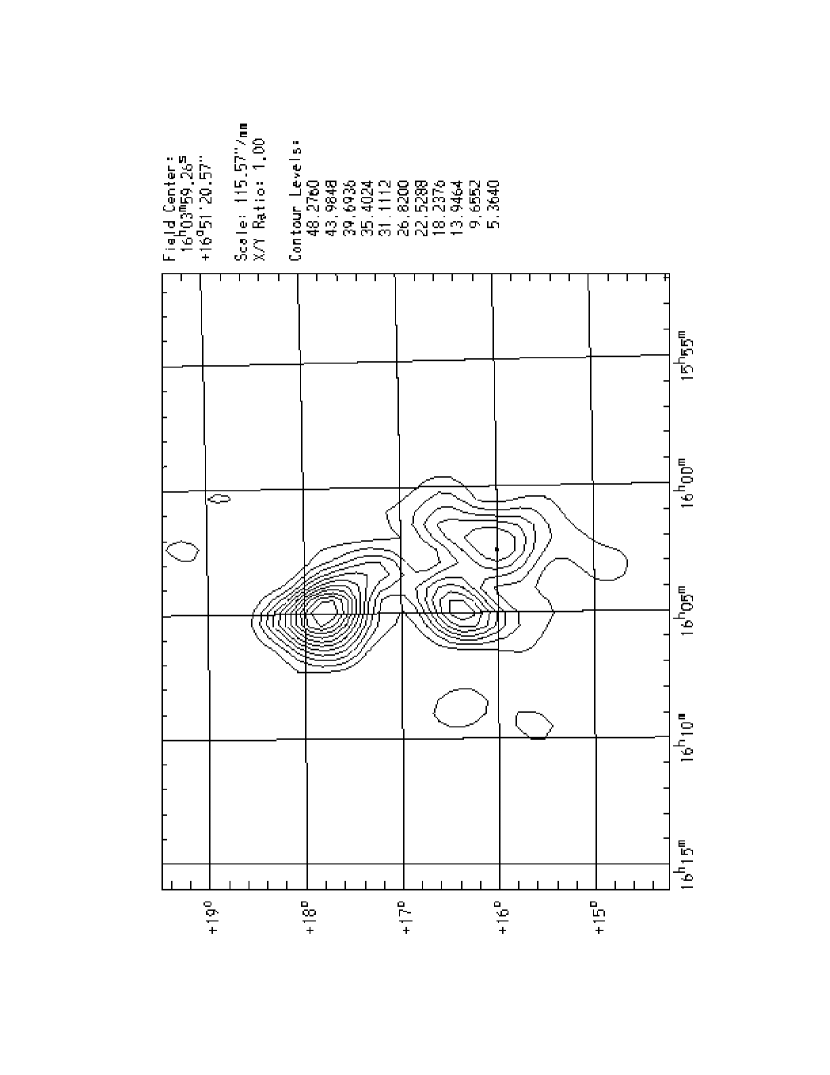
With a large sample of galaxies, separated into clusters, and morphologically classified, we can study the morphology-density relation in the three clusters. The Hercules clusters have a much greater proportion of spirals than rich clusters like Coma and Virgo, so the near absence of spirals in the cluster center is not likely to occur. Contour plots of the galaxy density in the supercluster (Figures 9 and 10) show something like the usual morphology-density relations for all three clusters: ellipticals are more concentrated in the center of the cluster. The centers and extent of the clusters in spirals and ellipticals also appear to be similar. Tarenghi et al. (1980) also found that the two types of galaxies had similar spatial distributions. Most of the density enhancements outside the three clusters consist mainly of spirals; the “elliptical” groups are smaller. This large spiral fraction is unsurprising, given the large spiral fraction in the supercluster overall.
5.2 Cluster classification
An interesting property of the Hercules clusters is their cluster morphological type. The classification of the Hercules clusters as BM-III and RS-F would seem to be incompatible with the presence of cD galaxies, which are supposed to form in rich, relaxed clusters. However, Zabludoff et al. (1993b) classify both A2147 and A2151 as cD clusters with the cDs being NGC 6034 and UGC 10143A (a. k. a. 16000+1606), respectively. (Note: their coordinates for NGC 6034 are incorrect; the correct coordinates are 16h01m16.4s, 17°20′07″(B1950).) These claims are apparently based on the surface photometry of Oemler (1976) and Schombert (1986), who noted that the surface brightness profiles of these galaxies show the extended envelope characteristic of cD galaxies. UGC 10143A is the brightest galaxy in A2147 and is located near the cluster center, presumably at the bottom of its potential well. NGC 6034 is not the brightest galaxy in A2151, and is located far from the cluster center. It is, however, located in the center of the SW group discussed in Section 4.2; this may be further evidence that this group is a dynamically distinct subclump of A2151. Even if NGC 6034 is at the bottom of the group’s potential, the ‘well’ is not very deep. NGC 6034 has unusual radio features: it dominates the radio continuum emission in this field and shows rare HI absorption (Dickey (1997)). Huang & Sarazin (1996) report that the brightest cluster galaxy in A2151, NGC 6041A, is located at the central X-ray brightness peak and the optical cluster center, but that “it is certainly not a D or cD galaxy”. This apparent contradiction between the cluster types and the existence of cD galaxies does not appear to have been mentioned before.
6 Supercluster Dynamics
To see if the mean velocity differences between the clusters corresponded to physical separations, we attempted to determine the true line-of-sight position of the three clusters using several methods. We analyzed the distances given by Buta & Corwin (1986) from use of the band Tully-Fisher relation. From the mean errors given for total magnitude and HI line width, we calculate the errors in their distances to be % per galaxy, which is rather small since Pierce & Tully (1992) estimate the scatter in the band Tully-Fisher relation as magnitudes, or % in distance. Since the errors in individual distances are likely to be large, we calculated distances to the clusters by averaging the distances of all galaxies in each cluster. (We identified their galaxies with ours on the basis of position and velocity and used our cluster assignments.) Unfortunately, there were only a few galaxies with distance estimates in each of A2147 and A2152. We quote two sets of results: one based on the line width data from Giovanelli, Chincarini, & Haynes (1981), marked ‘GCH’, and one based on all other data, since Buta and Corwin remark that these two samples are different. Both show that the distance of the clusters correlates with their redshift, although the absolute distances are quite different. We found a similar ordering of distances from calculating distances using the brightest cluster galaxy method and data of Lauer & Postman (1994) and Postman & Lauer (1995). They estimate their typical distance accuracy as 17% per BCG. A summary of all three sets of distances is in Table 7. Since the distance errors may be large, we regard these distance results as mildly supportive of our kinematical results but do not use them in further computations.
One indicators of the dynamical state of the supercluster is the crossing time compared to a Hubble time. We computed several crossing times for the supercluster: the virial crossing time , the moment of inertia crossing time , and the linear moment crossing time . We used the formulae of Gott & Turner (1977):
| (15) |
| (16) |
( angular distance from cluster center to supercluster center of mass)
| (17) |
where all sums are over the three clusters. All three crossing times are approximately 10% of the Hubble time: , , and . This indicate that the supercluster is bound.
Another way to determine whether the supercluster is bound is to the Newtonian binding condition of Davis et al. (1995), derived from the two-body models of Beers, Geller, & Huchra (1982). A pair of gravitating masses is bound if
| (18) |
where is the angle between the plane of the sky and the true line separating the two clusters, is their projected separation, and is their relative line-of-sight velocity. The true physical and velocity separations are and . From the available information we can determine the range of possible over which the three pairs of clusters could be bound.
Table 8 shows the values of and for each of the three pairs, and the “binding ratio” (the left-hand side of Eq. 18) for all three. The results show that, for our calculated velocity differences, the A2147/A2151 system is bound for A2152 would not be bound to A2151 or A2147 for any projection angle. If we consider A2151 and A2147 to be a single system located at the midpoint of their projected positions and radial velocities, then A2152 would be bound to this system for . Colless & Dunn (1996) point out that the probability of observing a system with projection angle is proportional to ; this gives probabilities of 40% that A2152 is bound to A2151+A2147, and 77% that A2147 is bound to A2151. From this we conclude that A2147 and A2151 are probably bound to each other, but that there is not good evidence for the supercluster as a whole to be bound.
Tarenghi et al. (1980) made a limited attempt at studying the clusters as part of a three-body system. They compared the sum of the virial masses of the three clusters to the virial mass of the entire supercluster complex (considering all galaxies as individual members of the supercluster), and found the two to be roughly comparable. They also computed the virial mass of the three mass-point system comprised of the three clusters, but found a very low mass (, less than their individual cluster masses.) With an improved redshift sample, and a better separation of the galaxies into clusters, we can improve upon their work. The supercluster virial and projected masses, calculated assuming the three clusters as mass points located at their central positions and radial velocities, and, of course, assuming the supercluster is relaxed, are and . The sums of the cluster masses are and . Since the two sums of cluster masses are comparable to the binding mass for the supercluster (one half of the virial mass), this can be considered additional evidence that the supercluster is bound. From all of the above results (crossing times, binding ratios, and binding mass) we consider it reasonable to assume the supercluster is marginally bound.
Assuming the supercluster to be bound means that it is reasonable to calculate its mass-to-light ratio to derive a value for . We computed the total luminosity of the supercluster using a similar method to that used in Section 4.1: computing the total luminosity from the galaxy magnitudes and making a faint-end correction. The Schechter function used was one we fit to the data, with parameters (, ). The total supercluster luminosity was . An upper limit for the volume of the supercluster (assuming it to cover 22.5 square degrees and km s-1 to km s-1), is Mpc3, giving a lower limit to the luminosity density of Mpc-3. This is an overdensity of a factor of 13 compared to the LCRS field luminosity density. A plausible lower limit to the supercluster volume is the volume enclosed in the virial radius where is the harmonic radius (Carlberg et al. (1996)). The computed virial radius for the three clusters as mass points is 3.75 Mpc, giving a volume of 222 Mpc3. The corresponding luminosity density, Mpc-3, is an overdensity of a factor of 190 compared to the field.
The mass-to-light ratio of the supercluster can be computed from the above dynamical parameters. The mass-to-light ratio of the supercluster, using (the average of the virial and projected masses) is then ; this ratio yields a value for of . This is very close to the value derived by Small et al. (1998) for the Corona Borealis Supercluster, although they used a very different method (calculating the virial mass considering all galaxies as individual members of the supercluster). Postman, Geller, & Huchra (1988) derived for Cor Bor by assuming the supercluster had the same as the clusters; this is also compatible with our result.
7 Conclusions
We have demonstrated that the assignment of galaxies to adjacent clusters in a supercluster can have significant effect on the clusters’ dynamical parameters. We conclude that the KMM algorithm is a useful tool for this cluster assignment procedure. We find that A2152 and A2147 were probably confused in previous studies, and that the velocity dispersions of both are lower than those in previous work (715 and 821 km s-1, respectively); further, A2152 has a slightly larger mean velocity. Distance measurements of the clusters support this assessment. Our dynamical measurements of the supercluster support the conclusion that it is bound; its mass-to-light ratio yields a value for of , compatible with other measurements from superclusters.
Acknowledgements.
We thank L. Macri and W. Brown for obtaining CCD images of the supercluster, P. Berlind, J. Peters, and P. Challis for assistance with obtaining redshifts, and D. Fabricant for building the FAST spectrograph. We thank the referee for helpful suggestions, J.M. Dickey for communicating new redshifts in advance of publication, and C. Bird for providing us with the ROSTAT and KMM software. This research has made use of the APS Catalog of the POSS I which is supported by the National Science Foundation, the National Aeronautics and Space Administration, and the University of Minnesota. The APS databases can be accessed at http://isis.spa.umn.edu/. The Digitized Sky Survey was produced at the Space Telescope Science Institute under US Government grant NAG W-2166. The images of these surveys are based on photographic data obtained using the Oschin Schmidt telescope on Palomar Mountain and the UK Schmidt telescope. The plates were processed into the present compressed digital form with the permission of these institutions. This research has made use of the NASA Astrophysics Data System Catalog Service.Appendix A Catalog construction
The ideal catalog for a dynamical study of a supercluster is one that is magnitude-limited, so that a spatially uniform sample of galaxies can be made. While several catalogs of galaxies in Hercules or A2151 have been made (Dickey et al. (1987), Dressler & Shectman 1988a ), none covered all three clusters and hence are not ideal for our study. The original Palomar Sky Survey can be used in two ways to generate catalogs of galaxies in nearby clusters: using automatic detection techniques such as FOCAS on images from the Digitized Sky Survey (Lasker (1991)), and extracting similar information from a publicly available catalog of the Minnesota Automated Plate Survey. We used both techniques to construct a catalog of galaxies in Hercules, and our intentions were both to test them against each other and to use them to complement each other. Our goal was to create as complete a galaxy catalog as possible, with a magnitude limit such that it would include at least 200 galaxies in Hercules without measured redshifts.
A.1 APS
The Minnesota Automated Plate Survey (Pennington et al. (1993), hereafter referred to as APS) is a catalog of all the objects detected in digitizing scans of the O (blue) and E (red) plates of the original Palomar Sky Survey. The objects’ coordinates, magnitudes, sizes, shapes, and classifications are available. The classification, done by a neural network algorithm, is given in the form of the probability that the object is a galaxy (the parameter node_gal); an object is assumed to be a star if it is not a galaxy. The catalog is accessible over the World Wide Web through the NASA Astrophysics Data System.
To make a list of objects in the supercluster, we made a query for all objects in our region with node_gal(O) and . We used the O plate classifications because, according to the APS catalog documentation, they are more accurate. We used a magnitude limit from the E plates to more closely match the results of the FOCAS catalog, which is also based on the E plates. The low limit of node_gal was chosen so that as few galaxies as possible would be missed. Unfortunately, as seen below, this resulted in a large amount of contamination of the galaxy list by stars. Since we did not know the transformation of APS magnitudes to a standard system, we chose the limit so that the resulting catalog would have a reasonable number of objects; our APS catalog contained 1142 galaxy candidates.
A.2 FOCAS
We also used the ‘faint object classification and analysis system’ in IRAF (Valdes (1982)) to extract a list of galaxies in the region. FOCAS detects, measures (areas, moments, and magnitudes), and classifies all of the objects in an image. The classification algorithm fits templates based on the PSF to the objects; objects are classified based on the parameters of the best-fitting template. The result of running FOCAS is a catalog with entries similar to those of the APS. FOCAS attempts to split multiple or overlapping objects into components; this task is not always successful, since it tends to split bright galaxies into multiple parts unnecessarily. This was not a problem for the fainter galaxies but introduces an additional source of error into the magnitudes of bright objects. We ran FOCAS using the standard script ‘autofocas’ described in the documentation (Valdes (1982)) and the suggested input parameters: , , . The saturation level was set at 15100 counts to provide an adequate discrimination between stars and galaxies. The catalog magnitude limit was set at 21.5; all other parameters were left at the FOCAS defaults, including the classification rules.
We constructed a FOCAS catalog from the Digitized Sky Survey (Lasker (1991)) image of the region, made from the Palomar Sky Survey E plates. Using the FOCAS-provided pixel centers and the transformation routines provided in the DSS documentation, we computed coordinates for each object. No photometric information was available for the Digitized Sky Survey images, so the FOCAS magnitudes were determined assuming a linear pixel-values-to-intensity relation and the default zero point: . We used the FOCAS total magnitudes, which sums the intensity inside the FOCAS ‘total area’, as these have been shown to be less biased than isophotal magnitudes (Weir, Djorgovski & Fayyad (1995)). (We checked the linearity assumption by comparing star profiles made from the DSS and from a CCD image; the DSS pixel values (photographic density) were linear with intensity, with a correlation coefficient .)
We extracted a list of FOCAS-classified ‘galaxies’ from the catalog, with (again, an arbitrary) magnitude limit of . To the FOCAS ‘galaxy’ list we added a list of ‘potential galaxies’ which FOCAS had classified as stars. We suspected that these objects might be galaxies because of large ellipticity or area, but they had been automatically classified as stars because they were saturated. (Changing the FOCAS saturation level parameter so that these objects were classified as galaxies was found to result in a very large contamination of the ‘galaxy’ list by stars.) The resulting FOCAS list of ‘galaxies’ and ‘potential galaxies’ had 591 entries. We also constructed another ‘larger’ FOCAS catalog, containing all objects to the same magnitude limit regardless of classification; there were 10043 objects in this list.
We constructed a catalog of galaxies with measured velocities using NED333The NASA/IPAC Extragalactic Database is operated by the Jet Propulsion Laboratory, California Institute of Technology, under contract from the National Aeronautics and Space Administration. and ZCAT (Huchra (1996)). NED was taken to be the auxiliary source, with all ZCAT objects going into the reference catalog, and NED objects included only if they were not already in ZCAT. Since the two catalogs use different naming conventions, we merged them using a matching procedure: two galaxies were considered to be the same object if they were within a specified distance both in position and in velocity. In practice, the velocity information was more useful. Velocities for the ‘same’ object (objects were assumed to be the same if 5′ diameter fields centered on each of their coordinates contained the same brightest galaxy) were generally within 100 km s-1, even if the catalog coordinates were disparate by several arcminutes. To this reference catalog list we added a list of galaxies whose velocities were made available as part of a separate infrared-selected survey in the Hercules region (Huchra et al. (1997)).
The catalog of galaxies whose redshifts would be measured was constructed by first merging the APS and FOCAS lists. This procedure showed that the astrometric calibrations of both the APS and DSS were excellent: ‘matched’ objects typically differed in position by only a few arcseconds. Some objects in both the APS and FOCAS lists were not matched with objects in the opposite list. By searching the full APS catalog and the FOCAS ‘larger’ catalog, we found that all of these ‘unmatched’ objects were included in the catalog they were ‘missing’ from, but were classified as something other than a galaxy. In particular, FOCAS often classified galaxies as type ‘d’ (for ‘diffuse’). We found the FOCAS equivalent object, and its magnitude, for each unmatched APS object, so that the merged list would have a uniform source of magnitudes. We then removed galaxies in the reference catalog (which already had measured velocities) from the merged list. All of the reference catalog galaxies had APS and FOCAS counterparts, once position errors, misclassification, and the magnitude limit had been accounted for. We estimated the completeness of our merged list by comparing it with the complete list of Zwicky galaxies in the region, to a B magnitude of 15.5. 122 of these 132 galaxies were in the merged list and classified as galaxies; all of the remaining 10 were classified as stars in the full APS and ‘larger’ FOCAS catalogs. 4 of these 10 galaxies were bright NGC/IC objects (which would not likely have required velocity measurements), so our completeness is .
The 958 remaining objects in the merged list were examined visually on the DSS images to determine if they were in fact galaxies. To separate galaxies from merged stars we looked for the existence of a bulge or disk in a object, and compared the elongation and size of the objects to the PSF of nearby stars. This last is important because aberrations mean that the PSF is not round near the edge of a plate. The overall ‘galaxy yield’ for the merged list was 31%; the yield was higher for objects classified as galaxies by both FOCAS and APS (55%), and lower for objects classified as galaxies by FOCAS alone (13%), or APS alone (25%). Objects misclassified as galaxies were most often two nearby or overlapping stars (45%), single stars with diffraction spikes (18%), or overlapping faint galaxies (4%). This result is not unexpected since the surface density of stars is about fifty times that of galaxies at this magnitude but implies that stars misclassified as galaxies can severely contaminate a ‘galaxy’ list which is not carefully examined. The FOCAS ‘double stars’ were usually closer than the APS ‘double stars’ (the images touched or were less than a PSF diameter apart), which implies that FOCAS is better at separating nearby objects than the APS algorithm.
The resulting list of galaxies (293 in total) were magnitude-ordered using the FOCAS total magnitudes; redshifts were measured for the brightest of these galaxies. For the sake of interest, we computed the transformation between APS O magnitudes and the reference catalog magnitudes (which were on the Zwicky system (Huchra (1976))) during the removal of reference catalog galaxies from the merged list. We found that the APS O magnitudes were fainter than the catalog magnitudes (, see Figure 11). Some of the features of Figure 11 are due to artifacts of the reference catalog compilation process; specifically, is the Zwicky catalog limit, and the large number of galaxies at is due to imprecise magnitude estimates in the Uppsala General Catalog. Given the APS catalog construction procedures, this large magnitude offset is not unexpected (Cabranela (1996)). The scatter of about 0.3 magnitudes in the offset is also not unexpected given the 0.3 magnitude scatter in the Zwicky magnitudes (Huchra (1976); Bothun & Cornell (1990)).
In order to have a uniform set of magnitudes for all galaxies in the supercluster, we determined the magnitudes from the FOCAS total magnitudes measured on the DSS. To calibrate the FOCAS magnitudes, we obtained CCD images (on photometric nights) in and of several fields in the region using the 1.2m telescope at FLWO. We reduced the CCD images in the standard manner, and measured asymptotic total magnitudes of galaxies using a series of apertures (see Table 9). We did a least squares fit of both and magnitudes against the DSS magnitudes in order to compare our photometry to the magnitudes published by Gavazzi & Boselli (1996) and available magnitudes from NED. The results are in Figures 12 and 13; there is no evidence of a significant scale error or zero-point shift in either color. (The large scatter in the magnitude plot is to be expected since we ignored any color term present in the transformation from the red DSS magnitudes to magnitudes.) The least-squares fit for the calibration relation was , with a scatter of 0.14 magnitudes and scale error of 0.18 magnitudes/magnitude. This is a fairly large scale error; however, the relation given clearly fits the data better than a least-squares fit with the slope forced to 1 (see Figure 14). This relation and the FOCAS total magnitudes were used to derive magnitudes for all of the galaxies in our list; we report these in Table Kinematics of the Hercules Supercluster only to the nearest 0.1mag due to the large scatter of the fit.
References
- Arakelyan et al. (1972) Arakelyan, M., Dibai, E. & Esipov, V. 1972, Astrofizika 8, 33
- Ashman, Bird & Zepf (1994) Ashman, K.A., Bird, C.M., & Zepf, S.E. 1994, AJ, 108, 2348
- Bahcall (1997) Bahcall, N.A., 1997, in “Unsolved Problems in Astrophysics”, ed. J.N. Bahcall & J.P. Ostriker (Princeton: Princeton University Press)
- Bahcall & Soneira (1984) Bahcall, N. & Soneira, R. 1984, ApJ, 277, 27
- Bautz & Morgan (1970) Bautz, L., & Morgan, W.W. 1970, ApJ, 162, L149
- Barrow, Sonoda & Bhavsar (1985) Barrow, J.D., Sonoda, D.H., & Bhavsar, S.P. 1985, MNRAS, 216, 17
- (7) Beers, T.C., Flynn, K., & Gebhardt, K. 1990, AJ, 100, 32
- Beers, Geller & Huchra (1982) Beers, T.C., Geller, M.J., & Huchra, J.P. 1982, ApJ, 257, 323
- Bird, Davis & Beers (1995) Bird, C.M., Davis, D. S., & Beers, T.C. 1995, AJ, 108, 2348
- Bird (1994) Bird, C.M., 1994, AJ, 107, 1637
- Bird, Dickey & Salpeter (1993) Bird, C.M., Dickey, J. M., & Salpeter, E.E. 1993, ApJ, 404, 81
- Bothun et al. (1985) Bothun, G.D., Beers, T.C., Mould, J.R., & Huchra, J.P. 1985, AJ, 90, 2487
- Bothun & Cornell (1990) Bothun, G.D., & Cornell, M.E. 1990, AJ, 99, 1004
- Burns et al. (1987) Burns, J.O., et al. 1987, AJ, 94, 587
- Burns et al. (1994) Burns, J.O., Rhee, G., Owen, F.N., & Pinkney, J. 1994, ApJ, 423, 94
- Burstein & Helies (1984) Burstein, D. & Heiles, C. 1984, ApJS, 54, 33
- Buta & Corwin (1986) Buta, R. & Corwin, 1986, ApJS, 62,283
- Cabranela (1996) Cabranela, J.E., 1996, personal communication
- Carlberg et al. (1996) Carlberg, R.G., et al. 1996, ApJ, 462, 32
- Colless & Dunn (1996) Colless, M. & Dunn, A.M. 1996, ApJ, 458, 435
- Danese, De Zotti & Di Tullio (1980) Danese, L., De Zotti, G., & di Tullio, G. 1980, A&A, 82, 322
- David et al. (1993) David, L., et al. 1993, ApJ, 412, 479
- Davis et al. (1995) Davis, D.S., Bird, C.M., Mushotzky, R.F., & Odewahn, S.C., 1995, ApJ, 440, 48
- Denisyuk et al. (1976) Denisyuk, E., Lipovetskii, V. & Afanasiev, V. 1976, Astrofizika 12, 665
- de Vaucouleurs et al. (1976) de Vaucouleurs, G., de Vaucouleurs, A. & Corwin, H. 1976, “The Second Reference Catalogue of Bright Galaxies” (Austin: University of Texas Press)
- de Vaucouleurs et al. (1991) de Vaucouleurs, G., et al. 1991, “Third Reference Catalogue of Bright Galaxies” (New York: Springer-Verlag)
- Dickey et al. (1987) Dickey, J.M., Keller, D.T., Pennington, R., & Salpeter, E.E. 1987, AJ, 93, 788
- Dickey (1997) Dickey, J.M. 1997, ApJ, in press
- (29) Dressler, A. & Shectman, S. A. 1988a, AJ, 95,284
- (30) Dressler, A. & Shectman, S. A. 1988b, AJ, 95,985
- Ebeling et al. (1996) Ebeling, H. et al. 1996, MNRAS, 281, 799
- Escalera et al. (1994) Escalera, E. et al. 1994, ApJ, 423, 539
- Fabricant et al. (1997) Fabricant, D. et al. 1997, in preparation
- Freudling, Martel & Haynes (1991) Freudling, W., Martel, H. & Haynes, M.P. 1991, ApJ, 377, 349
- Freudling, Haynes, & Giovanelli (1988) Freudling, W., Haynes, M.P., & Giovanelli, R. 1988, AJ, 96, 1791
- Gavazzi & Boselli (1996) Gavazzi, G. & Boselli, A. 1996, Ap. LC, 35, 1
- Giovanardi & Salpeter (1985) Giovanardi, C. & Salpeter, E. 1985, ApJS, 58, 623
- Giovanelli, Chincarini, & Haynes (1981) Giovanelli, R., Chincarini, G.L., & Haynes, M.P. 1981, ApJ, 247, 383
- Giovanelli & Haynes (1981) Giovanelli, R. & Haynes, M.P. 1981a, private communication
- Giovanelli & Haynes (1985) Giovanelli, R. & Haynes, M.P. 1985, ApJ, 292, 404
- Girardi et al. (1996) Girardi, M. et al. 1996, ApJ, 457, 61
- Gott & Turner (1977) Gott, J. R. & Turner, E. L. 1977, ApJ, 213, 309
- Heisler, Tremaine & Bahcall (1985) Heisler, J., Tremaine, S., & Bahcall, J.N. 1985, ApJ, 298, 8
- Henriksen (1992) Henriksen, M. 1992, AJ, 103, 1051
- Henriksen & White (1996) Henriksen, M. & White, R.E. 1996, ApJ, 465, 515
- Hopp et al. (1995) Hopp, U., et al. 1995, A&AS, 109, 537
- Huang & Sarazin (1996) Huang, Z. & Sarazin, C.L. 1996, ApJ, 461, 622
- Huchra & Sargent (1973) Huchra, J. & Sargent, W.L.W. 1973, ApJ, 186, 433
- Huchra (1976) Huchra, J.P. 1976, AJ, 81, 952
- Huchra & Geller (1982) Huchra, J.P. & Geller, M.J. 1982, ApJ, 257, 423
- Huchra et al. (1983) Huchra, J., Davis, M., Latham, D., & Tonry, J. 1983, ApJS, 52, 89
- Huchra (1988) Huchra, J.P. 1988, in “The Extragalactic Distance Scale”, ASP Conf. Ser. #4, ed. S. van den Bergh & C. Pritchet, p.257.
- Huchra (1996) Huchra, J.P. 1996, ZCAT.
- Huchra et al. (1997) Huchra, J.P. et al. 1997, in preparation
- Huchtmeier & Richter (1989) Huchtmeier, W.K. & Richter, O.-G. 1989, “A General Catalogue of HI Observations of Galaxies” (New York: Springer)
- Jain & Dubes (1988) Jain, A.K., & Dubes, R.C. 1988, “Algorithms for Clustering Data” (Englewood Cliffs: Prentice-Hall)
- Kaufmann & Rousseeuw (1990) Kaufmann, L. & Rousseeuw, P.J. 1990, “Finding Groups in Data” (New York: J. Wiley & Sons)
- Kurtz et al. (1992) Kurtz, M.J., et al. 1992, in “Astronomical Data Analysis and Software Systems I”, ed. D.M. Worral, C.Biemesderfer, & J. Barnes.
- Lasker (1991) Lasker, B. M., 1991, in “Digitized Optical Sky Surveys”, ed. H.T. McGillivray & E.B. Thomson (Dordrecht: Kluwer)
- Lauer & Postman (1994) Lauer, T. & Postman, M. 1994, ApJ, 425, 418
- Lawrence (1996) Lawrence, A. 1996, personal communication.
- Leir & van den Bergh (1977) Leir, M. & van den Bergh, S. 1977, ApJS, 34, 381
- Lin et al. (1996) Lin, H. et al. 1996, ApJ, 464, 60
- Lipovetskii & Stepanyan (1986) Lipovetskii, V.A., & Stepanyan, J.A. 1986, “Communications of the Special Astrophysical Observatory, First Byurakan Sky Survey”
- Lugger (1989) Lugger, P.M. 1989, ApJ, 343, 572
- Maccagni, Garilli & Tarenghi (1995) Maccagni, D., Garilli, B., & Tarenghi, M. 1995, AJ, 109, 465
- Mould et al. (1993) Mould, J.R., et al. 1993, ApJ, 409, 14
- Ostriker, Peebles, & Yahil (1974) Ostriker, J.E., Peebles, P.J.E., & Yahil, A. 1974, ApJ, 193, L1
- Oemler (1976) Oemler, A. 1976, ApJ, 209, 693
- Palumbo et al. (1983) Palumbo, G., Tanzella-Nitti, G. & Vettolani, G. 1983, “Catalogue of Radial Velocities of Galaxies”, (New York: Gordon & Breach).
- Pennington et al. (1993) Pennington R. L. et al. 1993, PASP, 105, 521
- Pierce & Tully (1992) Pierce, M.J. & Tully, R.B. 1992, ApJ, 387, 47
- Postman, Geller & Huchra (1988) Postman, M., Geller, M., & Huchra, J. 1988, AJ, 95, 267
- Postman, Geller & Huchra (1992) Postman, M., Geller, M.J., & Huchra, J.P. 1992, ApJ, 384, 404
- Postman & Lauer (1995) Postman, M. & Lauer, T. 1995, ApJ, 440, 28
- Rood (1981) Rood, H. 1981, private communication
- Schombert (1986) Schombert, J. 1986, ApJS, 60, 603
- Schommer et al. (1981) Schommer, R., Sullivan, W., & Bothun, G. 1981, AJ, 86,943
- Schneider et al. (1990) Schneider, S., Thuan, T.X., Magri, C., & Wadiak, J.E. 1990, ApJS, 72, 245
- Scodeggio & Gavazzi (1993) Scodeggio, M. & Gavazzi, G., 1993, ApJ, 409, 110
- Shapley (1934) Shapley, H. 1934, MNRAS, 95, 791
- Small et al. (1998) Small, T.A., Ma, C.-P., Sargent, W.L.W, & Hamilton, D. 1998, ApJ, in press
- Strauss et al. (1992) Strauss, M.A., et al. 1992, ApJS, 83, 29
- Struble & Rood (1982) Struble, M. & Rood, H.J. 1982, AJ, 87,7
- Tarenghi et al. (1979) Tarenghi, M., Chincarini, G., Rood, H.J., & Thompson, L.A. 1979, ApJ, 234, 793
- Tarenghi et al. (1980) Tarenghi, M., Tifft, W.G., Chincarini, G., Rood, H.J., &Thompson, L.A. 1980, ApJ, 235, 724
- Tarenghi, Garilli, & Maccagni (1994) Tarenghi, M., Garilli, B., & Maccagni, D. 1994, AJ, 107, 1629
- Ulrich (1976) Ulrich, M.H. 1976, ApJ, 206, 364
- Valdes (1982) Valdes, F. 1982, in “Instrumentation in Astronomy IV”, SPIE Proceedings, 331
- Weir, Djorgovski & Fayyad (1995) Weir, N., Djorgovski, S., & Fayyad, U., 1995, AJ, 110,1
- West & Bothun (1990) West, M.J. & Bothun, G.D., 1990, ApJ, 327, 1
- White et al. (1983) White, S.D.M., Davis, M., Huchra, J., & Latham, D. 1983, MNRAS, 203, 701
- Zabludoff, Huchra & Geller (1990) Zabludoff, A.I., Huchra, J.P., & Geller, M.J., 1990, ApJS, 74, 1
- (94) Zabludoff, A.I., Geller, M.J., Huchra, J.P., & Vogeley, M.S. 1993a, AJ, 106, 1273
- (95) Zabludoff, A.I., Geller, M.J., Huchra, J.P., & Ramella, M. 1993b, AJ, 106, 1301
- Zabludoff & Franx (1993) Zabludoff, A.I., & Franx, M. 1993, AJ, 106, 1314
| Name | (J2000) | (J2000) | type | velocity source | |||
|---|---|---|---|---|---|---|---|
| 15535+1826 | 15 55 43.07 | 18 16 57.29 | 14.8 | 5327 | 22 | S | * |
| 15541+1640 | 15 56 23.71 | 16 31 19.99 | 13.1 | 4630 | 71 | E | (21) |
| 1554+1847B | 15 56 56.00 | 18 38 20.00 | 15.1 | 18138 | 100 | E | (13) |
| 1554+1847A | 15 56 58.99 | 18 38 34.98 | 14.1 | 18138 | 100 | S | (13) |
| 15548+1746 | 15 57 04.25 | 17 37 31.80 | 14.7 | 11086 | 40 | S | * |
| 15548+1819 | 15 57 04.39 | 18 11 12.01 | 14.3 | 9545 | 100 | E | (24) |
| N6018 | 15 57 29.84 | 15 52 22.12 | 12.8 | 5218 | 25 | S | (17) |
| N6021 | 15 57 30.74 | 15 57 21.17 | 12.7 | 4738 | 25 | E | (17) |
| 15553+1810 | 15 57 35.39 | 18 01 32.55 | 14.3 | 9429 | 20 | S | (6) |
| 15553+1617 | 15 57 36.76 | 16 08 02.22 | 14.6 | 10667 | 26 | S | * |
| 15554+1820 | 15 57 40.39 | 18 11 17.99 | 15.1 | 14433 | 39 | S | * |
| 15554+1616 | 15 57 40.50 | 16 07 30.14 | 15.6 | 11173 | 21 | S | * |
| 15554+1621 | 15 57 42.91 | 16 13 03.00 | 14.9 | 10120 | 100 | S | (13) |
| 15555+1631 | 15 57 46.47 | 16 22 24.24 | 15.1 | 10850 | 24 | S | * |
| N6022 | 15 57 47.70 | 16 16 56.24 | 14.8 | 11225 | 100 | S | (24) |
| N6023 | 15 57 49.64 | 16 18 35.39 | 12.7 | 11140 | 150 | E | (1) |
| CGCG108-023 | 15 57 51.99 | 16 21 40.00 | 15.4 | 13500 | 51 | S | (2) |
| 15557+1505 | 15 58 01.99 | 14 57 40.00 | 14.7 | 11275 | 100 | S | (25) |
| 15557+1629 | 15 58 03.00 | 16 20 44.99 | 13.8 | 10853 | 20 | S | (7) |
| 15558+1528 | 15 58 04.48 | 15 18 59.47 | 14.5 | 11247 | 44 | E | * |
| 15559+1815 | 15 58 06.78 | 18 06 51.23 | 14.7 | 13668 | 46 | E | * |
| 15559+1745 | 15 58 14.45 | 17 36 10.08 | 14.9 | 11135 | 24 | S | * |
| 15560+1629 | 15 58 18.26 | 16 20 18.10 | 15.4 | 11485 | 42 | S | * |
| 15561+1813 | 15 58 20.49 | 18 04 50.88 | 14.2 | 13668 | 48 | S | * |
| CGCG108-027 | 15 58 26.22 | 18 02 21.73 | 14.3 | 12642 | 39 | S | (28) |
| I1151 | 15 58 31.98 | 17 26 35.05 | 12.8 | 2169 | 5 | S | (9) |
| 15563+1801 | 15 58 32.41 | 17 52 17.04 | 14.4 | 14345 | 41 | S | * |
| A1556+1712 | 15 58 35.98 | 17 04 17.29 | 15.1 | 13115 | 32 | E | (22) |
| 15566+1920 | 15 58 47.25 | 19 11 41.57 | 14.8 | 8717 | 31 | S | * |
| A1556+1808 | 15 58 47.71 | 17 59 15.00 | 15.5 | 13445 | 410 | E | (22) |
| 15565+1505 | 15 58 49.58 | 14 58 05.09 | 14.3 | 10690 | 71 | E | (21) |
| A1556+1712 | 15 58 52.50 | 17 03 50.01 | 15.3 | 17681 | 113 | E | (22) |
| 15566+1506 | 15 58 54.05 | 14 58 53.36 | 14.3 | 10527 | 100 | S | (13) |
| 15568+1503 | 15 59 04.99 | 14 55 35.00 | 14.1 | 12711 | 20 | S | (7) |
| 15570+1518 | 15 59 15.72 | 15 10 35.72 | 14.2 | 12774 | 71 | S | (21) |
| 15571+1851 | 15 59 19.43 | 18 42 03.60 | 14.9 | 13927 | 40 | S | * |
| A1557+1517 | 15 59 21.08 | 15 08 20.00 | 15.7 | 12840 | 100 | S | (22) |
| 15573+1807 | 15 59 34.19 | 17 58 11.75 | 15.0 | 11028 | 25 | E | * |
| 15574+1921 | 15 59 36.24 | 19 12 52.02 | 15.1 | 10578 | 35 | E | * |
| A1557+1852 | 15 59 44.20 | 18 43 59.99 | 16.7 | 8972 | 100 | E | (14) |
| 15575+1856 | 15 59 45.71 | 18 48 02.02 | 13.1 | 8961 | 100 | S | (24) |
| 15576+1544 | 15 59 58.67 | 15 35 28.46 | 14.0 | 10099 | 10 | S | (8) |
| 15579+1827 | 16 00 07.87 | 18 19 00.81 | 14.6 | 10755 | 31 | S | * |
| 15579+1831 | 16 00 09.58 | 18 23 03.12 | 14.8 | 18428 | 33 | E | * |
| 15580+1831 | 16 00 14.76 | 18 22 33.85 | 14.8 | 18094 | 40 | S | * |
| 15580+1617S | 16 00 15.99 | 16 08 34.98 | 17.1 | 9990 | 100 | S | (13) |
| 15580+1617N | 16 00 16.71 | 16 08 39.98 | 15.5 | 9914 | 100 | S | (13) |
| 15580+1554 | 16 00 17.75 | 15 45 23.65 | 14.4 | 4782 | 100 | E | (13) |
| 15581+1935 | 16 00 20.95 | 19 26 25.58 | 14.6 | 13827 | 28 | E | * |
| 15582+1646 | 16 00 26.60 | 16 37 36.23 | 15.3 | 10300 | 20 | E | (6) |
| A1558+1810 | 16 00 26.79 | 18 02 07.01 | 14.9 | 13913 | 233 | S | (22) |
| 15582+1824 | 16 00 27.80 | 18 15 49.29 | 15.1 | 10683 | 27 | S | * |
| 15583+1900 | 16 00 29.06 | 18 51 07.38 | 14.9 | 10671 | 26 | E | * |
| I1155 | 16 00 35.71 | 15 41 07.80 | 13.7 | 10629 | 15 | S | (20) |
| 15584+1649 | 16 00 37.73 | 16 40 12.93 | 14.8 | 10586 | 38 | S | * |
| 15584+1651 | 16 00 43.20 | 16 42 55.01 | 14.6 | 10653 | 20 | E | (6) |
| 15585+1626 | 16 00 44.13 | 16 17 08.12 | 14.7 | 10216 | 28 | S | * |
| 15581+1813 | 16 00 47.30 | 18 04 40.01 | 14.4 | 13155 | 100 | S | (25) |
| 15586+1904 | 16 00 49.21 | 18 55 43.00 | 16.7 | 9437 | 100 | E | (13) |
| 15585+1517 | 16 00 51.48 | 15 09 04.75 | 14.2 | 10156 | 20 | S | (6) |
| 15586+1741 | 16 00 52.27 | 17 32 43.87 | 13.9 | 13349 | 100 | S | (13) |
| 15586+1628S | 16 00 53.71 | 16 20 08.02 | 13.9 | 12382 | 71 | E | (21) |
| A1558+1631 | 16 00 54.40 | 16 20 44.02 | 16.3 | 43000 | 100 | S | (13) |
| 15586+1628N | 16 00 54.79 | 16 20 42.00 | 14.7 | 13109 | 52 | S | (21) |
| 15586+1540 | 16 00 56.40 | 15 31 33.60 | 14.1 | 11567 | 104 | S | * |
| 15587+1845 | 16 00 56.98 | 18 36 52.09 | 14.3 | 10477 | 38 | E | * |
| 15587+1534 | 16 01 01.52 | 15 25 11.78 | 14.2 | 10323 | 75 | S | * |
| I1160 | 16 01 02.50 | 15 29 40.45 | 14.9 | 10970 | 100 | S | (13) |
| 15589+1655 | 16 01 10.32 | 16 47 08.20 | 14.9 | 10638 | 43 | E | * |
| 15589+1554 | 16 01 12.36 | 15 45 21.78 | 15.0 | 11369 | 52 | S | * |
| 15590+1550 | 16 01 14.45 | 15 41 19.21 | 14.8 | 10750 | 28 | S | * |
| I1162 | 16 01 16.29 | 17 40 40.41 | 14.5 | 13273 | 100 | S | (13) |
| 15590+1754 | 16 01 16.50 | 17 46 00.01 | 14.5 | 10378 | 100 | S | (13) |
| I1161 | 16 01 16.90 | 15 38 39.98 | 14.1 | 10852 | 100 | E | (13) |
| 15591+1704 | 16 01 19.34 | 16 55 49.04 | 14.9 | 10801 | 49 | S | * |
| 15590+1627 | 16 01 21.29 | 16 18 20.01 | 13.5 | 11282 | 100 | S | (13) |
| 15591+1649 | 16 01 21.68 | 16 40 30.00 | 13.8 | 9473 | 71 | S | (21) |
| 15591+1621 | 16 01 23.13 | 16 13 04.80 | 14.7 | 8566 | 100 | S | (21) |
| 15592+1914 | 16 01 25.71 | 19 06 05.80 | 15.1 | 12431 | 44 | E | * |
| 15592+1704 | 16 01 27.30 | 16 55 10.96 | 14.7 | 10464 | 33 | S | * |
| 15592+1723 | 16 01 27.99 | 17 14 21.99 | 14.2 | 10765 | 100 | E | (13) |
| A1559+1809 | 16 01 28.81 | 18 01 04.22 | 14.5 | 11053 | 89 | S | (22) |
| N6028 | 16 01 28.89 | 19 20 30.01 | 13.0 | 4475 | 20 | S | (13) |
| 15592+1653 | 16 01 30.00 | 16 45 20.23 | 14.3 | 9598 | 100 | E | (13) |
| I1163 | 16 01 30.47 | 15 30 14.25 | 13.7 | 10503 | 71 | E | (21) |
| 15592+1558 | 16 01 32.02 | 15 49 49.94 | 15.0 | 11474 | 23 | E | * |
| 15593+1632 | 16 01 32.70 | 16 23 33.93 | 15.3 | 8753 | 32 | E | * |
| A1559+1645A | 16 01 36.37 | 16 36 40.64 | 18.1 | 4904 | 233 | S | (22) |
| A1559+1645B | 16 01 36.37 | 16 36 40.64 | 17.4 | 12669 | 194 | E | (22) |
| 15593+1634 | 16 01 36.77 | 16 25 52.68 | 14.3 | 12727 | 20 | S | (6) |
| 15594+1627 | 16 01 39.43 | 16 18 36.97 | 15.0 | 8704 | 23 | S | * |
| 15594+1805 | 16 01 41.36 | 17 57 03.31 | 15.1 | 4242 | 56 | S | * |
| 15595+1558 | 16 01 46.88 | 15 49 19.52 | 15.1 | 11551 | 27 | S | * |
| 15596+1853 | 16 01 49.29 | 18 43 14.56 | 16.9 | 2627 | 40 | S | (10) |
| A1559+1746 | 16 01 49.62 | 17 38 26.52 | 15.1 | 10736 | 20 | S | (12) |
| 15596+1808 | 16 01 50.91 | 17 59 43.08 | 14.9 | 14198 | 64 | S | * |
| N6030 | 16 01 51.46 | 17 57 25.64 | 12.6 | 4491 | 25 | E | (16) |
| 15596+1556 | 16 01 51.96 | 15 47 32.68 | 14.5 | 12406 | 46 | S | * |
| 15597+1635N | 16 01 54.91 | 16 27 15.01 | 14.5 | 10589 | 100 | E | (13) |
| KUG1559+158 | 16 01 55.83 | 15 42 28.83 | 15.2 | 10423 | 100 | S | (31) |
| 1559+1634 | 16 02 01.75 | 16 26 07.26 | 14.9 | 9120 | 70 | E | (4) |
| 15597+1635S | 16 02 01.89 | 16 27 05.00 | 14.9 | 9112 | 100 | E | (13) |
| A1559+1653 | 16 02 01.89 | 16 45 24.99 | 16.0 | 9662 | 122 | E | (22) |
| 15598+1857 | 16 02 02.08 | 18 49 00.33 | 15.5 | 2520 | 45 | E | (3) |
| 15598+1713 | 16 02 04.23 | 17 04 33.42 | 13.6 | 11036 | 71 | E | (21) |
| I1165N | 16 02 07.98 | 15 41 44.99 | 15.6 | 14898 | 96 | S | (2) |
| I1165S | 16 02 08.49 | 15 41 31.99 | 16.3 | 10122 | 59 | S | (2) |
| 15599+1602 | 16 02 09.13 | 15 53 16.84 | 14.8 | 9027 | 54 | S | * |
| 15599+1657 | 16 02 12.67 | 16 48 27.36 | 15.9 | 10044 | 55 | S | * |
| 16000+1606S | 16 02 12.69 | 15 54 26.93 | 14.3 | 10489 | 36 | E | (1) |
| 15599+1634 | 16 02 12.95 | 16 25 33.96 | 14.4 | 9276 | 100 | S | (13) |
| 16000+1606N | 16 02 13.16 | 15 56 14.97 | 14.3 | 13178 | 39 | S | (1) |
| 1600+1609B | 16 02 14.00 | 16 01 11.03 | 15.7 | 10256 | 100 | E | (13) |
| 47-166 | 16 02 16.19 | 16 04 40.84 | 20.8 | 9849 | 100 | S | (31) |
| 16000+1606 | 16 02 16.94 | 15 58 29.21 | 12.8 | 10384 | 36 | E | (1) |
| 1600+1609A | 16 02 17.56 | 16 00 10.22 | 15.7 | 10121 | 100 | E | (13) |
| 16000+1630 | 16 02 18.02 | 16 21 58.28 | 14.8 | 12054 | 232 | S | (21) |
| 16000+1629 | 16 02 19.82 | 16 20 44.37 | 12.6 | 11449 | 232 | E | (21) |
| 16001+1536 | 16 02 21.06 | 15 27 52.52 | 14.9 | 10424 | 32 | S | * |
| 16001+1601 | 16 02 21.10 | 15 52 41.05 | 15.6 | 10483 | 28 | S | * |
| 1600+1451 | 16 02 21.30 | 14 42 40.00 | 15.0 | 10812 | 100 | S | (27) |
| 16000+1617 | 16 02 21.52 | 16 09 32.51 | 14.7 | 12894 | 232 | S | (21) |
| 16001+1816 | 16 02 22.63 | 18 07 44.22 | 15.1 | 18572 | 43 | S | * |
| 1600+1824 | 16 02 24.47 | 18 15 58.75 | 14.3 | 13682 | 50 | E | (23) |
| 16002+1632 | 16 02 29.67 | 16 24 10.40 | 14.5 | 11507 | 27 | S | * |
| 16003+2019 | 16 02 30.40 | 20 10 34.71 | 14.8 | 25575 | 44 | S | * |
| 16002+1442 | 16 02 32.82 | 14 33 17.93 | 14.6 | 10241 | 28 | E | * |
| 47-138 | 16 02 34.78 | 15 44 59.82 | 17.4 | 11284 | 100 | S | (31) |
| 16003+1637 | 16 02 36.17 | 16 28 49.94 | 15.3 | 10543 | 47 | E | * |
| 16005+1937 | 16 02 40.19 | 19 29 12.48 | 15.6 | 12338 | 21 | E | * |
| 16004+1809 | 16 02 40.22 | 18 00 24.22 | 14.4 | 18498 | 33 | S | * |
| A1600+1553 | 16 02 40.49 | 15 45 20.02 | 14.2 | 11020 | 251 | E | (22) |
| 16004+1607 | 16 02 40.51 | 15 58 59.81 | 15.8 | 10097 | 28 | E | * |
| 1600+1649 | 16 02 43.30 | 16 40 06.99 | 15.8 | 33338 | 100 | S | (13) |
| 16005+1855 | 16 02 44.44 | 18 46 54.55 | 15.4 | 9375 | 30 | S | * |
| 16004+1508 | 16 02 44.55 | 14 59 47.22 | 15.4 | 43036 | 68 | S | * |
| 16005+1623 | 16 02 45.08 | 16 14 53.59 | 14.8 | 10571 | 30 | E | * |
| 1600+1525 | 16 02 45.67 | 15 16 48.00 | 16.0 | 9252 | 100 | E | (14) |
| 16005+1652 | 16 02 48.02 | 16 43 23.20 | 15.1 | 10282 | 40 | E | * |
| 16004+1615 | 16 02 48.55 | 16 07 09.19 | 14.1 | 9933 | 100 | E | (13) |
| 1600+1718 | 16 02 49.09 | 17 10 05.27 | 14.5 | 10399 | 50 | S | (23) |
| 1600+1834 | 16 02 49.88 | 18 26 40.38 | 15.6 | 12252 | 20 | S | (12) |
| 16006+1642 | 16 02 50.35 | 16 34 11.32 | 13.7 | 10470 | 100 | E | (13) |
| 1600+1605 | 16 02 50.93 | 15 57 36.36 | 16.0 | 10465 | 70 | E | (4) |
| 16006+1540 | 16 02 51.92 | 15 31 48.79 | 15.0 | 17509 | 28 | E | * |
| 16006+1528 | 16 02 54.66 | 15 20 08.77 | 15.1 | 10095 | 21 | E | * |
| 16007+1912 | 16 02 55.29 | 19 03 48.92 | 16.5 | 13946 | 47 | S | * |
| 16007+1905 | 16 02 57.40 | 18 56 49.35 | 15.6 | 14013 | 28 | S | * |
| 16007+1559 | 16 02 58.74 | 15 50 33.83 | 13.8 | 9704 | 100 | S | (13) |
| 16007+1615 | 16 03 00.56 | 16 07 09.48 | 15.0 | 11974 | 32 | S | * |
| 16007+1614 | 16 03 01.08 | 16 05 45.67 | 14.9 | 11481 | 50 | S | * |
| 16008+1536 | 16 03 03.67 | 15 27 35.53 | 16.1 | 10428 | 40 | S | * |
| 16008+1919 | 16 03 04.07 | 19 10 55.99 | 15.1 | 14024 | 28 | S | * |
| 16008+1624 | 16 03 05.28 | 16 16 01.56 | 15.5 | 10963 | 29 | S | * |
| A2151:[D80]008 | 16 03 05.78 | 17 10 14.44 | 16.4 | 10093 | 100 | S | (31) |
| 16009+1617 | 16 03 09.82 | 16 08 19.86 | 15.0 | 12460 | 31 | E | * |
| 16009+1559 | 16 03 12.81 | 15 50 54.53 | 14.9 | 11649 | 21 | E | * |
| 16009+1502 | 16 03 13.48 | 14 53 39.44 | 15.3 | 10907 | 31 | E | * |
| 1600+1730 | 16 03 14.04 | 17 22 02.86 | 14.8 | 10155 | 50 | E | (23) |
| 16010+1632 | 16 03 14.73 | 16 24 09.87 | 13.8 | 10966 | 100 | S | (13) |
| 16010+1913 | 16 03 15.87 | 19 05 02.83 | 15.4 | 14111 | 46 | S | * |
| 1601+1756 | 16 03 16.06 | 17 47 47.01 | 14.8 | 11268 | 20 | E | (12) |
| 16011+1752 | 16 03 18.26 | 17 43 57.14 | 15.5 | 10507 | 50 | E | * |
| A1601+1508 | 16 03 22.11 | 15 00 24.98 | 16.6 | 16908 | 203 | S | (22) |
| 1601+1711 | 16 03 23.01 | 17 03 23.01 | 16.3 | 11666 | 50 | S | (23) |
| 16012+1918 | 16 03 26.71 | 19 09 37.73 | 14.4 | 4684 | 8 | S | (11) |
| A1601+1919 | 16 03 26.82 | 19 10 47.75 | 15.8 | 11820 | 89 | E | * |
| 1601+1734 | 16 03 27.76 | 17 25 58.73 | 16.5 | 11932 | 50 | S | (23) |
| N6034 | 16 03 32.04 | 17 11 55.00 | 13.5 | 10112 | 100 | E | (13) |
| 16012+1542 | 16 03 32.26 | 15 34 05.74 | 14.6 | 12399 | 44 | S | * |
| 1601+1736 | 16 03 32.43 | 17 28 47.03 | 14.8 | 13451 | 40 | S | (23) |
| 16012+1628 | 16 03 32.80 | 16 19 23.01 | 13.3 | 11497 | 100 | E | (13) |
| 47-030 | 16 03 35.14 | 15 52 32.34 | 15.3 | 10147 | 100 | S | (31) |
| 16013+1608 | 16 03 37.47 | 15 59 23.10 | 15.5 | 11171 | 36 | E | * |
| 1601+1602 | 16 03 38.02 | 15 54 01.01 | 15.3 | 32821 | 201 | S | (13) |
| 16014+1547 | 16 03 38.59 | 15 38 43.83 | 15.0 | 11116 | 49 | S | * |
| A2151:[D80]006 | 16 03 38.95 | 17 11 05.42 | 16.1 | 10217 | 45 | E | (23) |
| 16014+1459 | 16 03 39.71 | 14 50 58.78 | 14.5 | 11072 | 33 | S | * |
| 1601+1728 | 16 03 40.46 | 17 20 16.55 | 15.6 | 12873 | 50 | E | (23) |
| 16014+1637 | 16 03 41.61 | 16 28 32.09 | 14.8 | 32239 | 29 | S | * |
| 16014+1637 | 16 03 41.69 | 16 28 30.07 | 14.8 | 11908 | 32 | S | * |
| 16014+1605 | 16 03 42.78 | 15 57 16.85 | 16.9 | 11935 | 25 | E | * |
| 16014+1628W | 16 03 43.70 | 16 19 35.00 | 14.3 | 10645 | 100 | S | (13) |
| 1601+1555 | 16 03 43.81 | 15 47 21.98 | 16.3 | 10185 | 200 | E | (15) |
| DKP160130.51+18032 | 16 03 45.32 | 17 55 11.86 | 15.9 | 33859 | 200 | S | (30) |
| 16014+1628E | 16 03 45.79 | 16 20 12.01 | 15.2 | 10645 | 100 | E | (13) |
| 16015+1723 | 16 03 48.06 | 17 14 26.02 | 13.8 | 10953 | 100 | S | (13) |
| 16016+1605 | 16 03 50.15 | 15 56 42.69 | 14.6 | 11059 | 47 | E | * |
| 16016+1553 | 16 03 50.42 | 15 44 52.83 | 15.0 | 9256 | 27 | S | * |
| 16016+1505 | 16 03 52.85 | 14 56 46.57 | 14.7 | 10261 | 34 | E | * |
| 16016+1432 | 16 03 52.88 | 14 23 49.35 | 15.0 | 10193 | 26 | S | * |
| 16017+1913 | 16 03 53.74 | 19 04 30.15 | 15.7 | 34032 | 37 | S | * |
| 16016+1502 | 16 03 55.64 | 14 54 09.03 | 14.4 | 10919 | 29 | S | * |
| 16016+1506 | 16 03 55.81 | 14 57 24.34 | 14.7 | 10924 | 26 | S | * |
| 16016+1502 | 16 03 56.22 | 14 53 39.95 | 15.9 | 10681 | 28 | E | * |
| A2151:[D80]016 | 16 03 56.59 | 17 18 18.58 | 15.4 | 10023 | 33 | E | (23) |
| 16016+1630 | 16 03 57.13 | 16 21 42.59 | 14.5 | 11592 | 100 | E | (13) |
| 16016+1608 | 16 03 57.96 | 16 00 01.62 | 13.8 | 9577 | 100 | S | (13) |
| 1601+1741 | 16 04 00.30 | 17 33 15.80 | 16.5 | 33709 | 50 | E | (23) |
| sw-103 | 16 04 00.56 | 17 15 12.81 | 19.0 | 11021 | 100 | S | (31) |
| 16018+1725 | 16 04 02.71 | 17 16 55.95 | 14.2 | 9908 | 100 | E | (13) |
| 1601+1743 | 16 04 07.28 | 17 34 54.26 | 15.7 | 11548 | 50 | S | (23) |
| A2151:[D80]005 | 16 04 10.12 | 17 12 24.91 | 16.4 | 10446 | 100 | S | (31) |
| 1601+1807 | 16 04 10.13 | 17 58 52.46 | 15.4 | 11616 | 50 | S | (23) |
| 16019+1613 | 16 04 10.41 | 16 05 15.18 | 14.7 | 10397 | 30 | S | * |
| 16019+1618 | 16 04 13.22 | 16 09 49.39 | 15.3 | 11826 | 35 | S | * |
| 16020+1636 | 16 04 15.89 | 16 27 36.36 | 15.0 | 12786 | 38 | S | * |
| 16020+1534 | 16 04 16.19 | 15 25 31.22 | 15.1 | 9225 | 25 | S | * |
| 16020+1614 | 16 04 16.76 | 16 05 41.61 | 15.1 | 13464 | 24 | S | * |
| 16020+1614 | 16 04 16.93 | 16 05 40.56 | 15.1 | 13549 | 24 | S | * |
| ne-398 | 16 04 18.03 | 18 14 06.36 | 19.5 | 10602 | 100 | S | (31) |
| 1602+1719 | 16 04 19.52 | 17 10 51.02 | 14.6 | 10217 | 50 | E | (23) |
| A2151:[D80]025 | 16 04 20.14 | 17 26 10.07 | 15.5 | 10805 | 100 | S | (23) |
| 16021+1648 | 16 04 20.23 | 16 39 48.63 | 15.2 | 13591 | 42 | E | * |
| H186=798932 | 16 04 21.05 | 18 08 24.54 | 15.9 | 10868 | 100 | S | (31) |
| 16021+1647 | 16 04 22.33 | 16 38 30.98 | 15.1 | 13870 | 35 | E | * |
| 1602+1800 | 16 04 22.94 | 17 52 41.27 | 14.9 | 11170 | 50 | E | (23) |
| 16021+1650 | 16 04 23.01 | 16 41 52.01 | 15.2 | 9366 | 100 | S | (24) |
| 16022+2009 | 16 04 26.65 | 20 00 32.40 | 15.4 | 10024 | 43 | S | * |
| N6040N | 16 04 26.69 | 17 44 54.99 | 14.0 | 12404 | 100 | S | (13) |
| N6040S | 16 04 26.69 | 17 44 30.01 | 14.0 | 12612 | 100 | E | (13) |
| 16021+1455 | 16 04 28.20 | 14 46 53.00 | 13.9 | 4702 | 49 | S | (16) |
| 1602+1747 | 16 04 28.77 | 17 38 54.64 | 15.6 | 11354 | 50 | E | (23) |
| 16022+1736 | 16 04 30.72 | 17 28 07.00 | 14.7 | 11987 | 100 | S | (24) |
| 16022+1457 | 16 04 31.62 | 14 49 07.72 | 13.9 | 4616 | 34 | E | * |
| I1170 | 16 04 31.80 | 17 43 16.82 | 15.4 | 9587 | 100 | E | (13) |
| 16023+1649 | 16 04 32.38 | 16 40 30.22 | 15.2 | 9622 | 35 | S | * |
| 16023+1637S | 16 04 34.39 | 16 28 51.93 | 15.4 | 11795 | 100 | S | (13) |
| 16023+1637N | 16 04 34.39 | 16 28 51.93 | 14.0 | 13527 | 100 | S | (13) |
| 1602+1827 | 16 04 34.50 | 18 18 54.00 | 16.1 | 10840 | 50 | E | (23) |
| N6041B | 16 04 35.00 | 17 43 00.01 | 20.2 | 11248 | 100 | E | (13) |
| 16023+1701 | 16 04 35.61 | 16 54 10.04 | 13.7 | 9222 | 100 | E | (13) |
| N6041A | 16 04 36.01 | 17 43 45.01 | 12.4 | 10272 | 100 | E | (13) |
| 16024+1758 | 16 04 37.80 | 17 50 09.31 | 14.9 | 21267 | 42 | S | * |
| N6042 | 16 04 39.61 | 17 42 02.30 | 13.8 | 10430 | 100 | E | (13) |
| 1602+1810 | 16 04 40.04 | 18 01 56.35 | 15.7 | 11259 | 50 | S | (23) |
| 16024+1503 | 16 04 40.80 | 14 54 50.36 | 15.0 | 10874 | 31 | S | * |
| 16024+1634 | 16 04 41.05 | 16 25 47.35 | 14.2 | 9989 | 100 | E | (13) |
| 16024+1647 | 16 04 41.42 | 16 38 59.10 | 15.2 | 13581 | 52 | E | * |
| 16024+1639 | 16 04 42.05 | 16 30 40.93 | 15.5 | 10855 | 36 | E | * |
| A2151:[BO85]064 | 16 04 42.24 | 17 41 00.46 | 15.8 | 10430 | 100 | S | (30) |
| A2151:[D80]051 | 16 04 42.78 | 17 38 19.50 | 15.3 | 10112 | 100 | S | (30) |
| 16025+1639 | 16 04 43.70 | 16 31 20.86 | 14.8 | 13605 | 22 | E | * |
| 16025+1735 | 16 04 45.30 | 17 26 51.68 | 14.6 | 10413 | 100 | E | (24) |
| 1602+1728 | 16 04 47.50 | 17 20 50.82 | 15.3 | 10610 | 100 | S | (25) |
| 16025+1701 | 16 04 48.43 | 16 53 01.86 | 14.5 | 12553 | 100 | S | (13) |
| 1602+1746 | 16 04 49.08 | 17 38 38.90 | 16.1 | 11462 | 50 | E | (23) |
| 16025+1643 | 16 04 49.98 | 16 35 01.00 | 14.2 | 9347 | 71 | S | (21) |
| 16025+1552 | 16 04 51.71 | 15 43 23.01 | 13.6 | 10670 | 100 | E | (13) |
| 16027+1642 | 16 04 57.01 | 16 34 06.60 | 15.4 | 13415 | 33 | S | * |
| 1602+1819 | 16 04 58.40 | 18 11 15.00 | 15.8 | 11355 | 20 | S | (12) |
| 16027+1657 | 16 04 58.62 | 16 48 34.42 | 14.8 | 12957 | 27 | S | * |
| N6044 | 16 04 59.81 | 17 52 11.60 | 13.9 | 9936 | 50 | E | (24) |
| N6043E | 16 05 01.50 | 17 46 30.00 | 14.0 | 9798 | 100 | E | (13) |
| A2151:[D80]092 | 16 05 01.86 | 17 49 50.73 | 15.4 | 10796 | 45 | S | (23) |
| DKP160249.30+17570 | 16 05 04.16 | 17 49 02.89 | 15.4 | 10433 | 200 | S | (12) |
| 16028+1641 | 16 05 04.54 | 16 32 43.26 | 14.8 | 13649 | 36 | S | * |
| ce-200 | 16 05 06.66 | 17 47 00.42 | 18.2 | 9927 | 100 | S | (31) |
| 16028+1644 | 16 05 07.01 | 16 35 45.17 | 14.9 | 14011 | 33 | S | * |
| 1602+1747 | 16 05 07.05 | 17 38 56.08 | 15.8 | 10186 | 100 | S | (23) |
| 16029+1642 | 16 05 07.28 | 16 34 13.22 | 18.4 | 13334 | 39 | E | * |
| N6045 | 16 05 07.84 | 17 45 27.11 | 14.0 | 9913 | 41 | S | (1) |
| A2151:[BO85]137 | 16 05 08.09 | 17 48 55.11 | 17.1 | 13683 | 100 | S | (12) |
| N6047 | 16 05 08.95 | 17 43 47.17 | 13.7 | 9470 | 50 | E | (1) |
| A2151:[BO85]119 | 16 05 09.90 | 17 51 20.16 | 17.1 | 9905 | 100 | S | (31) |
| I1173 | 16 05 12.70 | 17 25 22.40 | 14.0 | 10871 | 100 | S | (24) |
| A2151:[BO85]053 | 16 05 14.57 | 17 48 02.70 | 15.9 | 4923 | 100 | S | (30) |
| 16030+1604 | 16 05 15.18 | 15 55 32.38 | 14.2 | 13361 | 58 | S | * |
| 1603+1740 | 16 05 15.36 | 17 32 22.60 | 15.0 | 12299 | 50 | S | (23) |
| A2151:[D80]061 | 16 05 15.80 | 17 42 29.62 | 15.5 | 9432 | 45 | E | (23) |
| 1603+1830 | 16 05 16.01 | 18 21 59.00 | 15.9 | 10926 | 50 | S | (23) |
| 16030+1518 | 16 05 18.44 | 15 09 59.18 | 16.2 | 4802 | 24 | E | * |
| 1603+1747 | 16 05 18.64 | 17 39 19.80 | 16.5 | 9493 | 50 | E | (23) |
| A2151:[D80]091 | 16 05 20.59 | 17 52 01.74 | 17.7 | 11587 | 100 | S | (31) |
| N6050 | 16 05 20.90 | 17 45 54.94 | 14.5 | 9511 | 100 | S | (24) |
| I1179 | 16 05 20.90 | 17 45 54.94 | 16.3 | 11049 | 100 | S | (24) |
| 16031+1552 | 16 05 21.10 | 15 44 15.40 | 15.3 | 10652 | 22 | E | * |
| 16031+1614 | 16 05 21.14 | 16 06 15.41 | 15.3 | 10932 | 27 | S | * |
| 16031+1607 | 16 05 21.34 | 15 58 37.71 | 15.4 | 13055 | 30 | E | * |
| 16031+1633 | 16 05 21.98 | 16 24 36.47 | 15.2 | 13329 | 42 | E | * |
| A2151:[D80]102 | 16 05 21.98 | 17 58 13.04 | 15.8 | 11851 | 45 | E | (23) |
| 1603+1759 | 16 05 22.59 | 17 51 17.06 | 14.9 | 10834 | 50 | S | (23) |
| 16031+1620 | 16 05 22.67 | 16 11 53.01 | 14.5 | 10088 | 71 | E | (21) |
| CGCG108-115 | 16 05 22.99 | 14 38 49.99 | 13.9 | 14117 | 69 | S | (2) |
| 1603+1816 | 16 05 23.50 | 18 08 31.13 | 16.4 | 11220 | 100 | E | (24) |
| 16031+1446 | 16 05 23.78 | 14 38 52.01 | 13.9 | 12228 | 71 | S | (21) |
| 16031+1619 | 16 05 24.11 | 16 10 27.44 | 14.5 | 14003 | 32 | S | * |
| 16031+1531 | 16 05 24.52 | 15 22 32.99 | 15.8 | 12617 | 25 | S | * |
| 16032+1751 | 16 05 26.38 | 17 41 49.30 | 15.7 | 11070 | 100 | S | (27) |
| 16032+1635N | 16 05 26.49 | 16 26 30.01 | 14.7 | 13598 | 100 | S | (13) |
| MCG+03-41-096 | 16 05 26.55 | 17 54 36.32 | 14.4 | 12308 | 37 | S | (23) |
| I1174 | 16 05 26.66 | 15 01 35.22 | 13.0 | 4706 | 26 | S | (16) |
| I1181 | 16 05 27.10 | 17 35 55.35 | 14.0 | 10252 | 71 | E | (21) |
| A2151:[D80]090 | 16 05 27.63 | 17 49 48.36 | 13.8 | 10253 | 45 | S | (23) |
| 1603+1828 | 16 05 27.67 | 18 20 26.41 | 15.4 | 11550 | 50 | S | (23) |
| 16032+1635S | 16 05 29.29 | 16 26 04.99 | 13.9 | 13271 | 100 | S | (13) |
| A2151:[D80]097 | 16 05 29.33 | 17 55 42.49 | 15.1 | 11905 | 45 | S | (23) |
| A1603+1748 | 16 05 29.69 | 17 40 50.52 | 14.7 | 11086 | 20 | E | (12) |
| 16033+1933 | 16 05 29.74 | 19 24 34.09 | 15.2 | 28680 | 57 | E | * |
| 16032+1530 | 16 05 30.17 | 15 22 25.18 | 15.6 | 10558 | 28 | E | * |
| 16033+2010 | 16 05 30.44 | 20 01 40.26 | 15.4 | 9293 | 36 | E | * |
| N6054 | 16 05 30.92 | 17 46 13.58 | 14.8 | 11177 | 40 | S | (20) |
| N6056 | 16 05 31.20 | 17 57 48.60 | 13.4 | 11701 | 138 | E | (21) |
| N6055 | 16 05 32.57 | 18 09 33.70 | 13.5 | 11315 | 100 | E | (21) |
| I1178 | 16 05 33.00 | 17 36 05.01 | 12.9 | 10200 | 71 | E | (21) |
| 16033+1630 | 16 05 33.35 | 16 22 00.30 | 16.0 | 13516 | 30 | E | * |
| 16033+1744 | 16 05 33.82 | 17 35 35.96 | 14.7 | 10192 | 26 | S | * |
| 16033+1640 | 16 05 35.81 | 16 31 33.46 | 14.8 | 4630 | 36 | S | * |
| 16033+1825 | 16 05 36.52 | 18 16 21.97 | 14.2 | 11285 | 100 | S | (13) |
| I1182 | 16 05 36.74 | 17 48 06.95 | 13.9 | 10091 | 40 | E | (20) |
| I1183 | 16 05 38.19 | 17 46 00.01 | 14.3 | 10038 | 75 | E | (1) |
| 16034+1630 | 16 05 38.76 | 16 22 22.55 | 15.4 | 13406 | 42 | E | * |
| 16034+1634 | 16 05 39.12 | 16 26 09.89 | 16.0 | 40569 | 50 | S | * |
| N6057 | 16 05 39.59 | 18 09 50.01 | 14.2 | 10443 | 100 | E | (13) |
| 1603+1756A | 16 05 39.88 | 17 48 02.16 | 13.9 | 9973 | 100 | E | (24) |
| N6053 | 16 05 40.20 | 18 03 16.99 | 15.0 | 11993 | 100 | E | (13) |
| 16034+1634 | 16 05 40.37 | 16 25 45.05 | 15.9 | 40031 | 52 | S | * |
| 16034+1814 | 16 05 40.79 | 18 06 26.14 | 15.2 | 11401 | 30 | E | * |
| 1603+1756B | 16 05 40.85 | 17 48 02.23 | 13.9 | 9979 | 100 | S | (24) |
| 16034+1456 | 16 05 40.95 | 14 47 56.65 | 14.8 | 12218 | 28 | S | * |
| 16035+1708 | 16 05 43.42 | 16 59 34.37 | 15.2 | 14048 | 29 | E | * |
| 16035+1624 | 16 05 43.94 | 16 15 34.27 | 14.9 | 13093 | 26 | S | * |
| I1186 | 16 05 44.34 | 17 21 44.43 | 13.7 | 11043 | 100 | S | (24) |
| 16035+1620N | 16 05 44.70 | 16 12 10.01 | 14.7 | 13079 | 20 | S | (7) |
| I1185 | 16 05 44.95 | 17 42 56.49 | 13.7 | 10297 | 100 | S | (13) |
| 1603+1742 | 16 05 45.42 | 17 34 55.53 | 15.0 | 12206 | 100 | S | (25) |
| 1603+1726 | 16 05 46.32 | 17 18 19.55 | 15.7 | 11088 | 100 | S | (5) |
| 16035+1620S | 16 05 46.32 | 16 11 43.01 | 16.0 | 12079 | 20 | E | (7) |
| 16035+1809 | 16 05 46.32 | 18 01 00.98 | 14.4 | 12212 | 100 | S | (13) |
| 16035+1555 | 16 05 47.08 | 15 47 26.56 | 17.7 | 12450 | 100 | S | (13) |
| ne-264 | 16 05 47.49 | 18 23 02.26 | 17.2 | 12044 | 100 | S | (31) |
| 16036+1840 | 16 05 49.49 | 18 32 04.99 | 14.5 | 11139 | 100 | E | (13) |
| 1603+1736 | 16 05 50.03 | 17 28 45.80 | 15.9 | 10255 | 50 | E | (23) |
| 16035+1510 | 16 05 50.71 | 15 01 51.96 | 15.0 | 11880 | 26 | S | * |
| H186 | 16 05 52.22 | 18 27 57.56 | 16.2 | 11645 | 100 | S | (31) |
| 16036+1821 | 16 05 52.26 | 18 13 13.98 | 14.4 | 10739 | 20 | S | (6) |
| 16036+1620 | 16 05 52.76 | 16 11 59.14 | 14.8 | 13351 | 160 | S | * |
| A2151:[D80]013 | 16 05 53.09 | 17 18 28.01 | 16.0 | 9728 | 45 | E | (23) |
| 16036+1551 | 16 05 53.66 | 15 42 30.53 | 14.7 | 13148 | 34 | S | * |
| IRASF16035+1728 | 16 05 53.88 | 17 20 26.05 | 15.8 | 10265 | 100 | S | (23) |
| 1603+1826 | 16 05 54.78 | 18 18 42.98 | 15.8 | 11622 | 50 | S | (23) |
| ce-048 | 16 05 55.72 | 17 42 38.56 | 20.4 | 11145 | 100 | S | (31) |
| 1603+1749 | 16 05 56.68 | 17 41 30.99 | 16.0 | 11540 | 50 | E | (23) |
| 16037+1552 | 16 05 57.55 | 15 43 31.94 | 15.0 | 13176 | 35 | S | * |
| ne-240 | 16 05 58.31 | 18 24 40.97 | 17.6 | 11645 | 100 | S | (31) |
| 16037+1554 | 16 05 58.45 | 15 45 39.49 | 14.6 | 12154 | 27 | S | * |
| 160343+164242 | 16 06 00.09 | 16 34 38.39 | 14.8 | 12849 | 30 | S | * |
| 1603+1753 | 16 06 00.18 | 17 45 52.45 | 18.6 | 11959 | 100 | S | (25) |
| 16037+1643 | 16 06 00.26 | 16 34 38.39 | 14.8 | 12230 | 190 | E | * |
| A2151:[D80]112 | 16 06 00.43 | 18 04 54.48 | 15.5 | 11272 | 45 | E | (23) |
| 16038+1820 | 16 06 00.50 | 18 11 43.01 | 13.8 | 11215 | 100 | S | (13) |
| 1603+1815 | 16 06 01.91 | 18 06 42.01 | 14.9 | 10967 | 50 | S | (23) |
| 16038+1849 | 16 06 02.05 | 18 40 11.60 | 14.4 | 11751 | 100 | S | (13) |
| 1603+1815 | 16 06 02.49 | 18 06 57.60 | 16.0 | 11030 | 100 | S | (23) |
| 1603+1750 | 16 06 03.06 | 17 42 05.65 | 16.2 | 10829 | 50 | E | (23) |
| 160346+161835 | 16 06 03.45 | 16 10 33.20 | 14.9 | 10414 | 40 | E | * |
| 1603+1810 | 16 06 05.58 | 18 02 09.82 | 15.2 | 12190 | 100 | E | (25) |
| ne-208 | 16 06 05.67 | 18 16 43.43 | 18.7 | 11556 | 100 | S | (31) |
| MGT95:14 | 16 06 05.93 | 18 09 20.45 | 19.8 | 11467 | 100 | S | (31) |
| 16039+1845 | 16 06 06.19 | 18 36 25.99 | 14.2 | 11330 | 100 | S | (13) |
| 1603+1735 | 16 06 07.24 | 17 27 38.91 | 14.8 | 10699 | 50 | S | (23) |
| A1603+1800 | 16 06 08.75 | 17 52 34.00 | 16.9 | 10762 | 197 | S | (22) |
| 16039+1619 | 16 06 10.12 | 16 11 00.46 | 15.1 | 12766 | 24 | S | * |
| A2151:[D80]140 | 16 06 11.85 | 18 19 43.21 | 15.9 | 10939 | 100 | S | (23) |
| 1603+1726 | 16 06 11.99 | 17 18 06.19 | 14.7 | 10128 | 50 | S | (23) |
| 1603+1812 | 16 06 13.71 | 18 04 40.33 | 15.0 | 11002 | 50 | E | (23) |
| 16040+2016 | 16 06 13.77 | 20 08 06.32 | 15.5 | 51910 | 62 | S | * |
| 16040+1627 | 16 06 13.84 | 16 19 22.77 | 14.9 | 13215 | 31 | S | * |
| 1603+1805 | 16 06 13.86 | 17 57 15.34 | 15.2 | 11440 | 32 | S | (22) |
| 16040+1833 | 16 06 14.15 | 18 24 58.36 | 14.3 | 11161 | 100 | S | (24) |
| I1189 | 16 06 14.61 | 18 10 55.42 | 14.3 | 11810 | 40 | S | (20) |
| N6061 | 16 06 16.02 | 18 14 59.50 | 13.9 | 11305 | 100 | E | (13) |
| 16040+1848 | 16 06 16.14 | 18 39 52.92 | 15.8 | 10920 | 54 | S | * |
| 16040+1610 | 16 06 16.45 | 16 02 20.94 | 14.9 | 12953 | 33 | E | * |
| 16040+1627 | 16 06 16.67 | 16 18 46.69 | 15.3 | 13470 | 33 | S | * |
| A1604+1829 | 16 06 17.79 | 18 21 42.01 | 15.1 | 11099 | 63 | S | (12) |
| 16040+1552 | 16 06 18.23 | 15 43 37.45 | 15.3 | 10904 | 38 | S | * |
| 16040+1640 | 16 06 19.22 | 16 32 18.63 | 14.2 | 10785 | 100 | E | (13) |
| 16040+1634 | 16 06 19.47 | 16 25 52.64 | 13.9 | 10130 | 100 | S | (13) |
| A2151:[D80]076 | 16 06 20.74 | 17 47 15.79 | 16.0 | 11950 | 45 | E | (23) |
| ne-142 | 16 06 22.48 | 18 00 02.70 | 19.6 | 11711 | 100 | S | (31) |
| 1604+1803 | 16 06 22.50 | 17 55 43.89 | 13.8 | 10494 | 50 | S | (23) |
| A1604+1803 | 16 06 22.68 | 17 55 40.91 | 15.3 | 26579 | 218 | S | (22) |
| 16041+1549S | 16 06 25.70 | 15 41 04.99 | 13.9 | 13201 | 23 | E | (17) |
| 16041+1549N | 16 06 25.99 | 15 41 31.99 | 14.5 | 12044 | 22 | S | (17) |
| 1604+1824 | 16 06 29.09 | 18 16 07.32 | 15.3 | 11632 | 50 | S | (23) |
| 1604+1824 | 16 06 29.99 | 18 16 05.38 | 16.5 | 11998 | 50 | S | (23) |
| 16042+1544 | 16 06 30.13 | 15 36 12.89 | 14.3 | 12670 | 51 | S | * |
| I1193 | 16 06 32.11 | 17 42 50.51 | 13.9 | 12034 | 30 | S | (18) |
| I1192 | 16 06 33.15 | 17 46 33.56 | 14.2 | 11500 | 46 | S | (18) |
| 1604+1725 | 16 06 34.31 | 17 17 49.63 | 14.9 | 21295 | 50 | S | (23) |
| 16043+1801 | 16 06 35.21 | 17 53 32.71 | 14.7 | 11049 | 100 | S | (13) |
| A2151:[D80]055 | 16 06 35.93 | 17 43 21.75 | 15.2 | 10993 | 100 | E | (30) |
| A2151:[D80]054 | 16 06 35.94 | 17 41 45.74 | 15.5 | 11967 | 100 | S | (30) |
| ne-112 | 16 06 37.61 | 18 23 48.87 | 16.7 | 11046 | 100 | S | (31) |
| 16044+1550 | 16 06 38.29 | 15 41 51.47 | 14.7 | 13017 | 28 | E | * |
| A2151:[D80]073 | 16 06 38.84 | 17 47 00.93 | 14.7 | 11190 | 100 | E | (30) |
| 16044+1704 | 16 06 39.52 | 16 56 14.28 | 14.9 | 12092 | 30 | S | * |
| I1194 | 16 06 39.60 | 17 45 38.01 | 14.1 | 11642 | 65 | E | (1) |
| A2151:[HKT95]4028 | 16 06 40.07 | 17 35 18.99 | 16.7 | 14099 | 241 | S | (22) |
| I1195 | 16 06 40.79 | 17 11 30.05 | 14.1 | 12121 | 100 | S | (13) |
| 1604+1743 | 16 06 41.04 | 17 35 31.06 | 15.1 | 12226 | 51 | S | (18) |
| A1604+1557B | 16 06 41.04 | 15 49 18.99 | 17.9 | 11335 | 74 | E | (22) |
| A1604+1557A | 16 06 41.04 | 15 50 17.02 | 16.8 | 11437 | 80 | S | (22) |
| 16044+1627 | 16 06 42.09 | 16 19 11.10 | 13.3 | 11015 | 26 | S | (19) |
| BO85:130 | 16 06 44.51 | 18 14 47.40 | 17.3 | 11600 | 100 | S | (31) |
| A2151:[D80]071 | 16 06 47.92 | 17 47 22.53 | 16.9 | 12561 | 45 | E | (23) |
| 1604+1746 | 16 06 48.20 | 17 38 53.52 | 15.1 | 11201 | 50 | S | (23) |
| 16045+1738 | 16 06 48.46 | 17 29 34.55 | 14.6 | 11199 | 20 | E | (12) |
| 16045+1456 | 16 06 50.40 | 14 47 46.00 | 14.2 | 11373 | 29 | S | * |
| 1604+1821 | 16 06 53.24 | 18 13 21.86 | 15.0 | 10845 | 50 | S | (23) |
| 1604+1759 | 16 06 56.95 | 17 51 23.11 | 15.9 | 11517 | 20 | E | (12) |
| 16047+1618 | 16 06 58.21 | 16 09 43.49 | 14.5 | 12221 | 32 | E | * |
| 1604+1809 | 16 07 01.63 | 18 01 20.39 | 14.4 | 10870 | 50 | S | (23) |
| 16047+1544 | 16 07 03.18 | 15 35 35.41 | 14.2 | 11800 | 20 | S | (6) |
| 1604+1758 | 16 07 06.06 | 17 50 56.68 | 14.9 | 11582 | 50 | E | (23) |
| 16049+1846 | 16 07 09.87 | 18 38 28.89 | 13.8 | 11599 | 45 | S | * |
| 16049+1643 | 16 07 10.53 | 16 34 32.41 | 14.9 | 11463 | 46 | S | * |
| 16050+1835 | 16 07 11.86 | 18 27 11.16 | 15.2 | 10847 | 28 | S | * |
| 1605+1749 | 16 07 17.00 | 17 41 46.36 | 15.4 | 10977 | 50 | S | (12) |
| 1605+1756 | 16 07 18.77 | 17 48 06.48 | 15.7 | 27047 | 50 | E | (1) |
| 16050+1559 | 16 07 19.43 | 15 50 58.92 | 14.7 | 11913 | 32 | S | * |
| 1605+1747 | 16 07 24.13 | 17 39 41.83 | 14.6 | 11546 | 20 | S | (12) |
| 1605+1822 | 16 07 25.46 | 18 14 39.95 | 15.9 | 10634 | 50 | E | (23) |
| 16052+1509 | 16 07 28.85 | 15 00 40.61 | 14.9 | 11241 | 38 | S | * |
| 1605+1810 | 16 07 31.51 | 18 02 27.31 | 14.8 | 11078 | 50 | S | (23) |
| 1605+1836 | 16 07 38.21 | 18 28 45.99 | 14.4 | 11169 | 22 | S | (26) |
| 1605+1825 | 16 07 54.30 | 18 17 43.80 | 15.5 | 10810 | 20 | S | (12) |
| CGCG108-157 | 16 08 10.72 | 16 46 17.80 | 14.3 | 11569 | 39 | S | (28) |
| A1605+1625B | 16 08 12.44 | 16 17 41.89 | 16.6 | 76003 | 53 | S | (22) |
| A1605+1625A | 16 08 13.42 | 16 18 07.99 | 15.5 | 12351 | 100 | E | (22) |
| 16060+1842 | 16 08 14.89 | 18 34 15.56 | 14.8 | 10575 | 28 | S | * |
| 16060+1732 | 16 08 17.51 | 17 24 35.93 | 15.1 | 10363 | 31 | E | * |
| 16062+1659 | 16 08 27.96 | 16 51 23.90 | 15.1 | 11781 | 46 | E | * |
| 16062+1821 | 16 08 29.26 | 18 12 43.13 | 14.5 | 11008 | 26 | E | * |
| A1606+1637 | 16 08 42.79 | 16 30 11.99 | 15.1 | 12243 | 401 | E | (22) |
| 16065+1654 | 16 08 45.20 | 16 45 33.01 | 13.9 | 10596 | 100 | S | (25) |
| A1606+1737 | 16 08 59.06 | 17 29 56.90 | 15.7 | 10786 | 200 | E | (22) |
| A1606+1612B | 16 09 07.63 | 16 04 21.43 | 18.1 | 12855 | 355 | E | (22) |
| A1606+1612A | 16 09 07.63 | 16 04 21.43 | 15.2 | 22475 | 100 | S | (22) |
| A1606+1547 | 16 09 12.10 | 15 39 57.71 | 17.3 | 13271 | 326 | E | (22) |
| 1607+1919 | 16 09 17.10 | 19 12 07.16 | 16.4 | 10762 | 100 | E | (14) |
| A1607+1637A | 16 09 28.19 | 16 29 28.75 | 16.5 | 12315 | 167 | E | (22) |
| A1607+1637B | 16 09 28.66 | 16 29 36.78 | 20.0 | 13319 | 167 | E | (22) |
| 16073+1823 | 16 09 31.57 | 18 15 10.08 | 14.5 | 6373 | 81 | S | * |
| 16074+1854 | 16 09 39.38 | 18 45 57.03 | 14.6 | 10737 | 22 | S | * |
| 16076+1749 | 16 09 49.70 | 17 40 43.22 | 14.8 | 10162 | 21 | E | * |
| 16075+1544 | 16 09 49.97 | 15 35 54.85 | 14.9 | 13814 | 26 | E | * |
| N6073 | 16 10 10.92 | 16 41 54.53 | 15.1 | 4590 | 8 | S | (11) |
| A1607+1512 | 16 10 10.99 | 15 05 30.01 | 15.9 | 17606 | 158 | E | (22) |
| 16080+1545 | 16 10 17.62 | 15 37 14.01 | 14.6 | 13405 | 17 | E | * |
| 16084+1911 | 16 10 38.68 | 19 03 26.75 | 14.8 | 10855 | 39 | S | * |
| A1608+1505 | 16 10 43.83 | 14 57 51.59 | 17.4 | 13577 | 233 | S | (22) |
| 16086+1914 | 16 10 49.72 | 19 05 51.25 | 14.5 | 11005 | 22 | S | * |
| 16086+1806 | 16 10 50.56 | 17 58 30.15 | 14.0 | 10967 | 20 | S | (16) |
| 16086+1711 | 16 10 51.31 | 17 03 20.99 | 13.8 | 10184 | 14 | S | (24) |
| 16088+1838 | 16 11 05.28 | 18 29 54.99 | 14.4 | 10837 | 100 | S | * |
| A1609+1528 | 16 11 26.38 | 15 20 30.33 | 16.9 | 14234 | 100 | S | (22) |
| 1609+1707 | 16 11 33.54 | 16 59 18.89 | 14.7 | 26949 | 47 | S | * |
| 1609+1700 | 16 11 47.65 | 16 52 25.79 | 15.3 | 4569 | 41 | S | * |
| 16097+1654 | 16 11 56.83 | 16 46 40.04 | 14.3 | 10246 | 34 | S | * |
| 16099+1446 | 16 12 09.85 | 14 38 14.03 | 15.1 | 9611 | 20 | S | * |
| 16102+1619 | 16 12 30.53 | 16 11 01.57 | 14.8 | 10457 | 26 | E | * |
| 16106+1701 | 16 12 50.94 | 16 53 08.99 | 15.2 | 10253 | 54 | E | * |
| 16109+1828 | 16 13 11.66 | 18 20 50.75 | 15.0 | 10827 | 35 | E | * |
| 16110+1720 | 16 13 15.20 | 17 12 25.49 | 17.4 | 1089 | 25 | S | (29) |
| 16116+1503 | 16 13 54.77 | 14 55 35.80 | 14.0 | 14036 | 29 | S | * |
| 16120+1926 | 16 14 11.26 | 19 18 54.18 | 14.4 | 9213 | 57 | S | * |
References. — (*) new velocities, this paper; (1) de Vaucouleurs et al. 1976; (2) de Vaucouleurs et al. 1991; (3) Huchra & Sargent 1973; (4) Denisyuk et al. 1976; (5) Arakelyan et al. 1972; (6) Giovanelli & Haynes 1981; (7) Giovanelli & Haynes 1985; (8) Freudling et al. 1991; (9) Giovanardi & Salpeter 1985 (10) Schneider et al. 1990; (11) Mould et al. 1993; (12) Bird et al. 1993; (13) Tarenghi et al. 1979; (14) Lipovetskii & Stepanyan 1986 (15) Ulrich 1976; (16) Huchra et al. 1983; (17) White et al. 1983; (18) Zabludoff et al. 1990; (19) Zabludoff et al. 1993a; (20) Schommer et al. 1981; (21) Rood 1981 (22) Hopp et al. 1995; (23) Dressler & Shectman 1988; (24) Palumbo et al. 1983; (25) Huchtmeier & Richter 1989; (26) Strauss et al. 1992; (27) Lawrence et al. 1997; (28) Scodeggio & Gavazzi 1993; (29) Bothun et al. 1985; (30) Maccagni et al. 1995; (31) Dickey 1997
| Name | skewness | kurtosis | aaValues for ,, and are percentage of Monte Carlo realizations with values of the statistics less than that for the cluster. | |||
|---|---|---|---|---|---|---|
| supercluster | 414 | 1.68 | 4.77 | 0.026 | ||
| A2151 | 143 | -0.10 | -0.61 | 99.9 | 99.9 | 0.000 |
| A2152 | 56 | -0.54 | -0.65 | 99.9 | 99.9 | 0.6 |
| A2147 | 93 | 0.14 | -0.50 | 99.5 | 84.3 | 66.3 |
| Cluster | ||||
|---|---|---|---|---|
| km s-1 | km s-1 | |||
| A2151 | 11004 59 | 705 | ||
| A2152 | 12942 97 | 715 | ||
| A2147 | 10492 85 | 821 | ||
| dispersed | 11639 128 | 1407 |
| Cluster | method | () | Ref. |
|---|---|---|---|
| A2151 | VT | (1) | |
| A2151 | VT | (2) | |
| A2151 | PM | (2) | |
| A2151 | VT | (3) | |
| A2151 | X-ray (kpc) | (4) | |
| A2152 | VT | (1) | |
| A2147 | VT | (1) | |
| A2147 | X-ray | (5) |
| Cluster | |||
|---|---|---|---|
| A2151 | (1.9 0.4) | 374 92 | 430 103 |
| A2152 | (1.3 0.2) | 542 145 | 1206 288 |
| A2147 | (1.6 0.3) | 774 190 | 879 204 |
| Cluster | (km s | (km s | (km s | (km s | ||
|---|---|---|---|---|---|---|
| A2151 | 56 | 10803104 | 779 | 87 | 1113368 | 641 |
| A2152 | 20 | 13011157 | 684 | 37 | 12905126 | 769 |
| A2147 | 43 | 10476110 | 715 | 50 | 10505129 | 906 |
| A2151 SW | 7 | 1015061 | 141 | 7 | 11111129 | 593 |
| Cluster | aaButa & Corwin 1986, ‘GCH’ data | d (Mpc)aaButa & Corwin 1986, ‘GCH’ data | bbButa & Corwin 1986, ‘other’ data | d(Mpc)bbButa & Corwin 1986, ‘other’ data | ccPostman & Lauer 1995 | |
|---|---|---|---|---|---|---|
| 2151 | 11004 | 7 | 87 11ddErrors calculated from BC’s TF equation and quoted errors in observables. | 11 | 113 12 | 89 15 |
| 2152 | 12942 | 0 | 2 | 119 12 | 152 26 | |
| 2147 | 10492 | 7 | 92 11 | 2 | 76 9 | 85 14 |
| Pair | binding ratio | range |
|---|---|---|
| A2147-A2151 | 0.05 | |
| A2151-A2152 | 0.88 | not bound |
| A2147-A2152 | 0.50 | not bound |
| A2147/51+2152 | 0.28 |
| Name | (J2000) | (J2000) | ||
|---|---|---|---|---|
| 16028+1756 | 16 05 05 | 17 47 44 | 18.68 | 1.59 |
| 16028+1757 | 16 05 05 | 17 48 25 | 18.61 | 1.38 |
| NGC6045 | 16 05 08 | 17 45 27 | 15.15 | 1.56 |
| A2151:[BO85]137 | 16 05 08 | 17 48 55 | 18.04 | 1.29 |
| NGC6047 | 16 05 09 | 17 43 47 | 15.28 | 1.62 |
| A2151:[BO85]053 | 16 06 15 | 17 48 03 | 16.90 | 1.51 |
| A2151:[D80]061 | 16 05 16 | 17 42 30 | 16.94 | 1.66 |
| 16030+1750 | 16 05 18 | 17 41 36 | 19.47 | 1.62 |
| 16031+1755 | 16 05 21 | 17 46 55 | 18.35 | 1.47 |
| 16032+1751 | 16 05 26 | 17 41 49 | 17.04 | 1.26 |
| 16032+1757 | 16 05 28 | 17 48 57 | 18.19 | 1.41 |
| 16032+1757 | 16 05 29 | 17 40 51 | 16.19 | 1.58 |
| A1603+1748 | 16 05 30 | 17 46 14 | 15.92 | 1.21 |
| NGC6054 | 16 05 31 | 17 41 18 | 17.38 | 1.53 |
| 16033+1749 | 16 05 33 | 17 48 07 | 15.53 | 1.60 |
| IC1182 | 16 05 37 | 17 46 00 | 15.62 | 1.71 |
| IC1183 | 16 05 38 | 17 46 00 | 15.62 | 1.71 |