The ionizing fluxes of early type stars and their impact on H ii regions and the ‘Diffuse Ionized Gas’
Abstract
We discuss recent results on the ionizing fluxes of O stars obtained from our “combined stellar structure and atmosphere models” (CoStar) accounting for stellar winds, non-LTE effects and line blanketing. The implications on the ionization structure of H ii regions are summarized, and observational constraints on the ionizing spectra and the total ionizing photon fluxes are presented. Using our CoStar models we derive new consistent predictions for the H and He i ionizing fluxes of steady-state massive star populations. Implications for the interpretation of observations of ‘Diffuse Ionized Gas’ in galaxies are discussed. Finally we present preliminary model calculations aiming to improve our current predictions further and compare our results to recent results from the Munich group.
1 Introduction
The “combined stellar structure and atmosphere models” (hereafter CoStar) models have been applied in detail to the main-sequence phase (Schaerer et al. 1996ab; paper I & II). Here we concentrate on some important predictions regarding the spectral evolution on the main sequence, namely recent results on the ionizing fluxes of OB stars for which considerable progress has been achieved in the recent years. Predictions of ionizing fluxes are of special interest for analysis of massive stars, H ii regions, young starburst galaxies and related objects.
We shall first present current models for O stars (Sect. 2). In Sect. 3 we will summarize some of the implications recent ionizing fluxes have on H ii regions and how observations of H ii regions might be used to constrain model atmospheres. New predictions of ionizing fluxes of steady-state massive star populations and some of their implications on the diffuse ionized gas in galaxies are given in Sect. 4 In Sect. 5 we finally present preliminary results from new calculations aiming to improve our current predictions further.
2 Ionizing fluxes O stars
The input physics of the CoStar models is described in detail in paper I. The most important ingredients regarding the prediction of ionizing fluxes are the treatment of non–LTE, the stellar wind, and line blanketing (see Schaerer & de Koter 1997, hereafter paper III). The current sets of models (paper III) covers the entire main sequence evolution for stars with initial masses between 20 and 120 and includes a set for solar metallicity (Z=0.02) and low metallicity (Z=0.004 and appropriately scaled wind parameters). The coverage approximately corresponds to spectral types from O3 to B0 and all luminosity classes. As discussed in paper III, reliable predictions for later types are currently not available for physical and technical reasons. Spectral energy distributions, H ii region models (cf. below), and additional information is available on our Web page at http://www.stsci.edu/ftp/science/starburst and on CD-ROM (see Leitherer et al. 1996).
Extensive comparisons of our predictions with previous calculations (Kurucz models, plane parallel line blanketed models) are given in paper III. A detailed discussion of the physical processes affecting the ionizing spectrum is also given there. The main results can be summarized as follows: 1) The flux in the He ii continuum is increased by 2 to 3 (3 to 6) orders of magnitudes compared to predictions from plane parallel non–LTE (LTE) model atmospheres (cf. Gabler et al. 1989). 2) The flux in the He i continuum is known to be increased due to non–LTE effects. In addition, the combined effect of a mass outflow and line blanketing leads to a flatter energy distribution in the He i continuum. This has profound implications on the structure of H ii regions (Sect. 3). 3) To a lesser extent than at high energies, the flux in the Lyman continuum is also modified due to line blanketing and the presence of a stellar winds. Generally one obtains a reduction of the Lyman continuum flux compared to plane parallel model atmospheres.
Based on our CoStar models we have also derived integrated photon fluxes for stellar parameters corresponding to the new spectral type and luminosity class calibration of Vacca et al. (1996). Our results are compared with former calibrations of Panagia (1973) and Vacca et al. (1996), both based on plane parallel model atmospheres. It must, however, be remembered that such a calibration is quite strongly dependent on the assignment between spectral types and stellar parameters, for which considerable uncertainties remain for O stars (cf. Vacca et al., Crowther 1997, Lamers et al. 1997, Schmutz, these proceedings).
3 The impact of CoStar ionizing fluxes on H ii regions and possible tests of atmosphere models
Using the photoionization code PHOTO we have computed a large grid of single star H ii region models based on the new CoStar ionizing fluxes (Stasińska & Schaerer 1997, hereafter paper IV). For comparisons a similar grid has been calculated using fluxes from plane parallel LTE model atmospheres of Kurucz (1991). The main additional parameter determining the structure of the H ii region, the ionization parameter , is varied over a wide range corresponding to conditions expected between the most compact H ii regions and the most diluted interstellar medium. Detailed results are available on our Web page and on CD-ROM (see above).

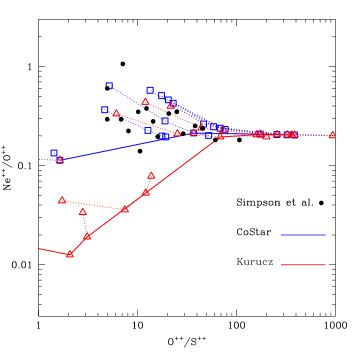
The flatter spectral energy distribution in the He i continuum (cf. Fig. 1 left panel) generally leads to higher ionic ratios in the nebula if CoStar models are compared to plane parallel atmospheres at the same stellar temperatures. In particular, with ionizing fluxes from CoStar models one obtains ionic fractions of and which are close to unity for ionization parameters typical of H ii regions and over a large range of stellar temperatures. Therefore N+/O+ and Ne++/O++ should provide safe indicators to derive N/O and Ne/O abundance ratios over a wide range of astrophysical conditions.
As shown by the exploratory calculations of Sellmaier et al. (1996) the use of ionizing fluxes from non–LTE wind models including line blocking seems to resolve the so-called [Ne iii] problem, which was made particularly clear when Simpson et al. (1995) plotted the values of Ne++/O++ as a function of O++/S++ (all derived from far-IR line measurements). The problem is illustrated in Fig. 1 (right panel), where the observations indicate an essentially flat Ne++/O++ while the predictions of photoionizaton models using the Kurucz atmospheres fail to reproduce the observations. Indeed, the higher ionic ratios obtained from photoionization models using the CoStar fluxes are in much better agreement with the observations than models based on Kurucz atmospheres (see Fig. 1). As shown in paper IV a similar “observational test” can be performed by using optical lines. Both comparisons support our ionizing fluxes from non–LTE atmospheres including stellar winds and line blanketing.
Although such comparisons may represent extremely useful tests of predicted EUV fluxes, good constraints on the ionization parameter and a precise knowledge about the ionizing sources (stellar type, number of stars) must be obtained for accurate comparisons. This should be possible with future observations of, in the ideal case, integrated single star H ii regions. Careful studies of the metallicity dependence (and hence also the dependence on the wind properties) of the predicted fluxes will be both necessary and extremely useful for many astrophysical applications. For example the great sensitivity of the Ne (and several other IR) lines on the shape of the ionizing spectrum in the He i continuum has important consequences for the interpretation of emission line spectra of H ii regions and young starbursts in the wavelength range observed by ISO. Derived stellar temperatures, IMF slopes and upper mass cut-offs depend strongly on the adopted ionizing fluxes as illustrated by Kunze et al. 1996.
3.1 Constraints on the Lyman continuum production of OB stars
Another fundamental test atmosphere models have to be subjected to is of course whether the integrated ionizing photon flux (e.g. in the Lyman continuum) is correctly predicted. The best example of such a test is certainly the B2II star CMa, for which direct EUVE observations below the Lyman limit could be obtained (Cassinelli et al. 1995). For this case a large excess (by a factor of 30) of the Lyman continuum flux was found compared to plane parallel atmosphere models ! Although this excess can be explained by a temperature excess in the continuum forming layers (see Cassinelli et al., paper IV, Aufdenberg et al. 1997) the physical cause for this temperature increase remains to be explained. Obviously in a larger context the fundamental question is, however, if the Lyman continuum excess is a general phenomenon, and if so for what type of stars ?
In principle this question can easily be answered by observations measuring the integrated recombination rate (e.g. luminosity) of nebulae around single stars of known spectral type. Detection of excess radiation compared to predictions for the determined spectral type could indicate an intrinsic excess of the Lyman continuum flux from the central star (or an undetected additional source). A lack of radiation can be interpreted as leakage of photons out of the region or important internal absorption by dust. To our knowledge no such systematic comparison has been done so far, especially for B stars. Few statements can nevertheless already be made at this stage.
For ultracompact H ii regions which, according to derived from FIR line ratios, contain stars of spectral types B0-O7 a slight excess might be found for some cases (Afflerbach et al. 1997). However, their stellar content is not known directly and multiple sources can therefore not be excluded. The first ultracompact H ii region where the spectral type of the central star has been directly identified (Watson & Hanson 1997) indicates leakage or dust absorption. Oey (these proceedings) and Oey & Kennicutt (1997) have recently compared observed H ii region luminosities with the Lyman continuum luminosities predicted for their well determined stellar content. The vast majority is found to be leaking photons (up to 50 %). From their samples, mostly dominated by several O stars, an excess of Lyman continuum flux can on average be excluded for O stars. Similar observations of less populated regions and nebulae dominated by later spectral types would be highly rewarding.
4 Photoionization of the diffuse ionized gas by massive stars
The multi-phase interstellar medium (ISM) contains a diffuse ionized component representing a significant fraction of its total mass and volume. This gas is often referred to as the ‘Reynolds Layer’ in the Milky Way, or the ‘Diffuse Ionized Medium’ (DIM), ‘Warm Ionized Medium’ (WIM), ‘Diffuse Ionized Gas’ (DIG) etc. in external galaxies. We shall adopt the acronym ‘DIG’. It is usually found that OB stars provide enough power to ionize the DIG (e.g. Reynolds 1984, Hunter & Gallagher 1990, Ferguson et al. 1996, Martin & Kennicutt 1997). The picture of photoionization by massive stars has, however, been challenged by recent measurements of a low He ionization fraction in the Galactic DIG (Heiles et al. 1996). On the other hand the observations of Martin & Kennicutt (1997) show that important variations in the physical state of the DIG exist among galaxies.
To provide a quantitative base to address some of the questions raised by these studies it is highly desirable to use results from the most appropriate atmosphere and evolutionary models. For example, the expected He ionization of the DIG is dependent on the hardness of the ionizing fluxes of OB stars, which, as discussed above, has been revised considerably in recent years. Following the lines of Heiles et al. (1996) we will therefore derive new consistent calibrations of the H and He i ionizing fluxes for massive star populations based on our CoStar models. Some implications for the DIG of various galaxies will be discussed in Sect. 4.2
4.1 Ionizing fluxes of massive star populations
For studies of the DIG one usually considers a stellar population at a steady-state equilibrium (“constant star formation”). The basic quantities of interest are then (cf. Heiles et al. 1996): the lifetime of a star of initial mass , its time-averaged Lyman continuum luminosity , and its time-averaged HeI continuum luminosity . These quantities can then be integrated over an initial mass function (IMF) to derive the total output of a stellar population.
For the derivation of these quantities we use the CoStar models (papers I-III). We also extend the calculations to include the post main-sequence (MS) phases, which have been neglected in all previous calculations. The adopted input physics (tracks, atmospheres) is the same as in the synthesis models of Schaerer (1996) and Schaerer & Vacca (1997): we use the most recent Geneva tracks, Schmutz et al. (1992) atmospheres for Wolf-Rayet (WR) stars, and Kurucz (1991) atmospheres for the remaining phases.


Fitting the results for solar metallicity models we obtain the following descriptions:
| (1) |
| (2) |
and (in years) are the main sequence and the total lifetime respectively. Eqs. 1 and 2 are valid for . Note that the most massive stars () enter the WR phase during core H-burning. In this case we have restricted the definition of the “MS phase” to the non-WR phase. We note that the MS lifetimes differ by less than 15 % from the values of Güsten & Mezger (1982) used by Heiles et al. The mean Lyman continuum luminosity can be fitted by
| (3) |
for the same mass range as above. It turns out that this expression represents well both the average over the MS and the total average. Our values agree well with those of Cox et al. (1986) for . Otherwise our values for are lower, with differences up to a factor of 5 at the border of the fit interval.
To describe the He i ionizing flux we use (see Fig. 2), which can be approximated by
| (4) | |||||
| (5) | |||||
| (6) |
For the fraction of He i ionizing photons is negligible ().
The “time-averaged hardness” as a function of the initial mass is shown in Fig. 2 (left panel). Also shown is given by Heiles et al. (1996), which was obtained from the plane parallel non-LTE atmospheres of Kudritzki et al. (1991). Note that these atmosphere models predict a similar hardness (in terms of ) of the ionizing flux as the CoStar models including also wind effects and line blanketing. The data of Heiles et al., however, only correspond to values typical for characteristic parameters of main sequence stars; any temporal evolution has been neglected. The evolutionary tracks in the considered mass range extend to temperatures below 40000 K on the MS. Given the rapid decrease of the He i ionizing luminosity below this temperature (e.g. paper III), the MS average of is systematically lower than the value given by Heiles et al. for . For lower masses our results are in good agreement with the values of Heiles et al. Incidentally this is also the mass range which is critical for the interpretation of the observations of the DIG in the Milky Way (see Sect. 4.2). It must, however, also be noted that this is likely the domain where current models are the most uncertain for the reasons discussed in paper III. Fig. 2 also illustrates the difference between averaging over the MS only and the more correct average over the MS and post-MS phases: For the most massive stars averaged over their entire lifetime can be up to 25 % lower than the MS value. This is due to their evolution in the WR phase, which leads to lower average luminosities. For comparison we have also plotted (average over total lifetime) at 1/5 solar metallicity. As expected the average spectrum is slightly harder, mostly due to the temperature shift of the MS. In short we conclude that the time-averaged spectrum predicted from consistent modeling using in particular the ionizing fluxes from our CoStar models yields a lower HeI/H hardness than the results of Heiles et al. (1996).111This contradicts several statements of Martin & Kennicutt (1997). Some comments must be made on the mass scales shown in their Fig. 3: 1) All scales are representative for dwarf stars and do not include the time average, whose importance was shown above. 2) Scale d was drawn from the preprint version of Heiles et al. which used LTE model atmospheres, while their final results are based on non-LTE models yielding a similar hardness as the CoStar models. Similarly for other results (, Galactic star formation rate) the statements of Martin & Kennicutt refer to the preprint of Heiles et al., before important revisions were made.
Let us now consider the hardness of the spectrum produced by an integrated stellar population at a steady-state equilibrium. Figure 2 illustrates the dependence of on the upper mass cut-off for various slopes of the IMF. In our notation the Salpeter IMF is . Obviously the results are not sensitive to the lower mass cut-off as long as . Despite differences in all the ingredients (see above) our results agree well with those of Heiles et al. (their Table 6) for , whereas we obtain a softer spectrum for larger values of . For illustration we also plot the run of for a low metallicity population. We shall now briefly discuss some implications from these results.
4.2 Implications for the diffuse ionized gas
As shown by Heiles et al. (1996) the observations of the DIG in the Milky Way pose serious difficulties for the massive-star photoionization picture: while the high fraction of neutral He requires that very massive stars are excluded, the observed Galactic ionization requirement would imply a total star formation rate much larger than derived from other observations. Indeed the ratio of the HeI ionizing photon production rate to derived from the observations is (Heiles et al.).
Our results confirm entirely the interpretation of their Milky Way data. In contrast with some statements of Martin & Kennicutt the use of our atmosphere models does not change the conclusions of Heiles et al. for the reasons discussed above (see footnote). Indeed, a comparison with the right panel of Fig. 2 shows that the observed implies an upper mass cut-off of . This result is robust even to large variations of the IMF slope (e.g. the very steep slopes found by Massey et al. (1995) for field stars) as also show by Fig. 2. For we also obtain the same Lyman continuum production as Heiles et al., which confirms the requirement of a large Galactic star formation rate to reproduce the observed Galactic ionizing photon production rate.
As an unconventional explanation for these problems Heiles et al. consider the possible excess of Lyman continuum flux from B stars, motivated by the observed excess in the B2II star CMa. If common among B stars this could potentially solve the above mentioned difficulties. As discussed in Sect. 3.1 it should be possible to constrain the ionizing fluxes of B stars observationally in the future.
The observations of DIG of three Magellanic irregular galaxies of Martin & Kennicutt (1997) reveal a different picture. There the He ionization fraction is approximately equal to the hydrogen fraction, which translates to a lower limit of (Martin & Kennicutt). From the right panel in Fig. 2 this translates to a lower limit for the upper mass cut-off of 30-40 for a Salpeter IMF. We also note that the high He ionization in these objects could in principle even be explained by a population with an IMF slope as steep as those derived by Massey et al. (1995) for field stars. For this case the required upper mass cut-off is 40-60 , well compatible with numerous independent observational constraints (cf. Leitherer 1997, Massey 1997). The ionization by radiation leaking out from H ii regions (with a “normal” IMF slope) is, however, a more likely explanation, as shown by recent observations (Ferguson et al. 1996, Martin & Kennicutt 1997, Oey & Kennicutt 1997, Wang et al. 1997).
5 Reliable ionizing fluxes for OB stars: further developments
To improve our atmosphere models further and to compare the predicted spectra with UV observations we have recently upgraded the non-LTE calculations by including a detailed treatment of CNO and Si in addition to H and He (following de Koter et al. 1997). Improvements are also brought about for the completeness of the line list used in the line blanketing Monte-Carlo simulations. In this Section we shall briefly present some preliminary results on the EUV fluxes and compare our latest calculations with new models from the Munich group (Pauldrach, these proceedings).


The main changes with respect to paper IV are the explicit non-LTE treatment of CNO and Si, whose populations were previously described by our modified nebular approximation (see paper I and references therein). By the same token this also allows us to derive a finer description of the radiation temperature as a function of the ionization potential, which is used to describe the ionization structure of the remaining elements. The bound-free opacities of CNO and Si are now also included. In Fig. 3 we plot a comparison for two models from paper IV. For Å the new calculations agree well with the previous ones. Between 310 Å and the He ii edge (228 Å) our new models predict less flux, mostly due to the inclusion of the bound-free CNO opacity. Predictions for the He ii continuum remain subject to other considerable uncertainties (see paper IV).
In Fig. 3 we have also plotted the flux from two new atmosphere models including line blocking calculated with similar parameters (see Pauldrach, these proceedings). The overall agreement between the models is quite good for Å, although some distinct features exist. At shorter wavelengths, however, the flux from the Munich model decreases more strongly, remaining fairly close to the Kurucz model for 40000 K. (left panel). We have done test calculations of photoionization models using both sets of fluxes. Regarding the nebular Ne++/O++ abundance ratio (cf. Sect. 3) we obtained only minor changes for our models, while the Pauldrach model at 40000 K yield Ne++/O++ 0.1-0.15 and O++/S++ 25, more similar to Kurucz models.
Given important differences between the model techniques and the some of the input physics (e.g. line lists) it is difficult to explain the reason(s) for the differences in the predicted spectra. More detailed work remains to be done to further explore the dependence on various model assumptions and to improve the treatment of line blanketing and non-LTE effects in spherically expanding atmospheres. Concomitantly it appears very useful to pursue further studies of “simple” H ii regions to constrain atmosphere models as much as possible. In view of the difficulties hot star models have faced so far in reproducing correctly the observable UV from consistent calculations (see e.g. Groenewegen & Lamers 1991, Pauldrach et al. 1994) such new tests could be crucial to reach the goal of obtaining accurate predictions of the spectral evolution of early type stars.
Acknowledgements.
I would like to thank Alex de Koter for the use of his ISA-WIND code, Grazyna Stasińska for model calculations, and Adi Pauldrach for sharing results from new calculations. A fellowship from the Swiss National Foundation of Scientific Research and partial support from the Directors Discretionary Research Fund of the STScI are greatly acknowledged.References
- [1] fflerbach A., Churchwell E., Werner M.W., 1997, ApJ, 478, 190
- [2] ufdenberg J.P., Hauschildt P.H., Shore S.N., Baron E., 1997, ApJ, submitted
- [3] assinelli J.P., et al., 1995, ApJ, 438, 932
- [4] rowther P.A., 1997, IAU Symp. 189, Kluwer, in press
- [5] e Koter A., Heap S.R., Hubeny I., 1997, ApJ, 477, 792
- [6] erguson A.M.N., Wyse R.F.G., Gallagher J.S., III, Hunter D.A., 1996 AJ, 111, 2265
- [7] abler R., Gabler A., Kudritzki R.P., Puls J., Pauldrach A. 1989, A&A 226, 162
- [8] roenewegen M.A.T., Lamers H.J.G.L.M., 1991, A&A 243, 429
- [9] üsten R., Mezger P.G., 1982, Vistas Astron., 26, 159
- [10] eiles C., Bon-Chul K., Levenson N.A., Reach W.T., 1996, ApJ, 462, 326
- [11] unter D.A., Gallagher J.S.,III, 1990, ApJ, 362, 480
- [12] unze D., et al., 1996, A&A, 315, L101
- [13] urucz R.L. 1991, in “Stellar Atmospheres: Beyond Classical Models”, NATO ASI Series C, Vol. 341, Eds. L.Crivellari, I.Hubeny, D.G.Hummer, p. 441
- [14] amers H.J.G.L.M., Harzevoort J.M.A.G., Schrijver H., Hoogerwerf, R., Kudritzki R.P., 1997, A&A, in press
- [15] eitherer C., 1997, in “The Stellar Initial Mass Function”, Eds. G. Gilmore, I. Parry, S. Ryan, ASP Conf. Series, in press
- [16] eitherer et al. 1996, PASP , 108, 996
- [17] artin C., Kennicutt R.C., Jr., 1997, ApJ 483, 698
- [18] assey P., 1997, in “The Stellar Initial Mass Function”, Eds. G. Gilmore, I. Parry, S. Ryan, ASP Conf. Series, in press
- [19] assey P., Lang C.C., Degioia-Eastwood K., Garmany C.D., 1995, ApJ 438, 188
- [20] ey M.S., Kennicutt R.C., Jr., 1997, MNRAS, in press
- [21] anagia N., 1973, AJ 78, 929
- [22] auldrach A.W.A., Kudritzki R.P., Puls J., Butler K, Hunsinger J., 1994, A&A, 283, 525
- [23] eynolds R., 1984, ApJ, 282, 191
- [24] chaerer D. 1996, ApJ, 467, L17
- [25] chaerer D., de Koter A., 1997, A&A, 322, 598 (paper III)
- [26] chaerer D., de Koter A., Schmutz W., Maeder A. 1996a, A&A, 310, 837 (paper I)
- [27] chaerer D., de Koter A., Schmutz W., Maeder A. 1996b, A&A, 312, 475 (paper II)
- [28] chaerer D., Vacca W.D.W., 1997, ApJS, in press
- [29] impson J.P., Colgan S.W., Rubin R.H., Erickson E.F., Haas M.R., 1995, ApJ 444, 721
- [30] tasińska G., Schaerer D., 1997, A&A, 322, 615 (paper IV)
- [31] chmutz W., Leitherer C., Gruenwald R., 1992, PASP, 104, 1164
- [32] ellmaier F., Yamamoto T., Pauldrach A.W.A., Rubin H. 1996, A&A , 305, L37
- [33] acca W.D., Garmany C.D., Shull J.M. 1996, ApJ , 460, 914
- [34] ang J., Heckman T.M., Lehnert M.D., 1997, ApJ, in press
- [35] atson A.M., Hanson M.M., 1997, ApJL, in press (astro-ph/9709120)