06 (08.02.1; 08.09.02; 13.25.5)
F. van der Hooft
The quiescence optical light curve of Nova Scorpii 1994 (=GRO J1655–40)††thanks: Based on observations made at the European Southern Observatory, La Silla, Chile
Abstract
We report on extensive V, R, and i band photometry of the black-hole candidate Nova Sco 1994 (GRO J1655–40) obtained during March 1996, when the source was close to its quiescent pre-outburst optical brightness (V=17.3). From our observations and data taken from the literature we derive a refined ephemeris for inferior conjunction of the secondary star: HJD . We have modeled the V, R, and i band light curves in terms of a Roche lobe filling secondary and an accretion disk around the compact star, the latter described as a flat cylinder with a radial temperature distribution. From the shape of the light curve we constrain the binary inclination and mass of the secondary star to lie in the ranges – and 1.60–3.10 M⊙, respectively. This limits the mass of the black-hole to the range 6.29–7.60 M⊙. The mass range we obtained for the secondary star is supported by the results of stellar evolution calculations.
keywords:
(Stars:) binaries: close, individual: Nova Sco 1994 (GRO J1655–40) – X-rays: stars1 Introduction
Soft X-ray transients (SXTs) are low-mass X-ray binaries consisting of a neutron star or black-hole primary, which undergo unstable accretion from a late-type companion. Disk instabilities ([Van Paradijs 1996]) cause brief but violent outbursts, typically lasting weeks to months, during which their X-ray luminosity abruptly increases by several orders of magnitude, to erg s-1. During such an outburst, the optical flux becomes dominated by the contribution of the accretion disk and is enhanced by several magnitudes. In the intervals between outbursts, which typically last years to decades, the X-ray luminosity is extremely low, and the optical flux is dominated by the luminosity of the secondary star (see Verbunt et al. 1994, Van Paradijs & McClintock 1995 and Narayan, McClintock & Yi 1996 for reviews of the quiescence X-ray and optical properties of SXTs). Therefore, the properties of the secondary star can be studied during the quiescent episode.
The SXT Nova Sco 1994 (GRO J1655–40), discovered on 1994 July 27 with BATSE (20–100 keV) on board the Compton Gamma Ray Observatory ([Zhang et al. 1994]), has been studied extensively during the past two years in X-rays and at optical and radio wavelengths (Tingay et al. 1995, Bailyn et al. 1995a, Harmon et al. 1995b, Hjellming & Rupen 1995, Zhang et al. 1995, Bailyn et al. 1995b, Paciesas et al. 1996, Van der Hooft et al. 1997). CCD photometry of Nova Sco 1994 revealed a double-waved modulation of the optical light at a period of 2.6 days ([Bailyn et al. 1995b, Van der Hooft et al. 1997]). Strong evidence that the compact object in Nova Sco 1994 is a black hole was presented by Bailyn et al. (1995b) who established a spectroscopic period of days and a mass function M⊙. The secondary was classified as an F3-F6 IV type star ([Orosz & Bailyn 1997]).
As an SXT, Nova Sco 1994 is remarkable, due to the fast recurrence of its successive X-ray outbursts since the first X-ray detection of the source in 1994. The X-ray outbursts of Nova Sco 1994 were initially separated by intervals of about 120 days ([Zhang et al. 1995]) and lasted many weeks (Harmon et al. 1995a, b; Wilson et al. 1995). During these periods the optical brightness of Nova Sco 1994 was between 1 and 2 magnitudes above its quiescent V=17.3 pre-outburst level ([Bailyn et al. 1995a]), which likely reflects the contribution of the accretion disk and X-ray heating of the secondary star. Most photometric observations of Nova Sco 1994 were made during this period.
However, in the interval 1995 September to 1996 April, no significant X-ray flux was detected from Nova Sco 1994 indicating a (temporary) longer period of quiescence. We present in this paper the results of extensive V, R, and i band photometry of Nova Sco 1994 obtained during 1996 March, and derive its quiescence light- and color curves. We derive limits on the system parameters based on theoretical light- and color curves in the three photometric bands, calculated for a wide range of parameters of a model describing a Roche lobe filling secondary star supplemented with a model of an accretion disk around the compact star. The limits on the mass of the secondary star are compared with theoretical evolutionary tracks which we computed for both single and binary star evolution.
2 Observations and Data Reduction
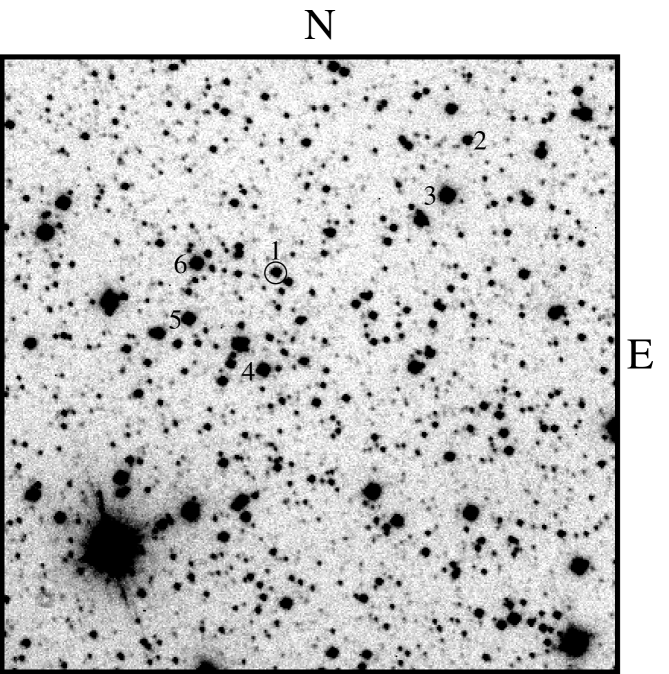
We observed Nova Sco 1994 (GRO J1655–40) during 28 consecutive nights starting 1996 March 5 with the 0.91m Dutch telescope at the European Southern Observatory (ESO) in Chile. The telescope was equipped with a CCD camera and the observations were made using standard V and R filters and a Gunn i filter. Integration times were 10 minutes for the V filter and 5 minutes for the R and i filters. We obtained 67 images of Nova Sco 1994 in the V band, and 69 in the R and i bands each. All images were corrected for the bias, and flat fielded in the standard way. A R-band find chart of the field of Nova Sco 1994 (taken on 1996 March 5), in which Nova Sco 1994 and five nearby comparison stars are indicated, is shown in Fig. 1.
We applied aperture photometry to Nova Sco 1994 and five nearby comparison stars using MIDAS and additionally written software operating in the MIDAS environment. The five comparison stars were checked for variability over the entire data set. From the disperion of the relative magnitudes of each comparison star over the entire observing period ( mag) we conclude that the brightness of these stars is constant. The accuracy of a single measurement of the differential magnitude of Nova Sco 1994 (relative to the average of the five comparison stars), taking into account Poisson noise only, is typically 0.006 mag in each of the three bands.
Photometric calibration of the data was performed using images of two Landolt standard fields ([Landolt 1992]), Rubin 149 (8 stars) and PG 1323 (4 stars), during nights of good photometric quality. Observations of different standard fields within one night showed that the accuracy of the photometric calibration was better then 0.05 mag.
3 Results
3.1 Quiescence light and color curves of Nova Sco 1994
During the period of our observations the average V magnitude of Nova Sco 1994 was 17.25 and the light curve showed a modulation with two equal maxima and unequal minima, whose depths are 0.31 and 0.48 magnitudes. The average V magnitude of Nova Sco 1994 is consistent with the pre-outburst brightness of V=17.3 ([Bailyn et al. 1995b]), which indicates that the source was in quiescence during the period of our observations. During two successive pointings on March 8, separated by hours, we detected a very low optical brightness of Nova Sco 1994 in each of the three filters (for the V-band we then found V=17.48 and V=17.53, respectively).
There is remarkably little variability superposed on the quiescence light curve of Nova Sco 1994 in comparison to several other quiescent SXTs, which show cycle-to-cycle variations of the order of a few percent (McClintock & Remillard 1986, Remillard et al. 1992, Martin et al. 1995, Chevalier & Ilovaisky 1996, Shahbaz et al. 1996). Haswell (1996) has recently suggested that such brightness variations may be similar to those seen in superhumps during superoutbursts of SU UMa type cataclysmic variables.
The data in the three bands were independently searched for periodicities using a Lomb-Scargle periodogram ([Press & Rybicki 1989]). The periodograms show five strong peaks, corresponding to half the orbital period and its one-day aliases, and associated with each peak the characteristic pattern resulting from the data sampling. In each band we found a distinct maximum at a fundamental period of 1.3123 days. Since the light curve of Nova Sco 1994 features two minima with unequal depth, we folded the data on twice this period, using a trial zero point (chosen in the center of the data set). The time of inferior conjunction of the secondary, , was derived from the folded light curve, by fitting a parabola to the shallow minimum, which yielded a phase offset to be applied to the trial zero point. The shallow minimum occurs close to the epoch of inferior conjunction of the secondary star as predicted by the ephemerides of Nova Sco 1994 reported in previous investigations (see e.g. Bailyn et al. 1995b, Van der Hooft et al. 1997).
The photometric period of 2.6246 days of Nova Sco 1994 is slightly longer than previous measurements of the period based on both photometric and spectroscopic observations (see e.g. Bailyn et al. 1995b, Van der Hooft et al. 1997). In order to improve the accuracy of the orbital period we combined 9 photometric measurements of from our 1995 and 1996 data with photometric measurements by Bailyn et al. (1995b) and Orosz & Bailyn (1997), and two spectroscopic measurements by Casares (1996) and Orosz & Bailyn (1997). From a least-squares fit of this set of 13 arrival times to their respective cycle numbers (spanning 140 cycles) we derived the following refined ephemeris for the times of inferior conjunction of the secondary star: HJD , with =2.3 for 11 degrees of freedom. In Fig. 2 we present the V, R and i light curves of Nova Sco 1994 folded at this ephemeris. The drawn lines represent light curves which were computed using a theoretical model of the secondary star which will be described in detail in Sect. 3.2.
We calculated the (V–R), (R–i) and (V–i) color curves using consecutive V, R and i measurements taken close in time ( min). These color indices, folded at the above ephemeris, are displayed in Fig. 3, together with theoretical color curves (see Sect. 3.2). They show a clear modulation with the photometric period. The peak-to-peak amplitudes in the (V–R) and (R–i) color curves are and mag, respectively. The color curves have two unequal maxima and two equal minima. The maxima of the color curves occur near phase 0.0 and 0.5 (the largest occurs near phase 0.5), indicating that Nova Sco 1994 is reddest near conjunctions; the system is bluest near quadratures (phases 0.25 and 0.75).
3.2 Modelling the light curves: ellipsoidal model
To construct theoretical light curves we calculated the flux of the secondary emitted into the direction of the observer as a function of orbital phase, by numerical integration of the contributions from a large number of small elements on the secondary’s surface. We used a numerical model, discussed in detail by Tjemkes et al. (1986), based on a description of the tidal and rotational distortion of the secondary in terms of an equipotential surface. The non-uniform surface brightness distribution across the secondary is described according to Von Zeipel’s theorem. We adopted 0.25 as the value of the gravity darkening coefficient , valid for stars with a radiative envelope ([Von Zeipel 1924]). For each surface element we used a black-body approximation (at the local effective temperature) for the perpendicularly emerging specific intensity. We applied a standard linear limb darkening law, with limb darkening coefficients as a function of temperature taken from Al-Naimy (1978). For the theoretical spectra calculated by Kurucz (1979) one finds that over the effective temperature interval 5500 to 8000 K (covering virtually all surface elements on the secondary) the average deviation of the gradient with respect to the blackbody approximation is % (similar results were obtained for the dependence of and on []). To estimate the effect of our blackbody approximation on our results we have made trial calculations in which the Planck functions were multiplied by an arbitrary function of which accounts for the difference with the Kurucz spectra. We find that the depth of the deepest minimum changes by % (V-band) and % (R and i-band) with respect to the blackbody approximation, while the depth of the shallow minimum changes by % (V-band) and % (R and i-band). These differences are small enough that their effect on the solutions in the plane (see below) can be ignored compared to the effects of uncertainty in the system parameters.
Initially, the possible contribution of an accretion disk to the emergent flux was not included in our modelling, nor were mutual eclipses and the effect of X-ray heating on the secondary. In our calculations we used the secondary mass and the orbital inclination as free parameters. The observed mass function M⊙ ([Bailyn et al. 1995b]) then fixes the primary mass and the mass ratio . Together with the bolometric luminosity of the secondary, the temperature distribution across the latter’s surface, and the light curve, are determined.
We calculated a first set of 81 light curves (and their corresponding color curves) for between (steps of ), and secondary masses in the range M⊙ (steps of 0.5 M⊙). We adopted a bolometric luminosity for Nova Sco 1994 of L L⊙, as determined from the mean V brightness , see Fig. 2), a distance to the system of 3.2 kpc ([Hjellming & Rupen 1995]), a bolometric correction mag (F5 V type star; Popper 1980) and a color excess E(B–V)=1.3 mag ([Horne et al. 1996]). Each of the theoretical light curves were given an offset such that the data observed at the shallow minimum (phase 0.0) was matched. We found that none of these light curves could reproduce the sharp and deep minimum at phase 0.5, indicating that our model requires additional structure. Near this phase the compact object is in front of the secondary star, and the light curve shows significant scatter whereas it is smooth during the remaining part of the orbital cycle. Both the sharpness of the minimum and the increased scatter near phase 0.5 likely result from the presence of an accretion disk around the compact star, which is obscuring (part of) the light of the secondary at this phase. There is no evidence for a disturbance of the light curve near phase 0.0; we therefore, in this first phase of our analysis, computed a for each set of parameters, using the light curves in the three photometric bands simultaneously from which the data obtained between photometric phase 0.35 and 0.65 were excluded.
We found that the only acceptable solutions are for in the range , for any of the secondary masses between 0.5–4.5 M⊙. We made a new set of theoretical light (and color) curves, using a denser grid of and values: ( step size) and M⊙ (0.1 M⊙ step size), respectively.
From the fits of the theoretical to the observed light curves we find that the binary inclination and mass of the secondary star can be well constrained. The contours in the versus plane trace a narrow, ellipse-shaped region. Such a correlation between and is expected as the amplitude of the brightness modulation will decrease with both smaller inclination angles and larger mass of the secondary star (the distortion of the secondary, and therefore the temperature contrast across the stellar surface decreases as increases). A minimal of 2.54 (130 d.o.f.) was found at (, 1.60 M⊙), which indicates that minor variations are present in the light curve in the phase interval 0.65–1.35. The 1, 2 and confidence contours in the plane are shown in Fig. 4, which were computed by scaling the required by the minimum value of .
The assumed value of the bolometric luminosity of the secondary star of Nova Sco 1994 (41 L⊙) is sensitive to errors in both the distance to the source and its color excess. The latter is probably the most important source of uncertainty as the distance is well determined at kpc ([Hjellming & Rupen 1995]) based on a kinematic model of the radio jets; other distance estimates are consistent with this value [3.5 kpc ([McKay & Kesteven 1994]); 3–5 kpc ([Tingay et al. 1995]) both based on H i absorption; kpc ([Bailyn et al. 1995a]) based on interstellar absorption; kpc ([Greiner et al. 1995]) based on a dust scattering halo]. A minimal value of the color excess was reported by Bailyn et al. (1995a) [E(B–V)=1.15 based on the equivalent width of the Na D-lines in optical spectra taken in 1994 August], while a largest E(B–V) of 1.5 was reported by Horne et al. (1996) [based on a power-law spectral fit to UBVRI photometry taken during 1996 May]; deep 220-nm absorption in a HST spectrum of Nova Sco 1994 taken in 1996 May suggested E(B–V) of 1.3 ([Horne et al. 1996]). Therefore, we assumed E(B–V) to lie in the range 1.2–1.4, with the corresponding value of Lopt in the range 31–54 L⊙. We therefore also calculated theoretical light- and color curves for secondary luminosities of 31 (for which we took ), and 54 L⊙ (with ); the steps in were . In all calculations we covered the range M⊙, respectively, with steps of 0.10 M⊙.
From these theoretical light curves we derived ellipse-shaped contours in the versus plane similar to those derived for the curves calculated for L⊙. However, the location of the contours in the plane depends on . For 31 L⊙ the contours shift towards lower binary inclinations, whereas they shift to larger inclination for 54 L⊙. Minimal values (for 130 d.o.f.) were found at (, 1.30 M⊙) [; 31 L⊙], and (, 1.90 M⊙) [; 54 L⊙]. The 1, 2 and confidence contours were computed similar as in the case of 41 L⊙, and are displayed in Fig. 4.
3.3 Inclusion of an accretion disk to the model
The model described in Sect. 3.2 quite well describes the data obtained at inferior conjunction of the secondary star, but not those obtained near superior conjunction, when we observe less light than the model predicts. A natural explanation for the flux deficit near phase 0.5 is that an accretion disk around the compact star obscures part of the secondary at certain viewing angles. In the second stage of our modelling efforts we included an accretion disk in the model, described as a flat cylinder with a radial temperature distribution. The vertical outer edge of the disk is assumed not to emit radiation. By including such an accretion disk the number of parameters in the model is increased by three: the radius of the disk as a fraction of the effective Roche lobe, , the flaring angle of the disk, and the temperature at the outer edge of the disk, . In view of the very low X-ray luminosity of Nova Sco 1994 during the period of our observations, we assumed that the radial temperature distribution in the disk follows an dependence (Pringle 1981).
We computed theoretical light and color curves for intrinsic luminosities of 31, 41 and 54 L⊙, a fractional disk radius between 0.6 and 1.0 (step size of 0.1), outer disk temperatures of 100 or 1000 K, and a flaring angle of the disk of either or . We used step sizes of and 0.1 M⊙ for and , respectively. We performed several tests (using a less dense grid for , and ) in which temperatures at the outer edge of the disk were selected between 100 and 6000 K. Light curves computed with K do not resemble the data well: for such outer edge temperatures the accretion disk contributes too much to the total flux of the system, which decreases the amplitude of the ellipsoidal modulation and changes the relative depth of the minima in the light curve. At superior conjunction of the secondary star, the contribution of the disk to the total flux is for T K, and is entirely negligible for lower values of Tedge. Thus, the main effect of the disk is to occult a fraction of the secondary star near phase 0.5.
In calculating we did not include the six deviating points (two in each of the three passbands) obtained during subsequent pointings on March 8; they must be caused by variations in the disk structure, which cannot be incorporated into our model.
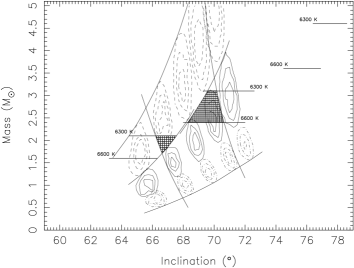
For each set of parameters, the 1, 2 and confidence contours in the diagram were computed as before. The confidence contours corresponding to models having an accretion disk with a flaring angle , and an outer-edge temperature K, are shown in Fig. 5. The top-left panel of this figure displays the confidence contours for L⊙ and fractional disk radii between 0.6 and 1.0. These contours trace narrow ( wide) ellipses in the plane. Since the light curve of Nova Sco 1994 is dominated by ellipsoidal variations (see Sect. 3.2), the ‘islands’ derived for the different fractional disk radii are located in the same general area of the diagram as the contours which were derived from the pure ellipsoidal model (see Fig. 4). As expected, for increasing values of the confidence contours move toward smaller values of .
In the top-right panel of Fig. 5, the confidence contours for intrinsic luminosities of 31 (dashed), 41 (solid) and 54 L⊙ (dashed-dotted) are displayed, with the other parameters unchanged. From this panel it follows that for a given fractional disk size, and intrinsic luminosities between 31 and 54 L⊙ the solutions move along a rather narrow track in the diagram. Solutions for larger secondary masses are found at smaller inclination angles, since an accretion disk of a given relative size can obscure the light of the secondary star at smaller values of as , and therefore, the size of the secondary, increases. In the remainder of our analysis we have assumed that the fractional disk radius is in the range 0.7 to 0.9 (see e.g. Paczyński 1977, and Frank et al. 1992).
We can further constrain the system parameters by noting that the spectral type of the secondary limits the range of its effective temperature (averaged over the secondary surface), and therefore of the secondary radius. Since the secondary is assumed to fill its Roche lobe (this fixes its average density), for a given value of this requirement limits the position of the system in the diagram. The effective temperature decreases with both smaller intrinsic luminosity and larger mass of the secondary star (for a Roche lobe filling secondary the average density depends only on orbital period). The secondary of Nova Sco 1994 has been classified as an F3-F6 type star ([Orosz & Bailyn 1997]). According to Popper (1980), effective temperatures of such stars are in the range 6330–6620 K. The ranges corresponding to this range in average effective temperatures have been indicated for each intrinsic luminosity individually in the top-right panel of Fig. 5. In the bottom-left panel of Fig. 5 this constraint is combined with those obtained from the fitting of the light curves.
For , average effective temperatures of K are obtained for secondary masses of 3.6 M⊙ and higher. This limiting mass is much larger than the maximum mass of the secondary allowed by the disk models for this luminosity. Therefore, taking the mass limit imposed by the average effective temperature of the secondary star into account, we can exclude an intrinsic luminosity of 54 L⊙ for Nova Sco 1994 (see top-right panel of Fig. 5). For the other two intrinsic luminosities, the average effective temperature limits the secondary mass to the range 1.6–2.1 M⊙ (31 L⊙) and 2.4–3.1 M⊙ (41 L⊙), well inside the collection of solutions for these disk models. The combined constraints for these two values of have been indicated by hatched polygons in the lower-left panel of Fig. 5.
Given the smooth variation of the location of the confidence contours in the () plane in response to changes in the fractional disk radius or bolometric luminosity, we connected both hatched areas by smooth curves, thereby producing a final constraint on the system in the plane, which is shown in the lower-right panel of Fig. 5. Note that the final constraint shown in Fig. 5 is derived for the case K and only.
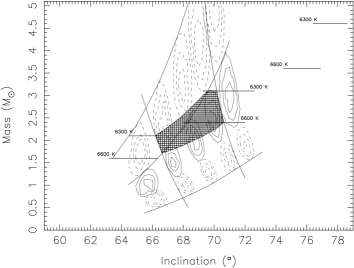
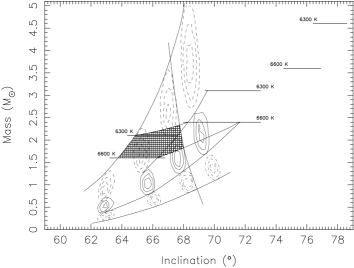
In Fig. 6 we have collected the results of similar analyses for four combinations of outer-edge temperature and flaring angle of the disk: (100 K; ) [top-left panel], (1000 K; ) [top-right panel], (100 K; ) [bottom-left panel], and (1000 K; ) [bottom-right panel]. This figure shows that the solutions corresponding to models for K (right panels) are not shifted much with respect to those for 100 K (left panels). The models with a flaring angle of (bottom panels) are slightly shifted toward lower binary inclination with respect to the models for (top panels).
4 Discussion
4.1 Quiescence light curves
The average V magnitude of Nova Sco 1994 during our March 1996 observations was 17.25, consistent with the pre-outburst brightness of V=17.3 ([Bailyn et al. 1995a]), which indicates that the source was then in quiescence. This is confirmed by X-ray observations of Nova Sco 1994 made with ASCA and ROSAT during March 1996, which showed that its X-ray luminosity then was erg/s (Robinson 1997). No significant X-ray flux of Nova Sco 1994 was detected with RXTE during the period of our observations (3 upper limit of 12 mCrab in the 2–12 keV band); X-rays were first detected from Nova Sco 1994 with RXTE on April 23, 1996 (Remillard et al. 1996).
Also, the smoothness of the V, R and i light curves (spanning 11 consecutive cycles of Nova Sco 1994) is in contrast to earlier reports of significant cycle-to-cycle variations in the Nova Sco 1994 light curve during periods of known X-ray activity ([Bailyn et al. 1995b, Van der Hooft et al. 1997]). The relative depth of the two minima in the light curves of Nova Sco 1994 is consistent with a quiescence optical light curve caused by ellipsoidal variations, the deepest minimum occuring at superior conjunction of the secondary star as expected. The brightening in X-rays in late April 1996 was followed by increased activity at optical, and radio wavelengths (Horne et al. 1996, Hunstead & Campbell-Wilson 1996, Hjellming & Rupen 1996).
We determined a revised ephemeris for inferior conjunction of the secondary star with respect to the black hole by combining our measurements of with those published in other investigations, spanning a total of 140 orbits of Nova Sco 1994. This period differs by from the period we derived previously ([Van der Hooft et al. 1997]), and from the spectroscopic period derived by Orosz & Bailyn (1997).
The colours of Nova Sco 1994 show a double-waved orbital modulation, with amplitudes of in (V–R), in (R–i) and in (V–i). The system is reddest near the conjunctions, bluest at the quadratures. This colour variation reflects the varying temperature across the surface of the secondary; its pronounced appearance is the result of the wavelength and temperature dependence of the limb darkening, which gives relatively low weight to emission from near the apparent horizon of the secondary.
The light curve of Nova Sco 1994 can be understood in terms of a model of a distorted secondary star in combination with an accretion disk. The disk eclipses part of the secondary near phase 0.5, but does not give a significant contribution to the total luminosity of the system. The largest variability in the light curve of Nova Sco 1994 occurs close to phase 0.5, and is most likely caused by variability in the structure of the outer disk, causing variability in the fraction of the secondary that is being eclipsed.
4.2 Mass determination
Our modelling of the light curves has led to constraints on the system parameters, which have been summarized in Fig. 6, in the form of allowed regions in the diagram. These regions incorporate solutions over the full range in bolometric luminosity of the secondary. From Fig. 6 it appears that there is some dependence of the solutions on the assumed value of the flaring angle of the disk, but that it is virtually independent of its temperature structure. The reason is that the light curve away from phase 0.5 does not allow the disk to contribute substantially to the optical emission of the system, which sets an upper limit to its outer temperature of K; for these temperatures the main effect of the disk is to eclipse the secondary. Since for a given value of the fraction of the secondary that is eclipsed increases with , we find an anti-correlation between and for the allowed solutions (compare the top and bottom panels in Fig. 6).
Since the mass function of the system is relatively well determined, a region in the plane allowed by the light curves corresponds to a range of allowed values of the mass ratio and the mass of the compact object in Nova Sco 1994. For we find inclination angles in the range and secondary masses between 1.6 and 3.1 M⊙. This then implies a mass ratio, , and mass of the compact object, , in the ranges 2.43–3.99 and 6.29–7.60 M⊙, respectively. For the allowed ranges of and are , and 1.6–2.45 M⊙, respectively. The corresponding allowed ranges of and are 2.93–4.20 and 6.35–7.18 M⊙, respectively. In Fig. 9 we present the region in the versus plane occupied by the collection of allowed solutions, for a flaring angle of the accretion disk of (solid lines) and (dashed lines).
4.3 Theoretical evolutionary tracks
Since the bolometric luminosity and effective temperature of the secondary are well constrained, it is possible to compare the position of the secondary star of Nova Sco 1994 in the Herzsprung-Russell diagram (HRD) with theoretical evolutionary tracks. We have calculated tracks for both single stars and stars in a binary system with a recent version of the evolution code developed by Eggleton (1971, 1995). The equation of state and the opacity tables have recently been discussed by Pols et al. (1995). The mass loss in the binary calculations was assumed to be conservative and in all calculations we used a metallicity of .
In Fig. 10 we present a HRD with theoretical evolutionary tracks of single stars with masses 2.0, 2.25, 2.5, 3.0, and 4.0 M⊙ (solid lines). Based on this figure, we position the secondary of Nova Sco 1994 on the track for a single star with a mass of M⊙. Assuming a mass of 7 M⊙ for the black hole primary, we obtain an orbital period of about 2.6 days (by adopting a radius for the Roche lobe filling secondary from the evolution track at the center of the error box [see Fig. 10], applying Kepler’s third law and the relation between orbital separation and effective Roche radius of a star). This value is in good agreement with the observed period of 2.62 days. However, this is not the only evolutionary track that fits the observations.
Since the secondary is losing mass, it must have been evolved from an initially more massive star. Therefore, we computed several evolution tracks of the secondary star in a black-hole binary system, for which we adopted in all cases a total system mass of 9.2 M⊙. The effect of a different value for the total system mass (8–11 M⊙) does not change the outcome of our results significantly. It follows from Fig. 10 that a secondary with an initial mass as large as 4.0 M⊙ can also evolve towards the current HRD position of the secondary of Nova Sco 1994. When the tracks of these stars intersect the error box bounded by and , the orbital period and mass are about equal to the case of an evolved single star. This is not surprising as the secondary is less massive than the accreting star, fills its Roche lobe and starts losing mass on the main-sequence. The mass loss then occurs on a nuclear time scale, as is the case for a secondary with an initial mass of 4 M⊙. For the secondaries with lower initial masses, the mass loss starts further on the main-sequence or even at the moment when the secondary is already crossing the Hertzsprung-gap. Since the radius is expanding at a much higher rate, the time scale for mass loss is now smaller than the nuclear time scale, but still a factor of 10 larger than the thermal time scale. For an initial mass of the secondary M⊙, the present mass and orbital period for all tracks of the mass-losing star that cross the center of the error box shown in Fig. 10 are between 2.0–2.3 M⊙ and 2.6–3.1 days, respectively. Therefore, we conclude that the binary nature of Nova Sco 1994 is not very important for the determination of the present mass of the secondary based on evolutionary tracks.
From standard evolutionary calculations for single stars, we find that the tracks of stars with a mass in the range 2.1–2.4 M⊙ are consistent with the current position of the secondary of Nova Sco 1994 in the HRD (see Fig. 10). This method to determine the mass of the secondary star is entirely independent of the constraints derived in Sect. 3.3 from modelling the light curves of Nova Sco 1994. We emphasize that the mass range derived from evolutionary arguments is consistent with that obtained from modelling the light curves.
4.4 Comparison with Orosz & Bailyn (1997)
Our results are consistent with those obtained by Orosz & Bailyn (1997). These authors describe the quiescence light curve of Nova Sco 1994 (obtained during the same period as our data) in terms of an ellipsoidal model and an accretion disk. The main differences between their analysis and the one discussed here are the value of the power-law exponent of the radial temperature distribution on the accretion disk (fixed to –0.75 in this work, free parameter in the analysis by Orosz & Bailyn 1997), and the use of the temperature at the pole of the secondary star as input parameter (fixed to 6500 K, Orosz & Bailyn 1997), in contrast to a range of intrinsic luminosities (31, 41, and 54 L⊙, this work) as input to our model.
The best fitting values of and ( statistical errors) found by Orosz & Bailyn (1997), combined with the mass function imply a secondary and black hole mass of and M⊙, consistent with our results. Also, the values for the fractional disk size (), and angular thickness of the disk () derived by Orosz & Bailyn (1997) are consistent with the results discussed here for the case of a thin () accretion disk. However, our analysis shows that models with an accretion disk of angular thickness are also able to describe the data well. The contribution of the accretion disk to the total luminosity is governed by its fractional size and mean temperature, and therefore, by the temperature at the outer edge of the disk and the radial temperature distribution on the disk. Orosz & Bailyn (1997) derived an outer edge temperature of K, significantly larger than the value we derived from our analysis. This probably reflects the different value of the power law exponent between both analyses; in our analysis the exponent was kept fixed to –0.75 (Pringle 1981), while Orosz & Bailyn (1997) treated the exponent as a free parameter and obtained a value of . However, it should be noted that in both analyses the contribution of the disk to the total luminosity of the system is less than , consistent with the value derived from spectroscopy during 1996 February (Orosz & Bailyn 1997).
The errors quoted by Orosz & Bailyn (1997) are internal statistical errors, derived from fitting the light curves of Nova Sco 1994. Note however, that in our analysis we have included errors caused by systematic uncertainties in the properties of the system, e.g. in the interstellar absorption its light suffers. Therefore, we allow for a range of intrinsic luminosities of Nova Sco 1994 (31–54 L⊙). We also allow a range of values for the parameters describing the size and temperature of the accretion disk (, and K), and adopt the confidence contours (see Fig. 6). Therefore, the limits to the system parameters we have derived in this study are somewhat larger compared to those obtained by Orosz & Bailyn (1997).
4.5 Systematic effects
In our modelling of the light curve of Nova Sco 1994 we have made a number of implicit assumptions, e.g., with respect to the geometry of the disk, and such assumptions may affect the results of our analysis systematically. There is one assumption whose systematic effect is particularly strong, i.e., that the non-uniform temperature distribution across the surface of the secondary can be described by a standard gravity darkening coefficient . This value applies in a situation where the outer layers of a star are in radiative equilibrium. For stars with convective outer layers Lucy (1967) derived a gravity darkening coefficient of 0.08. At its spectral type (F3-F6) the secondary of Nova Sco 1994 is near the boundary in the Hertzsprung-Russell diagram separating hot stars with radiative envelopes and cool stars with convective envelopes. Therefore, it may contain a shallow convective layer. We have investigated the applicability of standard gravity darkening by computing light curves for in the range 0.08 to 0.25 (in steps of 0.01). Decreasing leads to a decrease in the brightness contrast over the secondary’s surface, and therefore to a decrease of the amplitude of the light curve. Since the amplitude increases with the strongest limits on are obtained for . For an assumed M⊙ and L⊙ (near the center of our solution space) we derive a lower limit on the gravity darkening coefficient. This suggests that the assumption is justified.
5 Conclusion
We conclude that during our March 1996 observations Nova Sco 1994 was in a state of true X-ray quiescence. We derive a refined ephemeris for inferior conjunction of the secondary star with respect to the compact star of HJD . We calculated theoretical light- and color curves, which constrain the binary inclination and mass of the secondary star to lie in the range and 1.60–3.10 M⊙, respectively. The implied mass of the black-hole is in the range 6.29–7.60 M⊙. We find that an accretion disk is required to model the light- and color curve of Nova Sco 1994. The disk does not contribute significantly to the luminosity, and therefore, acts as body of obscuration only. The mass range we obtained for the secondary star is supported by the results of stellar evolution calculations.
Acknowledgements.
The authors thank F. Kemper for her help in obtaining the observations. FvdH acknowledges support by the Netherlands Foundation for Research in Astronomy with financial aid from the Netherlands Organisation for Scientific Research (NWO) under contract number 782-376-011.References
- [Al-Naimy 1978] Al-Naimy H.M. 1978, Ap & SS 53, 181
- [Bailyn et al. 1995a] Bailyn C.D., Orosz J.A., Girard T.M., et al. 1995a, Nat. 374, 701
- [Bailyn et al. 1995b] Bailyn C.D., Orosz J.A., McClintock J.E., Remillard R.A. 1995b, Nat. 378, 157
- [Casares 1996] Casares J. 1996, priv. comm.
- [Chevalier & Ilovaisky 1996] Chevalier C., Ilovaisky S.A. 1996, A&A 312, 105
- [Eggleton 1971] Eggleton P.P., 1971, MNRAS 151, 351
- [Eggleton 1995] Eggleton P.P., 1995 priv. comm.
- [Frank, King,& Raine 1992] Frank J., King A., Raine D. 1992, Accretion Power in Astrophysics (Cambridge: Cambridge University Press)
- [Greiner et al. 1995] Greiner J., Predehl P., Pohl M. 1995, A&A 297, L67
- [Harmon et al. 1995a] Harmon B.A., Zhang S.N., Paciesas W.S., Fishman G.J. 1995a, IAU Circ. 6147
- [Harmon et al. 1995b] Harmon B.A., Wilson C.A., Zhang S.N., et al. 1995b, Nat. 374, 703
- [Haswell 1996] Haswell C. 1996, in: Compact Stars in Binaries; Proceedings of IAU Symposium 165, eds. E.P.J. Van den Heuvel, J. Van Paradijs, & E. Kuulkers (Dordrecht: Kluwer Academic Publishers), 351
- [Hjellming & Rupen 1995] Hjellming R.M., Rupen M.P. 1995, Nat. 375, 464
- [Hjellming & Rupen 1996] Hjellming R.M., Rupen M.P. 1996, IAU Circ. 6411
- [Horne et al. 1996] Horne K., Harlaftis E.T., Baptista R., et al. 1996, IAU Circ. 6406
- [Hunstead & Campbell-Wilson 1996] Hunstead R., Campbell-Wilson D. 1996, IAU Circ. 6410
- [Kurucz 1979] Kurucz R.L. 1979, ApJS 40, 1
- [Landolt 1992] Landolt A.U. 1992, AJ 104, 340
- [Lucy 1967)] Lucy L.B. 1967, Z. Astrophysik 65, 89
- [Martin et al. 1995] Martin A.C., Casares J., Charles P.A., Van der Hooft F., Van Paradijs J. 1995, MNRAS 274, L46
- [McClintock & Remillard 1986] McClintock J.E., Remillard R.A. 1986, ApJ 308, 110
- [McKay & Kesteven 1994] McKay D., Kesteven M. 1994, IAU Circ. 6062
- [Narayan, McClintock & Yi 1996] Narayan R., McClintock J.E., Yi I. 1996, ApJ 457, 821
- [Orosz & Bailyn 1997] Orosz J.A., Bailyn C.D. 1997, ApJ 477, 876
- [Pols et al. 1995] Pols O.R., Tout C.A., Eggleton P.P., Han Z. 1995, MNRAS 274, 964
- [Paciesas et al. 1996] Paciesas W.S., Zhang S.N., Rubin B.C., et al. 1996, in: Compact Stars in Binaries; Proceedings of IAU Symposium 165, eds. E.P.J. Van den Heuvel, J. Van Paradijs, & E. Kuulkers (Dordrecht: Kluwer Academic Publishers), 363
- [Paczyński 1977] Paczyński B. 1977, ApJ 216, 822
- [Popper 1980] Popper D.M. 1980, ARAA 18, 115
- [Press & Rybicki 1989] Press W.H., Rybicki G.B. 1989, ApJ 338, 277
- [Pringle 1981] Pringle J.E. 1981, ARAA 19, 137
- [Remillard, McClintock & Bailyn 1992] Remillard R.A., McClintock J.E. Bailyn C.D. 1992, ApJ 399, L145
- [Remillard et al. 1996] Remillard R., Bradt H., Cui W., et al. 1996, IAU Circ. 6393
- [Robinson 1997] Robinson C., 1997, in prep.
- [Shahbaz et al. 1996] Shahbaz T., Van der Hooft F., Charles P.A., Casares J., Van Paradijs J. 1996, MNRAS 282, L47
- [Tingay et al. 1995] Tingay S.J., Jauncey D.L., Preston R.A., et al. 1995, Nat. 374, 141
- [Tjemkes, Zuiderwijk, & Van Paradijs 1986] Tjemkes S.A., Zuiderwijk E.J., Van Paradijs J. 1986, A&A 154, 77
- [Van der Hooft et al. 1997] Van der Hooft F., Groot P.J., Shahbaz T., et al. 1997, MNRAS 286, L43
- [Van Paradijs & McClintock 1995] Van Paradijs J., McClintock J.E. 1995, in: X-ray Binaries, eds. W. H. G. Lewin, J. Van Paradijs, & E. P. J. Van den Heuvel (Cambridge: Cambridge University Press), 58
- [Van Paradijs 1996] Van Paradijs J. 1996, ApJ 464, L139
- [Verbunt et al. 1994] Verbunt F., Belloni T., Johnston H.M., Van der Klis M., Lewin W.H.G. 1994, A&A 285, 903
- [Von Zeipel 1924] Von Zeipel H. 1924, MNRAS 84, 665
- [Wilson et al. 1995] Wilson C.A., Harmon B.A, Zhang S.N., Paciesas W.S., Fishman G.J. 1995, IAU Circ. 6152
- [Zhang et al. 1994] Zhang S.N., Wilson C.A., Harmon, B.A., et al. 1994, IAU Circ. 6046
- [Zhang et al. 1995] Zhang S.N., Harmon B.A, Paciesas W.S., Fishman G.J. 1995, IAU Circ. 6209