New Results for Two Optically Faint Low Mass X-Ray Binary Systems
Abstract
We present optical photometry of the low mass X-ray binary systems GX 349+2 (=X1702-363) and Ser X-1 (=X1837+049). Extensive photometry of the faint optical counterpart () to GX 349+2 reveals a period of h and half-amplitude 0.2 mag. This result confirms and extends our previously reported 22 h period (Wachter & Margon 1996). No color change is detected over the orbit, although the limits are modest. We also report the discovery of two new variable stars in the field of GX 349+2, including a probable W UMa system.
Ser X-1 is one of the most intense persistent X-ray burst sources known. It is also one of only three burst systems for which simultaneous optical and X-ray bursts have been observed. The faint blue optical counterpart MM Ser () has long been known to have a companion 2.1″ distant. Our images indicate that MM Ser is itself a further superposition of two stars, separated by only 1″. At the very least, the ratio of inferred burst to quiescent optical flux is affected by the discovery of this additional component. In the worst case, the wrong object may have previously been assumed as the optical counterpart.
keywords:
stars: individual (GX 349+2, MM Ser) — stars: variables: other — X-rays: stars1 Introduction
Little is known about the faint optical counterpart () of the bright bulge Z-source GX 349+2. The one published spectrum of the counterpart is of both low resolution and quality (Penninx & Augusteijn 1991) and only shows a strong H emission line. From the first photometric study of the system we reported the detection of a possible h period (Wachter & Margon 1996, hereafter Paper I). At the same time, Southwell et al. (1996) suggested a period of 14 d for GX 349+2 from an analysis of the H emission line velocities. In order to resolve this ambiguity and better determine the orbital period we undertook a second monitoring campaign of the system.
Ser X-1 is one of the most intense persistent X-ray burst sources known. It was discovered in X-rays in 1965 (Friedman, Byram & Chubb 1967) and to be a burst source in 1975 (Swank et al. 1976). A faint blue star of was suggested as the optical counterpart by Davidsen (1975). Thorstensen, Charles & Bowyer (1980), hereafter TCB, resolved the Davidsen candidate (star D) into two stars (DN and DS) separated by 2.1″. The southern component, now known as MM Ser, which TCB proposed as the X-ray source counterpart, is the bluer of the two stars and possibly exhibits a weak HeII 4686 emission line, although the published spectra are quite noisy. There has been no detailed photometric study of Ser X-1.
The optical identification of Ser X-1 is especially important as it is one of only three low mass X-ray binaries (LMXBs) (the others being X1636-536 and X1735-444) for which simultaneous optical and X-ray bursts have been observed (Hackwell et al. 1979). The optical burst is thought to be due to reprocessing of the X-ray burst in matter in the close vicinity of the neutron star, either the accretion disk or the atmosphere of the companion.
2 Observations
CCD photometry of GX 349+2 and Ser X-1 was performed with the CTIO 0.9 m telescope from 1996 July 10 UT to July 15 UT. A Tek 2048 CCD was used at an image scale of 0.40″ pixel-1. A summary of the observations of GX 349+2 is provided in Table 3.1. , , and refer to the number of , and frames obtained during each night. Exposure times for GX 349+2 were typically 600 s (), 400 s (), 300 s () and 600 s for Ser X-1. Overscan and bias corrections were made for each CCD image with the task quadproc at CTIO to deal with the 4 amplifier readout. The data were flat-fielded in the standard manner with IRAF.
Due to the crowded field photometry was performed by point spread function (PSF) fitting with DAOPHOT II (Stetson 1993). The instrumental magnitudes were transformed to the standard system through observations of four Landolt standard star fields (providing 20 standard stars) on one of the nights (Landolt 1992). Using the standardized photometry from the photometric night, we selected nine local standard stars in a 3.5′3.5′ field around GX 349+2 and Ser X-1. Stars were chosen as local standards if they were uncrowded and relatively bright. We then performed relative photometry of GX 349+2 and derived standardized magnitudes with respect to each local standard, including corrections for color terms. Finally, we computed the mean and standard deviation of the nine estimates, using a 3 clipped mean to remove outliers. The magnitudes for GX 349+2 and two comparison stars are listed in Table 3.1; the magnitudes for Ser X-1 and comparison stars in Table 3.1.
The external 1 error (from the transformation to the standard system) is about 0.03 mag. Intrinsic errors were calculated by computing the average rms scatter in the light curves of all non-variable stars in the field. In the magnitude range , this intrinsic 1 error is 0.01 mag, and in the range , 0.01–0.025 mag.
3 GX 349+2
The band light curves for GX 349+2 and a slightly fainter comparison star (star 5) are displayed in Figure 1. For the star designations refer to the finding chart in Paper I. The magnitude of the comparison light curve has been shifted to fainter magnitudes by 0.2 mag to separate the two curves for display purposes. The pronounced variability of GX 349+2 is clearly evident on each night.
The data were searched for periodic behavior with a power spectrum analysis using the CLEAN algorithm (Roberts et al. 1987). After 10 iterations of CLEAN with a gain of 0.2, the cleaned power spectrum exhibits a single strong peak at h (Figure 2). We searched the period range around this peak according to the procedure described in Paper I. The resulting best period and error is h, confirming and refining our previous period estimate. A period search carried out with the phase dispersion minimization algorithm PDM in IRAF arrives at the same period. The 1 d alias of our 22.5 h period is 15.0 days, which is close to the 14 d period reported by Southwell et al. (1996). Their period of day corresponds to the 1 day alias of h, and this may explain their reported periodicity.
In addition to the July 1996 data, supplementary data of GX 349+2 were obtained by E. W. Deutsch and B. Margon about three weeks earlier (June 1996). When the above period analysis is repeated with the combined data set, the formal best period and error are h. However, the June data are very sparsely sampled (see Table 3.1) and the source displays considerable intrinsic scatter in the folded lightcurve (Figure 3). In fact, there is no obvious preferred period when comparing the data folded on periods between 22.4 – 22.6 h, so that the precision in the above period seems overly optimistic. Consequently, we adopt 22.5 h as our best period estimate for the following discussion.
Figure 3 shows our photometric data folded on the best period of 22.5 h and fitted with a sine wave. Filled circles mark the July 1996 data, open circles represent the June 1996 data. Two cycles are shown for clarity. The sine fit gives a half-amplitude of 0.20 mag for the variations, comparable to that reported in Paper I. Erratic flickering is evident in the light curve, as is often observed in LMXBs.
The refinement of the period of course does not alter the conclusions reached in Paper I with respect to the mass function or the components of the binary. If we assume our 22.5 h period to be the orbital period of the system (although it could also be half the orbital period) and if the Southwell et al. (1996) spectroscopic observations define the true radial velocity semi-amplitude of the system ( km s-1), then the implied mass function is M⊙ (essentially identical to the estimate in Paper I). Of course one has to be cautious when deriving mass functions from emission line velocity curves for these interacting systems. The emission lines are commonly thought to originate in the accretion disk. If this emission is asymmetric, then the observed radial velocity along a given line of sight will combine components of the orbital velocity of the system and the rotational velocity around the central object of the emitting material in the disk. GX 349+2 appears to be very similar to Sco X-1, where the period and mass function are 18.9 h and M⊙ (Cowley & Crampton 1975), respectively. Considerable similarity in the X-ray properties of Sco X-1 and GX 349+2 had been noted for some time (Schulz, Hasinger, & Trümper 1989), and this has recently been extended in a more detailed study (Kuulkers et al. 1997).
We obtained the photometric data in several filters in order to investigate any color changes of the system across the orbit as might be expected from X-ray heating. Figure 4 shows our data in the different bands folded on the best period of 22.5 h. We derived the colors (, and ) by first binning the light curve for each band into phase bins of 0.05. We calculated the mean magnitude and standard deviation in each phase bin for each filter; the appropriate magnitudes were then subtracted. The errors in each phase bin were estimated by adding in quadrature the magnitude errors of the two filters. For bins with only one measurement, the error in the photometry was assigned. The result is displayed in Figure 5.
Within the errors there is no obvious change in color across the orbit. The error bars are fairly large, partly due to flickering and partly due to the limited number of observations in each phase bin. Unfortunately, the colors considered here () are not ideal to detect color variations. Even for systems that show significant color changes due to strong X-ray heating in and (e.g. Her X-1/HZ Her), almost no variability is visible in (Kilyachkov et al. 1994). Due to the fairly large amount of extinction towards GX 349+2 it will be very difficult to obtain accurate photometry for the system with a small telescope.
We have measured equatorial coordinates for GX 349+2 and several other objects discussed in this paper by transferring the astrometric information contained in a digitized sky survey (DSS) reference frame to one of our CCD images. This was accomplished with software written in interactive data language (IDL) by E. W. Deutsch or available in the IDL Astronomy User’s Library (Landsman 1993). The DSS astrometric reference frame is transferred to the CCD Image with a error of 0.06″. However, there may be some systematic offset () from frames based on other reference catalogs (Russell et al. 1990). The results are listed in Table 3.1. The previously published optical position for GX 349+2 was accurate only to 1″ in each coordinate (Cooke & Ponman 1991). Our improved position agrees extremely well with the radio position given by Cooke & Ponman (1991), which is also quoted in Table 3.1.
3.1 New Variables
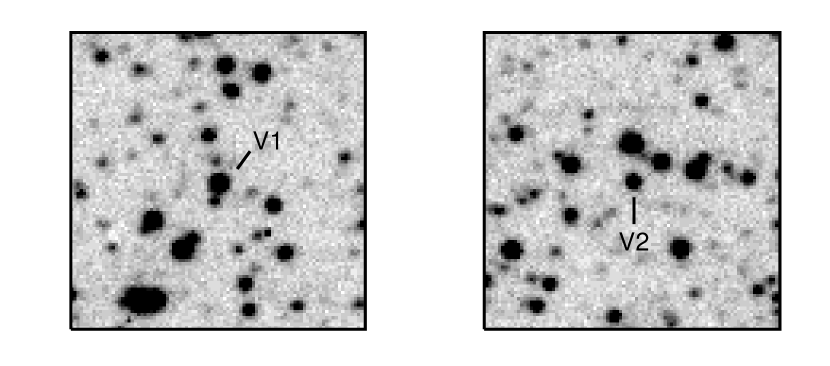
We searched the 3.5′3.5′ field around GX 349+2 for new variable stars. For this purpose, we computed standardized magnitudes and the rms of these magnitudes over the observing run for all stars in the field. Stars with an uncharacteristically large rms in the magnitude versus rms diagram were identified as candidate variables. We then inspected the light curves of these candidates to exclude spurious detections. This resulted in the discovery of two new variables, designated V1 and V2, which were not found in a search of the SIMBAD database. Figure 6 shows an band finding chart for each variable, and coordinates appear in Table 3.1.
The magnitudes of these new variables were standardized analogous to the procedure outlined above for GX 349+2 and are listed in Table 3.1. We searched the data for periods using the phase dispersion minimization task PDM in IRAF. Our best estimate for the periods are P h and P h. The errors were estimated by folding the data on a series of nearby periods and judging at what point the quality of the light curve is significantly compromised.
Figures 7 and 8 show the light curves folded on the best periods for V1 and V2, respectively. The light curve of V2 suggests that it is a W Ursae Majoris star, i.e., an eclipsing contact binary. Our best period estimate is also typical for W UMa stars. Without any further knowledge about what causes the brightness variation in V1 it is impossible to decide whether our period is the orbital or half the orbital period, i.e., whether the light curve is single or double peaked.
4 Ser X-1
Although there is a wealth of information on the X-ray properties of Ser X-1, very little is known about the optical counterpart, MM Ser. Since the study of TCB, the only recently published optical observations are two spectra of MM Ser. The spectrum by Cowley, Hutchings & Crampton (1988) is very noisy and its only feature is possibly He II . A spectrum by Shabaz et al. (1996)111Note that the separation between DN and DS is erroneously given as 12″ in that reference. only shows an absorption feature at which might be associated with a G star secondary. These authors determine the best fit to the spectrum to be that of a G5V star with E()=0.41. The absence of H absorption in the spectra of Cowley, Hutchings & Crampton (1988) and Shabaz et al. (1996) seems to indicate that the detection of H absorption by TCB is due to contamination by the northern component.
There has been no published photometric study of MM Ser, and no optical variability (other than the simultaneous optical and X-ray burst) has been reported. TCB find no evidence for variability with a conservative limit of mag (on six plates with 30 min time resolution). In order to search for variability and possibly determine the period of the system we obtained several images of MM Ser in July 1996.
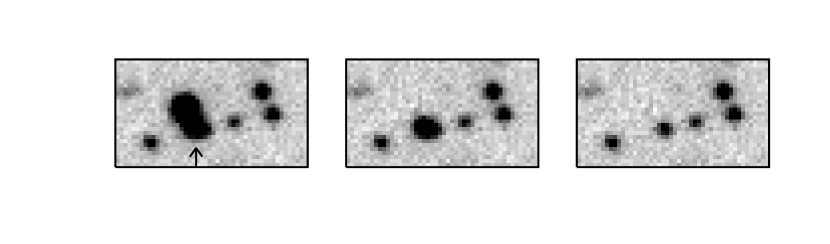
Due to the close companion, photometry was again performed by PSF fitting with DAOPHOT II. Our imaging reveals that MM Ser appears to be itself a further superposition of two stars. The leftmost image in Figure 9 shows a small portion of an band image of the field of Ser X-1. Notice the clear separation of the components DN and DS. In the central image, PSF fitting is used to remove the northern, unrelated component of the pair. Note the east-west asymmetry of the remainder, as compared with nearby stars. Another PSF fit and subtraction reveals that MM Ser is itself composite, consisting of two components. In order to determine the separation of these components, we calculated the mean separation of all three stars from each other from the images with the best seeing conditions, using the positions provided as part of the PSF fitting by DAOPHOT II. The separation between DN and the eastern component of DS (DSe) is ″, and the separation between the eastern and western (DSw) components of DS is ″.
The magnitudes for the different components of star D and for several comparison stars are listed in Table 3.1. The nomenclature is that of TCB. The magnitudes for the comparison stars listed in TCB agree very well with our photometry. However, the comparison star magnitudes differ by several tenths of a magnitude. The reason for this difference is not clear. TCB do not give magnitudes for DN or DS, and only list a range of 17.9–18.9 in for DS.
Although DS can clearly be separated into two components with PSF fitting, the variable PSF parameters make any photometry of the individual components DSe and DSw very uncertain. Therefore, we searched for variability in MM Ser by removing all stars in its vicinity (including component DN) and subsequently performing aperture photometry on DS, now known to be the sum of two stars. The resulting photometry of DS from all frames is displayed in Figure 10. Also shown is a comparison star of the same brightness which has been shifted by 0.25 mag to fainter magnitudes to separate the light curves. MM Ser clearly shows variability of about 0.2 mag over several days and possibly variability during each night, although we cannot state which of the two close objects is responsible. We stress that this conclusion of variability in one of the two components of MM Ser (DSe and DSw) is from aperture photometry of the sum of these near-blended images, and thus does not rely on the result of an uncertain subtraction.
According to our photometry, the two components of DS (DSe and DSw) differ by mag in . DSe appears to be the bluer object, so one might speculate that this component is in fact the optical counterpart. The close companion may severely influence spectral and radial velocity investigations of the system. For example, it is possible that the H absorption observed by TCB originated from one of the superpositions instead of the optical counterpart (as already mentioned above), which could result in misleading mass estimates for the system, as may also be true for the same reason for the X-ray binary CAL 87 (Deutsch et al. 1996). The identification of the correct optical counterpart is also especially important for the analysis of the burst behavior, which requires the knowledge of the correct quiescent flux of the system. Further, accurate multicolor photometry in very good seeing conditions might be capable of clarifying this situation.
Acknowledgements.
We thank Eric Deutsch and Bruce Margon for obtaining some of the observations of GX 349+2, and Bruce Margon for reading a draft of this paper and providing helpful comments. This research was in part supported by NASA grant NAG5-1630, and has made use of the Simbad database, operated at CDS, Strasbourg, France.References
- (1)
- (2) Cooke, B. A., & Ponman, T. J. 1991, A&A, 244, 358
- (3)
- (4) Cowley, A. P., & Crampton, D. 1975, ApJ, 201, L65
- (5)
- (6) Cowley, A. P., Hutchings, J. B., & Crampton, D. 1988, ApJ, 333, 906
- (7)
- (8) Davidsen, A. F. 1975, IAU Circ. 2824
- (9)
- (10) Deutsch, E. W., Margon, B., Wachter, S. & Anderson, S. F. 1996, ApJ, 471, 979
- (11)
- (12) Friedmann, H., Byram, E. & Chubb, T. 1967, Science, 156, 374
- (13)
- (14) Hackwell, J. A., Grasdalen, G. L., Gehrz, R. D., van Paradijs, J., Cominsky, L. & Lewin, W. H. G. 1979, ApJ, 233, L115
- (15)
- (16) Kilyachkov, N. N., Shevchenko, V. S., Yakubov, S. D., Ezhkova, O. V., Kondrat’ev, V. B., & Protnov, D. L. 1994, Astron. Letters, 20, 569
- (17)
- (18) Kuulkers, E., van der Klis, M., Oosterbroek, T., van Paradijs, J., & Lewin, W. H. G. 1997, MNRAS, in press
- (19)
- (20) Landolt, A. U. 1992, AJ, 104, 340
- (21)
- (22) Landsman, W. B. 1993, in ASP Conf. Ser. 52, Astronomical Data Analysis Software and Systems II, eds. R. J. Hanisch, R. J. V. Bissenden & J. Barnes (San Francisco: ASP), 256
- (23)
- (24) Penninx, W., & Augusteijn, T. 1991, A&A, 246, L81
- (25)
- (26) Roberts, D. H., Lehar, J., & Dreher, J. W. 1987, AJ, 93, 968
- (27)
- (28) Russell, J. L., Lasker, B. M., McLean, B. J., Sturch, C. R., & Jenkner, H. 1990, AJ, 99, 2059
- (29)
- (30) Schulz, N. S., Hasinger, G., & Trümper, J. 1989, A&A, 225, 48
- (31)
- (32) Shabaz, T., Smale, A. P., Naylor, T., Charles, P. A., van Paradijs, J., Hassall, B. J. M., & Callanan, P. 1996, MNRAS, 282, 1437
- (33)
- (34) Southwell, K. A., Casares, J., & Charles, P. A. 1996, in Cataclysmic Variables and Related Objects, IAU Colloq. 158, A. Evans & J. H. Wood (eds.) (Dordrecht: Kluwer), 365
- (35)
- (36) Stetson, P. B. 1993, DAOPHOT II User’s Manual
- (37)
- (38) Swank, J., Becker, R., Pravdo, S. & Serlemitsos, P. 1976, IAU Circ. 2963
- (39)
- (40) Thorstensen, J. R., Charles, P. A. & Bowyer, S. 1980, ApJ, 238, 964 (TCB)
- (41)
- (42) Wachter, S. & Margon, B. 1996, AJ, 112, 2684
- (43)


![[Uncaptioned image]](/html/astro-ph/9709045/assets/x11.png)
![[Uncaptioned image]](/html/astro-ph/9709045/assets/x12.png)
![[Uncaptioned image]](/html/astro-ph/9709045/assets/x13.png)