Deep photometric study of the region of the –ray burst localization of June 13, 1979.
Abstract
In the framework of the hypothesis on potential sources of some –ray bursts being single compact objects of neutron star type with finite surface temperature in the vicinity of the Sun a method of search in the optical range for a corresponding candidate in the region of a powerful short burst localization is considered. The localization region of the GRB 790613 event is studied in the B, V and R filters. and colors of 196 objects with a are measured up to the average practical photometric limit for the whole obtained mosaic of CCD images. No blue objects with and were found up to , which can be interpreted as the absence of a compact object with a temperature in this direction up to a distance pc. A probable common upper limit to the temperature of the supposed compact objects in the vicinity of the Sun is indicated based on the accumulated optical and X–ray data. The study of blue () objects in the smallest (in the northern sky) –ray box GRB790613, in view of the results of the search for point–like sources in the soft X–ray in the localization regions of bright –ray bursts, does not exclude the existence of such “cold” () objects, which could give an essential contribution to the observed density of hidden matter close to the Sun and some of them could be related with the closest sources of –ray bursts. Several interesting objects were also found in (or near) the localization region of the GRB 790613 event.
Key words: gamma rays: bursts — deep optical search
1 Introduction
Here we define the strategy of search for optical candidates for the sources of –ray bursts first of all as a direct test of their galactic origin, in particular, allowing for the fact that potential sources of some part of the observed bursts can be objects of hidden mass in the Galaxy. It is evident that deep optical observations with consideration of observations in other wavelength ranges must reduce the number of theoretic variants explaining the bursts, at least for a chosen class of galactic models discussed in the literature (Boer et al., 1993; Greiner et al., 1995; Hartmann, 1994).
Formulating below the statement of an observational problem at the 6 m telescope, we mean single compact objects of neutron star type cooled down to a temperature and lower. Analogous considerations have already been used in the literature in interpretation of the results of deep photometric study of several –ray boxes (Hartmann et al., 1989; Motch et al., 1990). Ultimately, in any galactic model of the sources of –ray bursts, in which attempts of allowing for new data have been made, a problem can be stated of search for closest objects in other wavelength ranges. In this case we are concerned with the sources of short –ray bursts, that show a power law at high intensities (Kouveliotou et al., 1993). In particular, these can be optical objects of low luminosity related to these bursts and having a density distribution in the B, V, R bands close to that of a black body. With the help of deep CCD photometry of the localization region of the –ray burst GRB 790613 we will show which distance limitation can be obtained from direct optical observations. In so doing we will use basically only the assumption of compact character of the supposed potential source of a –ray burst and the fact that the number of such objects in the vicinity of the Sun can not be greater than it is allowed by the estimates of hidden mass density. Further we use also the results of surveys and point–like observations in the soft X–rays by the ROSAT satellite.
Apparently, similar objects, single pulsars Geminga and PSR 0656+14 with relatively low surface temperatures and probably situated in the vicinity of the Sun have already been observed in the optical (Halpern & Tytler, 1988; Caraveo et al., 1994) as sources of . By the example of one of the most powerful –ray bursts — the short event GRB 790613 localized with the help of several space detectors with the best (in the northern sky) accuracy (Barat et al., 1984), whose localization error box has already been studied very well in the X–rays (see Greiner et al., 1995; and ROSAT X–ray Images, 1994a) and in the optical range (Ricker et al., 1986; Harrison et al., 1994; Vrba et al., 1995), and supplementing these data with our own deep optical observations of the –ray box GRB 790613, we will show here that an object of blue optical candidate type for Geminga can, in principle, be detected in study of such an IPN –box in the three standard filters B, V, R.
In Section 2 the statement of a problem of the deep CCD photometric search for weak blue stellar–like objects in relatively small –ray boxes at the 6 m telescope is expounded. The obtained photometric data for the GRB 790613 event field are adduced in Section 3.2. The method of photometric search for such objects in the –ray box GRB 790613, which are “black body”–like by BVR, and the discussion of the results of deep optical observations of this box are presented in Section 3.3. The estimates of a probable value of proper motions per year for all objects up to are presented in Section 3.4. Section 3.5 is devoted to some other interesting objects found in (or near) the region of localization of the GRB 790613 event.
| I | II | III | IV | V | VI |
|---|---|---|---|---|---|
| 13.04.94 | |||||
| 23:13 | I B | 600 | 1.7 | 22.71 | 35.1 |
| 23:55 | II B | 600 | 1.45 | 22.67 | 35.5 |
| 00:25 | III B | 600 | 1.31 | 22.65 | 36.0 |
| 00:51 | IV B | 600 | 1.11 | 22.58 | 37.0 |
| 23:02 | I V | 600 | 1.47 | 21.83 | 35.7 |
| 23:33 | II V | 600 | 1.40 | 21.82 | 35.2 |
| 00:14 | III V | 600 | 1.14 | 21.79 | 35.8 |
| 00:39 | IV V | 600 | 1.08 | 21.72 | 36.4 |
| 2.06.94 | |||||
| 19:12 | I R | 600 | 1.70 | 36.5 | |
| 19:32 | II R | 600 | 1.63 | 37.1 | |
| 19:51 | III R | 600 | 1.83 | 37.5 | |
| 20:13 | IV R | 600 | 2.14 | 38.0 | |
| 29.12.94 | |||||
| 02:18 | c B | 500 | 1.59 | 22.70 | 37.9 |
| 02:45 | c B | 500 | 1.63 | 22.66 | 37.1 |
| 03:14 | c B | 500 | 1.56 | 22.11 | 36.3 |
| 02:27 | c V | 500 | 1.47 | 21.81 | 37.6 |
| 02:54 | c V | 500 | 1.59 | 21.71 | 36.7 |
| 03:23 | c V | 500 | 1.77 | 21.10 | 36.3 |
| 02:36 | c R | 400 | 1.41 | 20.54 | 37.3 |
| 03:03 | c R | 400 | 1.37 | 20.38 | 36.5 |
| 03:32 | c R | 400 | 1.61 | 19.52 | 35.9 |
| 24.04.95 | |||||
| 22:03 | a B | 600 | 1.40 | 22.82 | 35.1 |
| 22:14 | a V | 600 | 1.29 | 22.03 | 35.1 |
| 22:36 | a V | 600 | 1.12 | 22.04 | 35.2 |
| 22:24 | a R | 600 | 1.24 | 21.02 | 35.1 |
| 22:47 | a R | 500 | 1.20 | 20.98 | 35.3 |
| 22:56 | a R | 500 | 1.26 | 20.98 | 35.4 |
| 23:21 | b B | 600 | 1.18 | 22.89 | 35.7 |
| 23:32 | b V | 600 | 1.28 | 22.10 | 36.0 |
| 23:52 | b V | 600 | 1.14 | 22.08 | 36.5 |
| 23:42 | b R | 600 | 1.25 | 20.88 | 36.2 |
| 00:04 | b R | 500 | 1.14 | 20.94 | 36.7 |
| 00:13 | b R | 500 | 1.05 | 20.81 | 37.0 |
| 01:14 | c B | 600 | 1.30 | 22.62 | 39.0 |
| 00:30 | c V | 600 | 1.20 | 21.50 | 38.8 |
| 00:55 | c R | 600 | 1.18 | 20.63 | 38.0 |
| 00:41 | c R | 600 | 1.14 | 20.60 | 38.5 |
2 Search strategy
Let us assume that what we are looking for in the –ray box under investigation is indeed a single compact object of neutron star type. For example, it could be an object partially or totally consisting of quark matter, which has been a hypothesis so far (Haensel et al., 1986; Overgard & Ostgaard, 1991). But here we try to formulate a possible observational forecast without any theoretical model describing –ray burst by itself. We do not assume any particular burst model in advance. The only thing which can be now investigated from observations is the compact character of their sources. Although till now the validity of absorption (cyclotron?) features in redshifted annihilation lines observed in the spectra of “old” –ray bursts is disputed and carefully tested, the observational fact of fast temporal flux variations in bursts is not in question (Atteia et al., 1987; Fishman et al., 1994; Ryan et al., 1994). It means that up to now it is sufficiently reasonable to suppose that the source of these mysterious events is a “compact object” with probable strong (not damped) magnetic field.
Further we assume that potential sources of –ray bursts can be among objects forming the hidden mass of the Galaxy. For the vicinity of the Sun, which we are basically interested here in, the upper limit to the contribution of unknown objects to the total density of matter (or Oort’s limit deduced from observed star velocities along coordinate) is determined and is approximately 38% (Lacarrieu, 1971). Thus, we assume that the objects sought may be rather old, in particular, their velocities can be close to the velocities of the oldest pulsars. And the total expected number of such objects in the optical and in the soft X–rays is bounded above by the density of hidden mass, which gives the local (in the vicinity of the Sun) numerical density of compact objects with the mass of equal to .
The total number of such objects can be bounded below by the number of all neutron stars, which could be in the vicinity of the Sun (Paczynski, 1990). But, apparently, old neutron stars (ONS) only can not be potential sources of –ray bursts, basically because of their small number in the Galaxy, which demands repeated –ray bursts at the average rate of events registered per day in the BATSE experiment (Fishman et al., 1994; Hartmann, 1994). Proceeding from the population of galactic neutron stars born in the Galaxy disk with the velocity distribution observed for radio pulsars (as a result, part of them will leave for the halo), then the spatial density of our hypothetical objects must not be lower than , based on the estimates in (Paczynski, 1990) for a probable average density of old neutron stars in the Galaxy plane near the Sun.
We will use for the radius and the mass of such an object — a hypothetical potential compact source of –ray burst, since we assume a kind of stable object or stable configuration, close to a “standard neutron” star at least by their gravitational properties. Below all estimates concern these parameters namely, though, naturally, the radii and masses of really observed neutron stars (pulsars) are determined with a dispersion of values. To estimate expected optical properties of these objects (in a quiet state — before or after the burst), we should choose also a definite temperature of the thermal emission from the whole surface of such a compact object.
The limitation on the temperature on the whole surface of the compact object for an analogous model (a “cold” single neutron star as a potential source of –ray burst) in connection with deep X-ray EXOSAT observations of –ray boxes has been already used in the interpretation of optical observations of the supposed candidates near the –ray box GRB 790325b (Hartmann et al., 1989; Motch et al., 1990). There is already quite a number of papers limiting the neutron star surface temperature by observations not only with the EINSTEIN and EXOSAT satellites (Pizzichini et al., 1986; Boer et al., 1988; Boer et al., 1991), but also by later ROSAT data in the soft X–rays (Boer et al., 1993b) (see also references in Boer et al., 1993a; Greiner et al., 1995). Here we use the results of ROSAT observations in the soft X–ray range (0.1 - 2.4 keV) for the same purpose — to set an upper limit to the value , to set later, using our own optical observations of the GRB 790613 –ray box, a limit on and a lower limit on the distance to the supposed potential candidates. Thus, that is a kind of development of the method of Pizzichini et al. (1986) for single objects, which has already become almost standard.
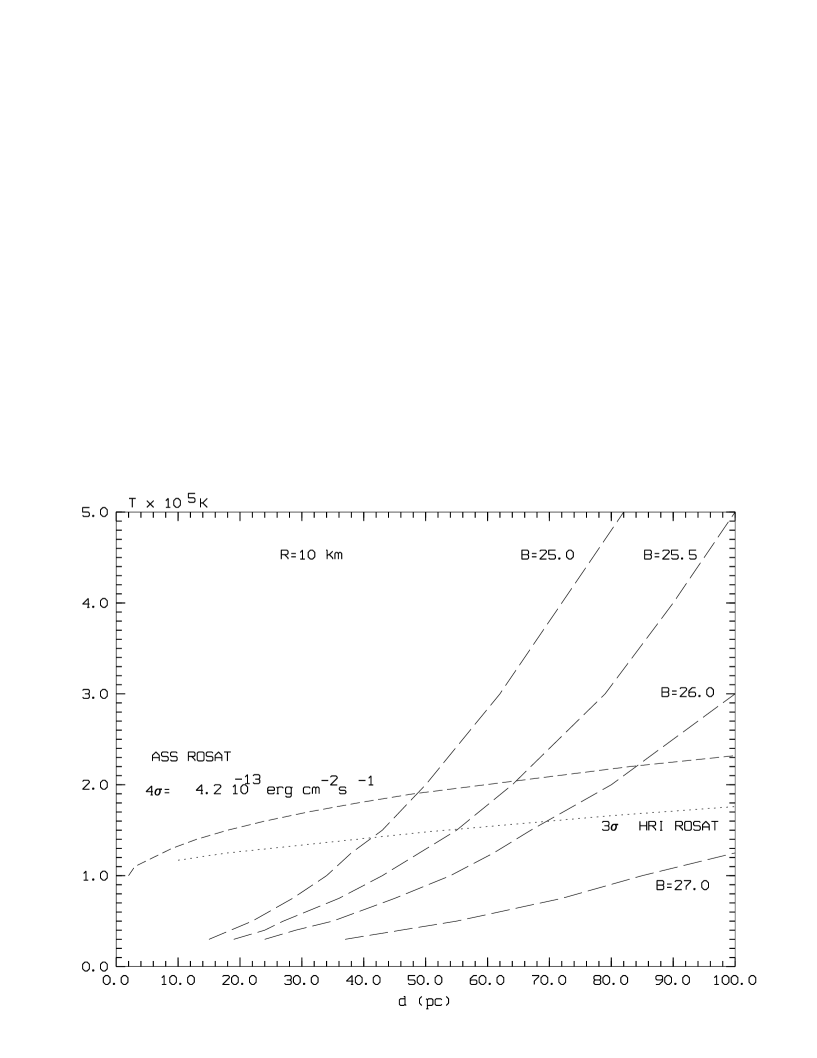
In Fig.1 are presented corresponding bounds on temperature of emission from the surface of the compact object with as a function of distance to it. The source of black body emission with can be detected in the X–rays or/and in the optical if at a given temperature and distance it is found to the left or/and above the corresponding curve in Fig.1.
For the all–sky survey in the energy range of with the help of the ROSAT satellite (ROSAT All-Sky Survey = ROSAT ASS) we will use the flux , averaged over the whole survey (with an average exposure time of 500 s), which corresponds approximately to a level of . (5 X-ray sources found near or inside small –ray boxes were studied at this level of signal detection in ROSAT ASS (Boer et al., 1993a)). If based on this flux value, then at , even for a spatial density (lower estimate) of in ROSAT ASS, there must be a considerable number (about 30 sources up to 20 pc) of bright () X–ray sources, which could be identified long ago if they existed indeed. So far there are no unidentified bright X-ray sources (J.Greiner, private communication), and from the absence of large number of coincidences of weak X–ray sources with small –ray boxes (Greiner et al., 1995) it should be expected that even if such objects do exist in Nature, then their temperature is lower than K, according to Fig.1.
At even at a maximum allowable density of such objects in the vicinity of the Sun () in ROSAT ASS a very small number should be expected of corresponding X–ray sources with a typical flux of . At the same time, as is seen from Fig.1, corresponding compact objects with temperatures from 50000 K to 150000 K will be seen as objects stronger than 25.5m in the B band, from 30 to 50 pc respectively.
Consequently, in the vicinity of the Sun we are concerned with the search in the optical for weak blue objects with colors: . On the whole sky sphere they can be met with a frequency up to , if their temperatures are . At the same time in the all–sky survey in the soft X–ray range such sources will be either weak (if ) or so weak (at ) that they can be detected only at observations with long exposures in the same frequency band (see Fig.1). The fact that some source was found nevertheless in ROSAT ASS studying 40 small –ray boxes of a total area of ( Greiner et al., 1995) does not contradict the above said and this implies that the temperature of such objects is .
Some contribution to the total bolometric luminosity can be made by accretion from interstellar medium onto a single compact object moving at a velocity of v (Bondi & Hoyle, 1944). In the computation of the accretion rate for a given interstellar medium density (for the number of hydrogen atom in a ) we will assume that the velocity of our hypothetical objects is close to the velocity, which was really observed for radio pulsars, or, at least is close to spatial velocities observed for the oldest of them (Lyne & Lorimer, 1994). Assuming that in the vicinity of the Sun is on average , then at the corresponding contribution to the total bolometric luminosity is only several percent for .
It is evident that because of their assumed low luminosity we can try to look for such objects only in the closest vicinity of the Sun. It refers not only to the optical, but also to the soft X–rays, which are strongly sensitive to inhomogeneities in the interstellar medium distribution (Paresce, 1984). So, keeping in mind the data on interstellar medium close ( pc) to the Sun and also the absorption not only in the soft X–rays, but also in the far ultra–violet ranges (Welsh et al., 1994), we have to do in the optical only with corresponding objects (observed both in the ultra–violet and in the soft X–rays), which are situated very close to us. These may be only the objects which are in the bounds of the Local Bubble. Hence our model estimates refer also only to the nearest space, where, in particular, the distances to the supposed sources are determined only by their average spatial density (), if it is assumed to be approximately constant in a sphere of radius 100 pc. Thus, first of all from the observational point of view, we are interested in the local situation with the sources of –ray bursts of the bright (short and powerful) events for which the law of -3/2 in the distribution LogN/LogS is still valid (Kouveliotou et al., 1993; Fishman et al., 1994). Here we try to use a minimum of model assumptions referring to “Big Galactic models” (Hartmann, 1994) and, so, we are dealing here only with the nearest objects — potential sources of –ray bursts.
GRB 790613 is just one of the most powerful short ( s) events which was simultaneously observed with the help of V-12 SIGNE, V-11 KONUS and PVO at photon energies exceeding 100 keV ( keV), when the greater part of –ray burst energy was released at the annihilation emission frequency during a time of s (Atteia et al., 1987; Vrba et al., 1995). It could be expected that a supposed compact object, which was connected with this –ray burst, is one of such nearest objects, that has probably undergone a kind of explosion on its surface. In next Sections, with the use of the above mentioned, by the example of GRB 790613 event it will be shown how an observational problem of search for such “cold” compact objects can be stated under the conditions, when we have to conduct optical search for weak sources by studying very big areas in the sky.
3 Observations
The observational data were obtained with the CCD camera of pixels placed at the prime focus of the 6 m telescope of SAO RAS. The CCD chip has rectangular pixels of m, resulting in an image scale of per pixel. We obtained the data with Cousins BVR filters. Normal program exposures were 600 s, 500 s or 400 s for the BVR filters. Longer exposures are not reasonable because of increasing number of space particles, since about 30 particles on the average are registered during a 10 minutes’ exposure. A total of hours of open shutter time was eventually obtained for the observation of the GRB 790613 error box. Atmospheric conditions were stable throughout the observational runs with a seeing of arcseconds. The first observation of this box was carried out on 13/14 April, 1994 in the B and V filters (Sokolov et al., 1994), where blue “candidates” were selected by the criterion . An additional observation in R filter was made on 2/3 June, 1994, but the CCD was not in the standard mode, and we used these data only as a photometric reference of relatively bright stars in the R filter over the whole mosaic obtained later. A subsequent observation in the three (BVR) filters of the central part of the GRB 790613 error box, where several blue () objects were found, was carried out on 29/30 December, 1994, and for the whole field — on 24/25 April, 1995.
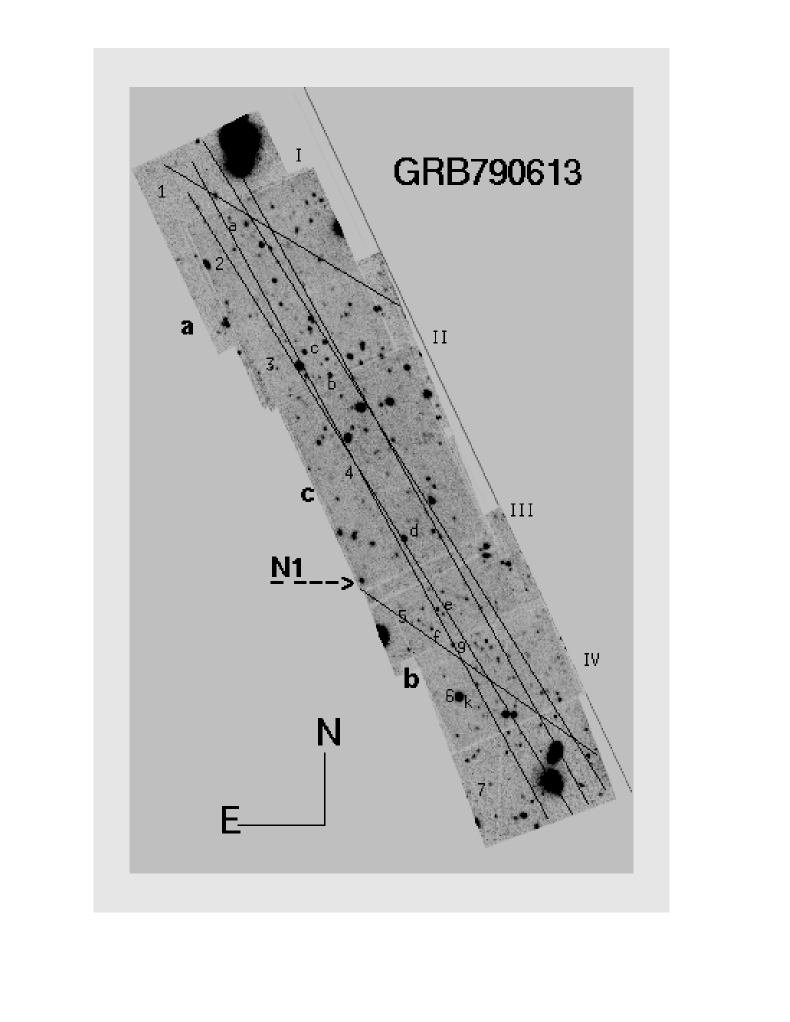
The coordinates of the center of the studied field are . Unlike other observers, we deliberately choose a symmetric –ray box obtained as a result of intersection of three stripes, and not only its northern part, which is a common part for all four triangulation stripes, since the symmetry of the error box evidences in favor of a correct burst localization. The total area of the symmetric box is .
The log–book is adduced in Table 1. For the GRB 790613 field there are: I – the date and UT of observations, II – the area number and the filter, III – the exposure time, IV – the seeing, V – the night sky brightness per one square arcsec, VI – the zenith distance.
The procedure of construction of the GRB 790613 field mosaic we obtained is shown in Fig.2. The roman numerals and bold letters correspond to the numbers and letters in column III of the log-book. Small letters indicate seven secondary photometric standards. The numbers correspond to areas with homogeneous photometric limits (see Table 2).

3.1 Data reduction and calibration
Standard data processing involves bias removing, flat fielding and removing of space particles and bad chip pixels. Bias-images were obtained during the night at regular intervals. Flat-field frames were obtained at twilight along with bias frames at the end of each night of observation. By shifts and turns all images were reduced to a unified internal frame of reference. Cosmic particles were selected by subtraction of median smoothing over several images from one image and were removed individually. The whole processing was carried out with the use of the ESO-MIDAS software package.
| Number | B | V | R |
|---|---|---|---|
| of area (Fig.2) | |||
| 1,7 | 24.7 | 24.7 | — |
| 2.,3,5,6 | 25.7 | 25.7 | 25.6 |
| 4 | 26.2 | 25.8 | 25.6 |
The photometric standard star MS 1443+63 B was observed every observational night before and after observation of the GRB 790613 error box. We used the star MS 1443+63 B to calibrate secondary standard stars inside the CCD mosaic. We used seven secondary standard stars for calibration of different frames for one night and for different nights. The total number of the objects registered up to 27m in the B filter is 426.
3.2 Photometry
The images obtained and reduced to a unified frame of reference were summed up in each filter. Photometry was obtained for all objects inside the whole CCD mosaic. But for further analysis we used only the objects with a . The corresponds to the error of 0.25m and for an object with magnitude determined with such an error the color error is 0.35.
The photometric procedure consisted of the following stages:
-
1.
Since we were interested first of all in blue () objects, then by the images obtained in the B filter using MIDAS context INVENTORY and smoothed with a gaussian we obtained coordinates for all detected objects of the whole mosaic.
-
2.
By the coordinates obtained at the first stage the aperture photometry was done in all three BVR filters.
-
3.
The obtained values were corrected for the finite radius of the aperture and atmospheric extinction at the given zenith distance, and were reduced to the standard Cousins system.
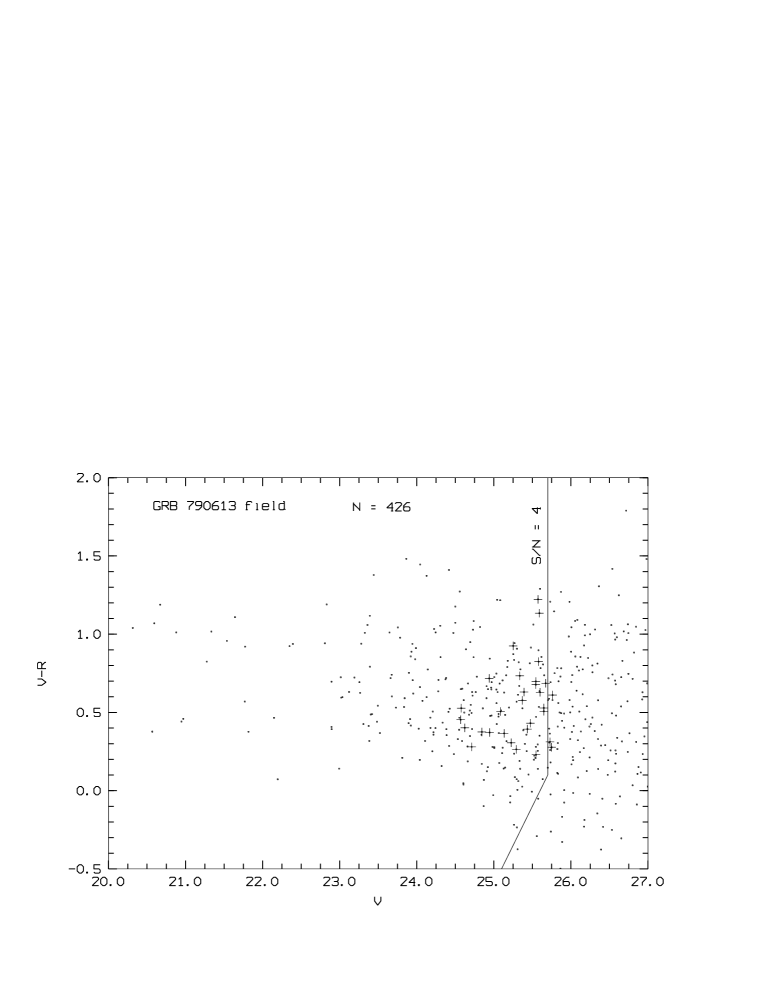
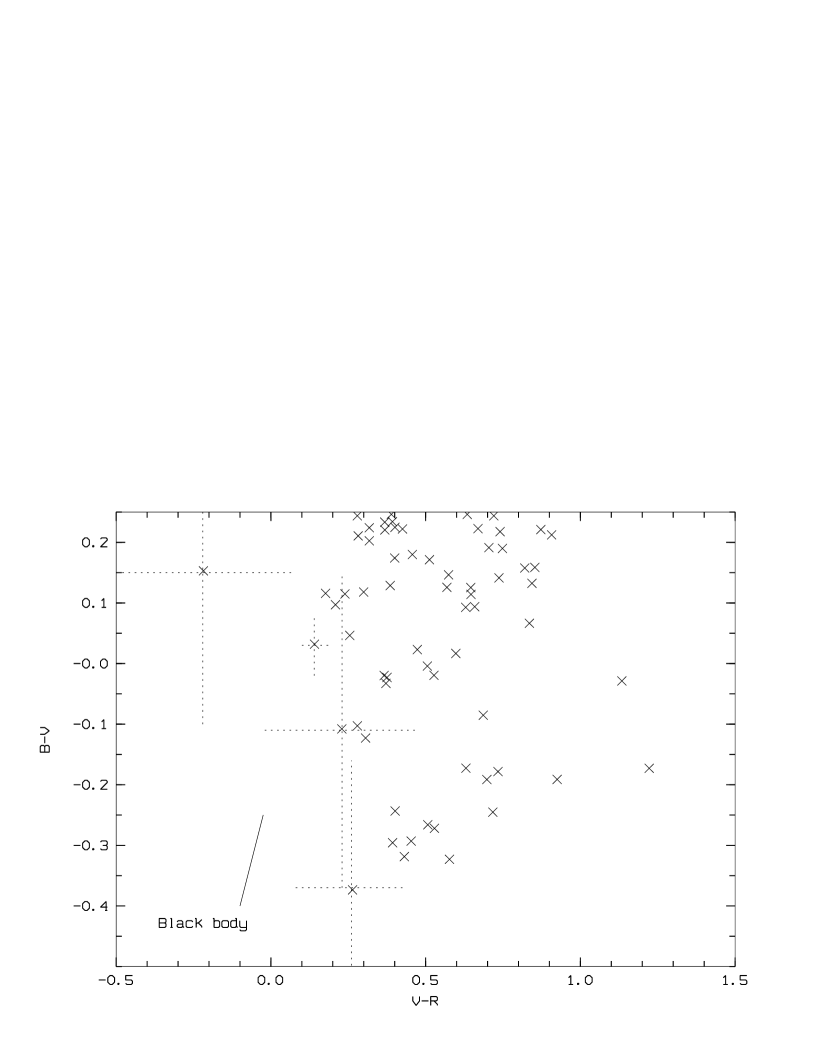
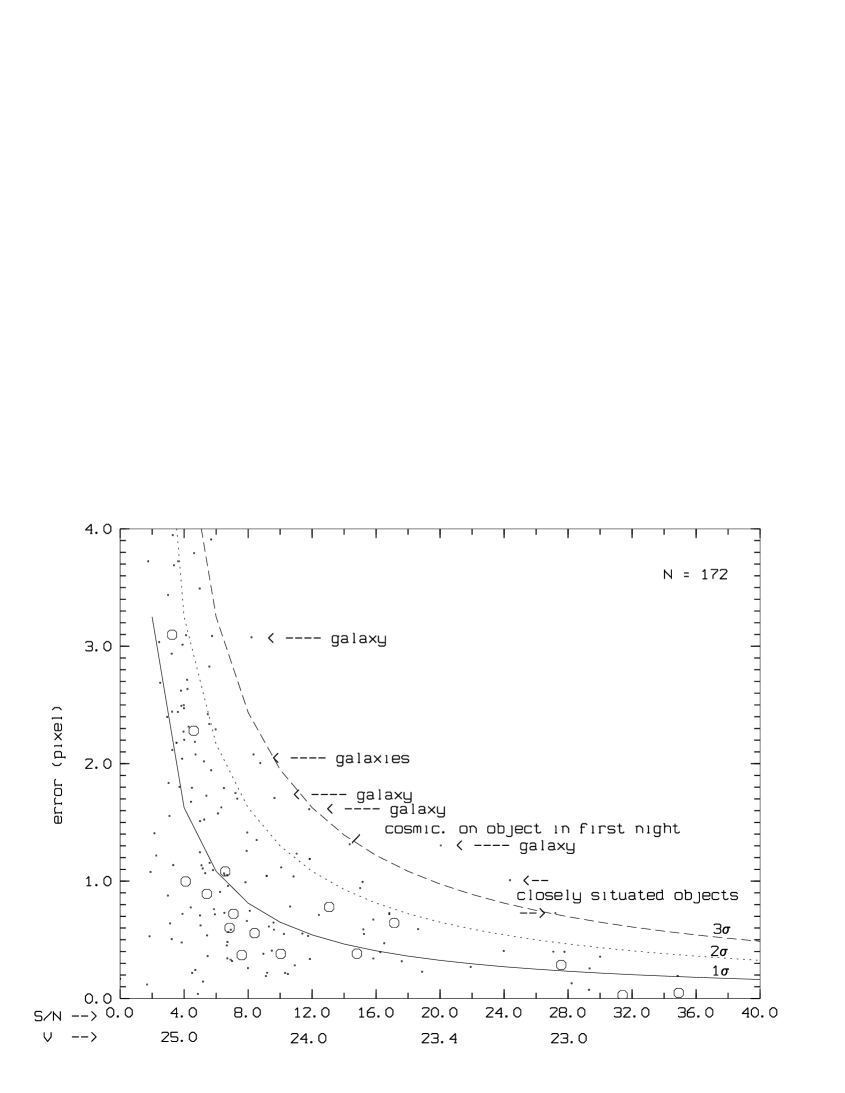
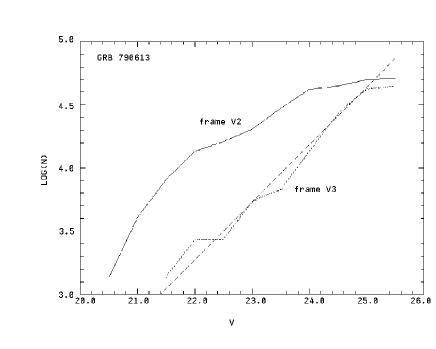
The results of the photometry are shown in Figs. 3,4,5. The crosses denote 31 objects in Figs. 3,4 with and . Photometric limits (defined as ) for the CCD mosaic are given in Table 2.
The was calculated for every object by the formula:
where is the flux from a star in the given aperture, is the sky background in the same aperture.
Photometric errors were determined as follows:
-
1.
If we had one measurement only, then the error was calculated using Poisson distribution of accumulated quanta:
where
-
2.
If we have several measurements, then in addition to 1)
And correspondingly, the color errors are obtained as follows:
The color errors for several objects with color indices closest to those of probable black–body objects are shown in Fig.5.
3.3 The search for blue stellar–like objects
The search for a neutron star type object with a black–body surface temperature , as a possible potential source of a -ray burst, in the case -ray bursters are of local Galactic origin, was the main purpose of our observations. These sources must be observed as faint () blue stellar–like objects of and may be soft X-ray sources.
That is why our first step in selection of probable “candidates” was selection of objects with color indices (see Fig.3). Observations in the R filter (the second approximation) allow us to select among such blue “candidates” only the ones, which must be below the line . In Fig.4 it is well seen how the objects with (crosses) “scatter” over the diagram . A subsequent test of blue in objects with the help of the criterion reduces sharply large number of such “candidates” with the expected black body (“stellar”) distribution over the fluxes even without a careful analysis of their profiles for the purpose of revealing stellar likeness or extended character of an object.
As is seen from Figs. 3,4 and Table 2, the limits, from which the level of is greater than 4 for each of the B, V, R filters in the average for the whole mosaic, are equal correspondingly to (and ). Thus, from the aforesaid it might be assumed that almost all obviously blue in objects studied up to (see Fig.3) are too red in color index to attribute them confidently (with ) to objects with the black–body distribution in the B, V, R fluxes. That is no blue optical counterparts by and (for ) were found.
The ROSAT HRI observation of the GRB 790613 field with a 13168 s exposure did not detect any objects in this error box and showed that the black body temperature must be less than 150000 K for the objects of the neutron star type at a distance less than 100 pc (ROSAT X–ray Images, 1994a; ROSAT Guest Observer Program, 1994b). Our observation with ROSAT data can be interpreted as the absence of a single compact object with and up to a distance of (Fig.1) and accordingly, the energy of GRB 790613 event is higher than . Nevertheless, if the value is assumed to be the photometric limit, at which the blue object with can yet be classified (by two color indices at once!) by our data (bearing in mind an object analogous in brightness and color to Geminga optical candidate). Then from the X-ray -limit for deep observations of the same box with HRI ROSAT (ROSAT X-ray Images, 1994a; ROSAT Guest Observer Program, 1994b) it is seen (Fig.1) that in this case a single object, which could be connected with this brightness, can be situated very close to us, if its temperature is .
3.4 Estimations of proper motions
Close objects (of NS type) can have considerable proper motions. For example, at a velocity of and a distance of 100 pc the proper motion up to 0.4 arcsec/year can be expected from such an object. But if the object has a non–thermal spectrum, it may be photometrically lost among the great number of other objects. That is why the proper motion measurement is of special importance as an opportunity to select all close objects with high spatial velocities. The proper motion measurement procedure was as follows.
All images were reduced to one frame of reference with the help of bright stellar–like objects with normal stellar color indices. Since these objects lie in the range of 20-21m, they are the most probable stars at the distance of several kiloparsecs and, correspondingly, are good reference points for construction of motionless frame of reference. Since all objects, which are the nearest to us, must have stellar profiles, to determine the position of all objects we used the approximation of their profiles by the Gauss function, and, correspondingly, defined the position of the object as the Gauss function center of mass. After making such measurements for two epochs: April 1994 and April 1995, we estimated the proper motion of objects per year as the difference between the coordinates for the two epochs. For galactic objects this difference would be just the proper motion, for extragalactic ones it corresponds to the accuracy of the object profile approximation by the Gauss function. To determine the standard error of the object position, analogous measurements were made for the same objects in different images obtained during one night. The results of our measurements are presented in Fig.6.
The proper motion of objects with was measured. Down to objects with the proper motion larger than of average position were not found. Objects with cosmic particles or closely spaced objects have a position error between of the average position error.
| Number | B | V | R | B-V | V-R |
|---|---|---|---|---|---|
| of galaxy | |||||
| (Fig.8) | |||||
| 1. | 21.39 | 20.42 | 19.65 | 0.97 | 0.76 |
| 2. | 21.44 | 20.35 | 20.03 | 1.08 | 0.32 |
| 3. | 20.84 | 19.86 | 19.54 | 0.97 | 0.32 |
| 4. | 22.03 | 21.00 | 20.53 | 1.02 | 0.47 |
| 5. | 22.13 | 20.82 | 20.27 | 1.31 | 0.55 |
| 6. | 22.60 | 21.64 | 21.23 | 0.96 | 0.40 |
3.5 Some interesting objects
Some interesting objects were found near and inside the error box. The first (Number 1 in Fig.2) of them is a stellar-like object with , and . It is situated outside the error box at a distance of about from its boundary. The object has color indices close to those of black body with the temperature . Assuming that this object is the object of neutron star type, then it might be situated at a distance less than 10 pc from the Sun and, accordingly, it has to have a noticeable proper motion ().
But the proper motion of this object is less than per year. It may be a QSO or a halo object: a subdwarf or a white dwarf at about 3 kpc distance.
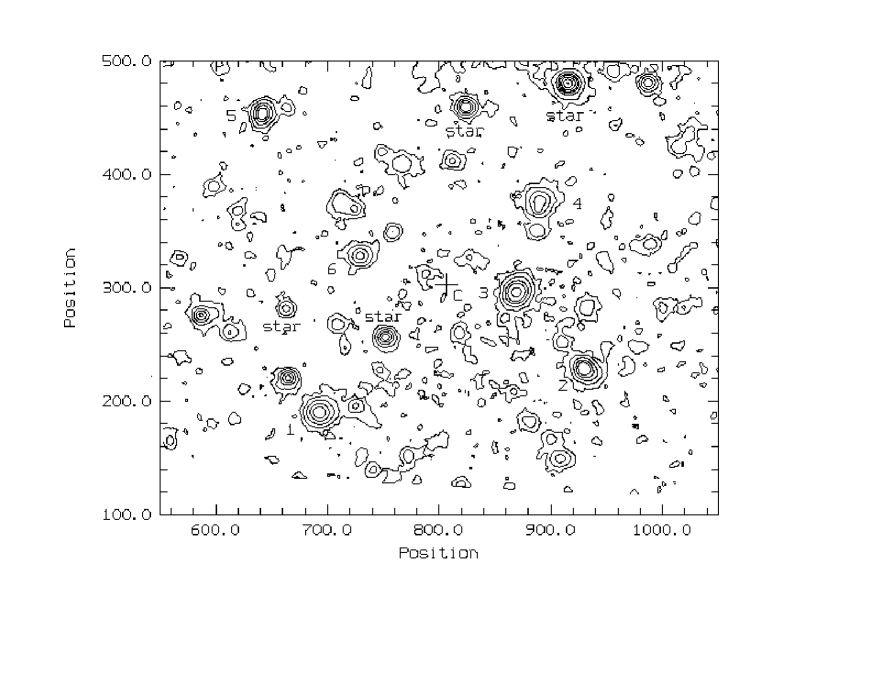
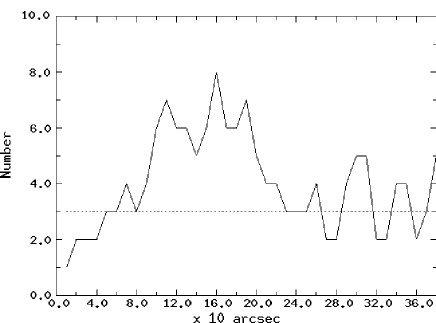
A group of galaxies was found in a projection on the northern part of the error box using the galaxy counts. Fig.9 displays the excess of bright galaxies when counting them in two adjacent frames of our mosaic (II and III of our log-book and see also Fig.2). The size of the group of galaxies is about . It is obtained on the basis of counting the number of galaxies up to in the stripes of in size along the whole mosaic (Fig.8). Assuming the masses of galaxies to be proportional to their magnitudes, the determined coordinates of the center of mass for the group are , . The center of mass is denoted by the cross in Fig.7. The redshift of the group is estimated from magnitudes and colors of galaxies with the use of K-correction taken from the paper (Frei & Gunn, 1994). The numbers in Table 3 correspond to the numbers in Fig.7.
4 Summary and discussion
From the mentioned in Section 3.3 it follows that today’s X-ray and optical observations do not exclude at all a cooled compact object as a candidate for the sources of –ray burst in this concrete case of the –ray box, which has already been well studied in the X–rays (see also in Greiner et al., 1995). In general, based on the average limit of ROSAT ASS (dashed line in Fig.1), all such sources or at least the closest of them could be located at a distances of or more by varying the spatial density of corresponding hypothetical cold compact objects from a maximum density of (bearing in mind the objects with the mass of as unknown objects of (Lacarrieu, 1971) and up to a minimum spatial density close to the density of old neutron stars in the vicinity of the Sun.
It means that we can construct any “global” galactic models for –ray bursters, beginning with the well studied situation in the vicinity of the Sun. And from Fig.1 it is well seen that if it is difficult to observe such single objects in the soft X–rays (because of absorption also), then nevertheless at big telescopes they could be detected in optics in small –ray boxes () up to a distances of pc (up to ).
The emission of these cold compact objects can be weakened in the soft X-rays because of the fact that for the X–rays the walls of so called “Local Bubble”, which are situated close to the Sun, become opaque (Paresce, 1984). (See the calculation of soft X-ray absorption for the thermal emission of single neutron stars in Helfand et al. (1980), analogous calculation for the band of keV is in Boer, et al., (1993a).) For the same reason there must be few such objects in EUVE and ROSAT WFC sky surveys (Welsh et al., 1994), and the objects which can still be seen in the far ultra–violet (the closest ones) may be potential sources, which have not yet manifested themselves as the sources of –ray bursts — the sources “in a quiet state”.
To emphasize here the fact that study of blue () objects with in the whole field is not a limiting problem for the 6 m telescope at all, we refer to analogous observations in February 1987 of the Geminga object (Halpern & Tytler, 1988) at the 5 m telescope. The corresponding exposures in the g and r bands were 7200 s and 5500 s, which allowed only a rough color estimate () to be obtained for the expected optical candidate with , i.e. this was limiting problem indeed. Even in the case of observation at NTT of an optical candidate for PSR 0656+14 in January 1991 (Caraveo et al., 1994), when an object with was found at the level of , the total exposure in the V filter was 4200 s. In the B, V and R frames obtained at the 6 m telescope (during an exposure time of min in each filter, as was mentioned above) all these objects were not only detected at the level higher than but their colors were also measurable. In particular, the object analogous to the optical candidate for Geminga should be registered in B and V with a good S/N.
Certainly, in principle, the situation is possible when a probable source of the -ray burst is on the same line of sight as a brighter object. The probability of such a projection of the GRB 790613 event source on one of the relatively bright objects inside the mosaic is 6%. This is the ratio of the area covered by all objects to the total area of the mosaic for the GRB 790613 error box. Thus, the observation of the GRB 790613 –ray box in three filters allows us to hope for a 94% “cleaning” of the whole investigated field for such objects as optical candidates for the identification of the Geminga object (Halpern & Tytler, 1988) or PSR 0656+14 (Caraveo et al., 1994).
Thus, the results of the study of the localization region of the GRB 790613 event up to the magnitudes and permits the following conclusions to be drawn:
-
1.
The absence of blue (by and color indices) objects up to near the box center can be interpreted as the absence of a compact object with a “naked” surface (without any dense envelope in the optical) hotter then , at least up to in this direction. So, optical observations add new details to the estimate of temperature of the supposed single compact objects in the vicinity of the Sun, which can be made in interpretation of results of the search for point-like X-ray sources in the range of keV.
-
2.
The observational data available do not reject the existence of “cold” () compact objects up to , some of which could be related with the closest sources of –ray bursts in the vicinity of the Sun (in a sphere of radius ). Accordingly, lower values of the supposed spatial density () at a given observed average frequency of –ray events “remove” the closest source of the burst to a distance greater than 50 pc. For a given rate of –ray bursts, (Fishman et al., 1994) it turns out automatically that old neutron stars born in accordance with the “standard” scenario (Paczynski, 1990) can not be sources of –ray events at least near the Sun).
Since here we mean only the most powerful and the closest to us sources of –ray bursts and, correspondingly, the closest compact objects probably related to them, then the global spatial distribution of sources is open to question and it becomes essential for weak sources (Fishman et al., 1994). The question is also open of recurrent events, short and long flashes and, in general, the mechanism of –ray burst remains incomprehensible.
The work was carried out with the support of ESO C&EE Programme (grant A-02-023), and also with the support of Russian Foundation for Basic Research (grant 94-02-04871a).
References
- [1] Atteia J.-L., Barat C., Hurley K. et al., 1987, Astrophys. J. Suppl. Ser., 64, 302
- [2] Barat C., Hurley K., Niel M. et al., 1984, Astrophys. J., 280, 150
- [3] Boer M., Atteia J.-L., Gottardi M. et al., 1988, Astron. Astrophys., 202, 117
- [4] Boer M., Hurley K., Pizzichini G., Gottardi M., 1991, Astron. Astrophys., 249, 118
- [5] Boer M., Greiner J., Kahabka P. et al., 1993, Astron. Astrophys., 97, 69
- [6] Boer M., Pizzichini G., Hartmann D. et al., 1993, Astron. Astrophys., 277, 503
- [7] Bondi H., Hoyle F., 1944 , Mon. Not. R. Astron. Soc., 104, 273
- [8] Caraveo P.A., Bignami G.F., Mereghetti S., 1994, Astrophys. J., 422, L87
- [9] Finley J.P., Ogelman H., Kizilogly U., 1992, Astrophys. J., 349, L21
- [10] Fishman G.J., Meegan C.A., Wilson R.B. et al., 1994, Astrophys. J. Suppl. Ser., 92, 229
- [11] Frei Z., Gunn J., 1994, Astron. J., 108, 1476
- [12] Golenetskii S.V., Mazets E.P., Aptekar R.L., 1986, Astrophys. Space Sci., 124, 243
- [13] Greiner J., Boer M., Kahabka P. et al., 1995, in The Lives of the Neutron Stars, M.A.Alpar et al.(eds.), Kluwer Academic Publishers, Printed in the Netherlands., 519
- [14] Haensel P., Zdunik J.L., Schaeffer R., 1986, Astron. Astrophys., 160, 121
- [15] Halpern J.P., Tytler D., 1988, Astrophys. J., 330, 201
- [16] Harrison T.E., McNamara B.J., Klemola A.R.. 1994, Astron. J., 108, 600
- [17] Hartmann D., Pogge R.W., Hurley K. et al., 1989, Astrophys. J., 336, 889
- [18] Hartmann D.H., 1994, Proceedings of 2nd Huntsville GRB Workshop. AIP., 307, 359
- [19] Helfand D.J., Chanan G.A,, Novick R., 1980, Nature, 283, 337
- [20] Kouveliotou C., et al., 1993, Astrophys. J., 413, L101
- [21] Lacarrieu C.T., 1971, Astron. Astrophys., 14, 95
- [22] Lyne A.G., Lorimer D.R., 1994, Nature, 369, 127
- [23] Motch C., Hudec R., Christian C., 1990, Astron. Astrophys., 235, 185
- [24] Overgard T., Ostgaard E., 1991, Astron. Astrophys., 243, 412.
- [25] Paczynski B., 1990, Astrophys. J., 348, 485
- [26] Paresce F., 1984, Astron. J., 89, 1022
- [27] Pizzichini G., Gottardi M., Atteia J.-L. et al., 1986, Astrophys. J., 301, 641
- [28] Ricker G.R., Vanderspek R.K., Ajhar E.A., 1986, Adv. Space Research, 6, 75
- [29] ROSAT X-ray Images, Volume 1 (The CDROM files), 1994a, Produced by the Lab. for High Energy Astrophysics and High Energy Astrophysics Science Archive Reserch Centre at NASA Goddard Space Flight Centre, Greenbelt, Maryland (Prepared by: B.O’Neel. et al. B.)
- [30] ROSAT Guest Observer Program, 1994b, Solicitation for AO5 Observing Proposals. Printed by the US ROSAT Science Data Center, NASA/Goddard Space Flight Center, Greenbelt, 75.
- [31] Ryan J., Bennett K., Collmar W. et al., 1994, Astrophys. J., 422, 67
- [32] Sokolov V.V., Kopylov A.I., Kurt V.G., Zharikov S.V., 1994, Lecture Notes in Physics, in Proc. IAU Coll. 151, Flares and Flashes, held in Sonneberg,Germany, Dec. 5-9, 1994, eds.: J. Greiner et al., Springer, 389
- [33] Vrba F.J., Hartmann D.H., Jennings M.C., 1995, Astrophys. J., 446, 115
- [34] Welsh B.Y., Craig P.W., Vedder P.W., Vallerga J.V., 1994, Astrophys. J., 437, 638