Search for variable stars in the globular cluster M3
Abstract
We describe here results of a photometric time-sequence survey of the globular cluster M3 (NGC 5272), in a search for contact and detached eclipsing binary stars. We have discovered only one likely eclipsing binary and one SX Phe type star in spite of monitoring 4077 stars with and observing 25 BSS. The newly identified SX Phe star, V237, shows a light curve with a variable amplitude. Variable V238 shows variability either with a period of 0.49 d or with a period of 0.25 d. On the cluster colour-magnitude diagram, the variable occupies a position a few hundredths of magnitude to the blue of the base of the red giant branch. V238 is a likely descendent of a binary blue straggler.
As a side result we obtained high quality data for 42 of the previously known RR Lyrae variables, including 33 of Bailey type ab, 7 type c and 2 double-mode pulsators. We used equations that relate the physical properties of RRc stars to their pulsation periods and Fourier parameters to derive masses, luminosities, temperatures and helium parameters for five of the RRc stars. We also tested equations that relate [Fe/H], and temperature of RRab stars to pulsation period and Fourier parameters. We derived [Fe/H] in good agreement with spectroscopic determinations. One of the RRd stars (V79) has switched modes. In previous studies, it was classified as RRab, but our observations show that it is an RRd star with the first overtone mode dominating. This indicates blueward evolution on the horizontal branch.
keywords:
globular clusters: individual: M3 – binaries: eclipsing – stars: variables: RR Lyrae – blue stragglers – stars: horizontal branch1 Introduction
The subject of binarity of stars in globular clusters (GC’s) has evolved in recent years from an entire neglect of the problem (in part due to the sin of taking absence of evidence for the evidence of absence), to a very active field, with several cosmological relevances. Binary stars apparently play a very important role in the dynamical evolution of the GC’s (Hut et al. 1992) and their relative frequency may drastically alter the direction and outcome over long time scales. On the other hand, combined analyses of photometric and radial-velocity data for eclipsing binaries can give distances, ages and masses of stars through pure geometry, without recourse to the cluster isochrone fitting, which suffers from uncertainties involved in the transformation of theoretical models into observational quantities. We note that although masses of RR Lyrae-type stars can be estimated using the pulsation theory, their usefulness is limited because of the poorly understood processes of mass loss occurring during evolution on the giant branch.
The photometric survey for eclipsing binaries in M3 which is described in this paper was intended as a first step in a programme aimed at a direct, high accuracy determination of the distance and of the turnoff mass for this cluster. The second future step would involve determination of precise radial velocity curves for identified detached binaries. For hypothetical SB2 binaries located at the top of the M3 main-sequence (), it is currently feasible to determine masses of components with an accuracy not worse than a few percent. We expected numerous, previously undiscovered, eclipsing binaries in M3. Our conviction was based on the fact that this cluster harbours a rich population of Blue Straggler stars, whose unusual properties seem to be related to binarity (see below). M3 was the first GC in which Blue Straggler stars (BSS) were identified by Sandage (1953). 52 BSS were discovered in the outer parts of the cluster using photographic photometry (Sarajedini & da Costa 1991; Fusi Pecci et al. 1992, Buonanno et al. 1994), while the total number in M3 may be close to 200, as estimated on the basis of the HST (WFPC-1) results for the central one arc-min field by Guhathakurta et al. 1994. Recently, Nemec & Park (1996) reported discovery of 3 SX Phe stars and 1 eclipsing binary in their survey of the outer-regions of M3.
For many years the main interest in the BSS centered on their unusual properties on the extension of the main sequence, but the high incidence of variability among them, as pulsating SX Phe stars and contact binaries, have further increased their importance. There have been several excellent reviews of the BSS (Stryker 1993) and of the BSS in globular clusters in particular (Bailyn 1995), which contain references to the rich literature in the field. Two mechanisms of formation of the BSS are now generally accepted: the angular-momentum loss (AML) in close binaries, which is basically independent of the cluster dynamics, but is related to the advanced age of the GC, and the collisional mechanism in the cluster cores, perhaps involving predominantly wide binaries (Leonard 1989, Leonard & Fahlman 1991). The unique case of M3, which is the object of our study, gives strong support that two mechanisms are contributing to the BS formation. Ferraro et al (1993) discovered 70 new BSS and concluded that M3 is the only cluster with a non-monotonic radial distribution of the BSS, with two maxima, and a prominent deficiency between 4 and 8 cluster core radii, i.e. at the angular distances of from the center.
The telescope that we used in this programme, the Jacobus Kapteyn Telescope (JKT), had a relatively small focal scale so that we were forced to conduct our search for variability away from the core, at the angular distances of N and S of the cluster center. Thus, we would be able to discover variability of the BSS, and of related close binaries, in the outer zone where – supposedly – mostly the BSS formed by the AML exists. We were able to monitor 25 BSS, but only one turned out to be a variable star of SX Phe type. Moreover we identified one contact binary being a yellow straggler.
Recent studies have shown that the physical properties of RR Lyrae variables can be derived from high precision light curves using the technique of Fourier decomposition. Since our survey has provided accurate light curves for 42 RR Lyrae stars in M3, the analysis of these curves will be valuable.
2 Observations and data reduction
The photometry of M3, reported in this paper, was obtained by RWH during the interval 1996 March 19 - April 2 with the 1.0-m. Jacobus Kapteyn Telescope (JKT) at the Observatorio del Roque de Los Muchachos, La Palma. The camera was mounted at the f/15 Cassegrain focus, with a TEK CCD providing a field of 6.7 arcmin square, scale 13.8 arcsec mm-1, and a pixel size of 0.33 arcsec on the sky. Each night of observations included bias frames, flat fields on the twilight sky, observations of BVRI standard star fields (Landolt 1992), and monitoring, in the V filter, of two fields in the outer parts of M3. A total of 7 good photometric nights were secured, with additional data on two partial nights.
The two fields of M3 were selected to be centred on 280 arcsec N and 290 arcsec S of the cluster core. The stellar images were well resolved across most of each field, with only a arcsec zone showing the crowded core region across one edge of each frame. The two fields were observed alternately, and the autoguider system was employed to ensure that every frame of each field was centred on the same position. On nights of high photometric quality, a few frames of each field were secured through a B filter at air masses less than 1.1, in order to provide a good colour-magnitude diagram for these regions of the cluster. The V filter monitoring usually extended for 8 continuous hours in a complete night, from air mass 2.0 through the local zenith to air mass 1.3. On most nights, the seeing was measured to be in the range 1.0 - 1.5 arcsec. Integration times of 400 sec, typically, were used to ensure good quality photometry of the main-sequence turn-off region at , as well as ensuring that the brighter BS region , and the blue horizontal branch at , were not saturated. The readout time for each frame (3 min.) was severely lengthened by the old computer system still employed for recording data in 1996. A total of 180 V frames of each of the two fields were secured during the observing session, of which 176 have provided reliable data.
The preliminary processing of the raw CCD frames was done with the
standard routines in the IRAF-CCDPROC111IRAF is distributed by
the National Optical Astronomical Observatories, operated by the
Association of Universities for Research in Astronomy, Inc., under
contract with the National Science Foundation package.
The stellar profile photometry was extracted using a set of programs and
UNIX scripts developed by JK. The UNIX scripts make use of the
DAOPHOT/ALLSTAR (Stetson 1987) and DOPHOT (Schechter, Mateo & Saha
1993) programs. More details about the algorithms used may be found
in Kaluzny et al. (1995).
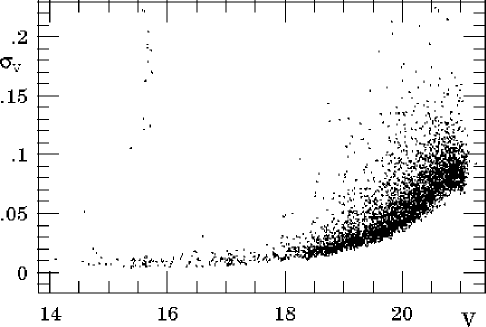
The accuracy of derived photometry varied from night to night
depending on the sky brightness and seeing conditions. For the
prevailing fraction of frames the random errors were smaller than
0.05 mag for ; see Fig. 1.
Transformation to the standard system
was obtained based on observations of the Landolt (1992) equatorial
standard fields.
The following relations were adopted:
| (1) | |||
| (2) |
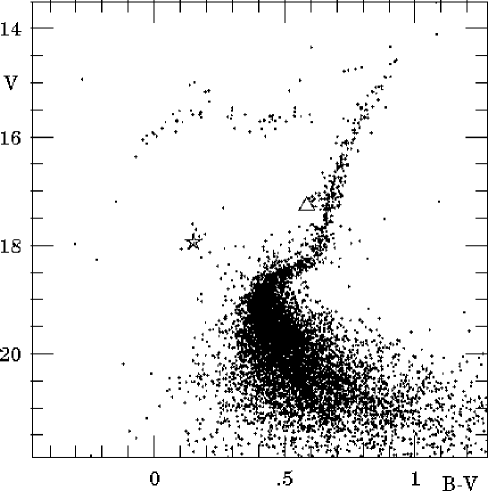
The colour-magnitude diagram for stars from two monitored fields is shown in Fig. 2.
3 Search for Variables
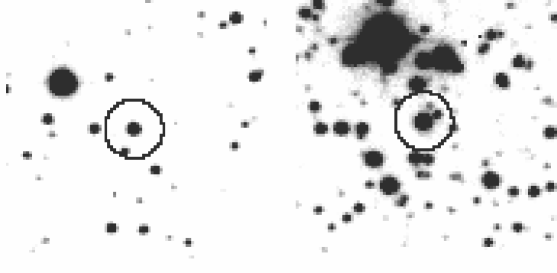
The search for variables was conducted by analyzing light curves for stars measured on at least 90 frames. There were 3954 and 4043 stars fulfilling this criterion in the data bases for fields and , respectively. The total number of stars with whose light curves were examined for variability was equal to 4077. To select potential variables we employed three methods, as described in detail in Kaluzny et al. (1996). The light curves showing possible periodic signals were selected for further examination. 44 certain variables were identified this way. Of these 42 are RR Lyr variables, all previously known. The RR Lyr variables are discussed separately in Sec. 4. Of the remaining two variables one is an SX Phe star and another is a likely eclipsing binary. Both of these objects are located in the field S. We have designated these two variables as numbers 237 and 238, in continuation with the numbering scheme of the catalogue of Sawyer Hogg (1973). Their basic properties and coordinates are listed in Table 1. Finding charts for both newly identified variables are shown in Fig. 3. V237 and V238 are included in the catalogue of M3 stars published by Buonanno et al. (1994). In that catalogue V237 is listed as BS8484 while V238 is listed as star #1101.
The two observed fields contain a total of 25 stars which can be considered blue stragglers (we adopted the following limits on colour and magnitude for M3 blue stragglers: , ; see Fig. 2). The light curves of all blue stragglers were carefully examined and none of them, with the exception of variable V237, showed any evidence for variability with the full amplitude exceeding 0.05 mag.
3.1 Variable V237
V237 is variable blue straggler (see Fig. 2) belonging to SX Phe type stars.
Using the AoV statistic (Schwarzenberg-Czerny 1991), we derived for it a
period d. The light curve phased with that period is presented
in Fig. 4. That light curve is unexpectedly noisy considering the small
formal errors of the photometry. Examination of the time-domain light
curve of V237 reveals
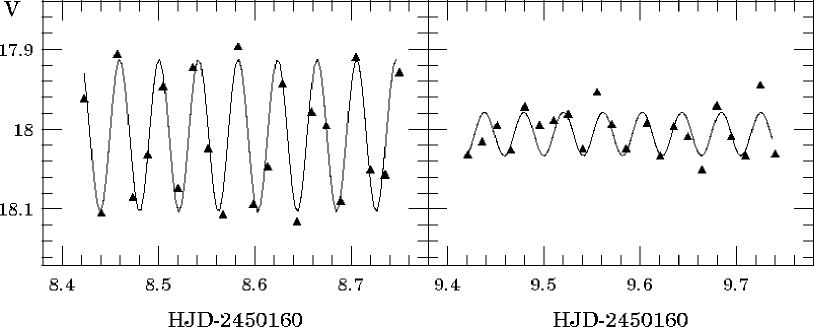
that its amplitude is in fact modulated. This is demonstrated in Fig. 5
in which we show the light curves of V237 observed on the nights of March 25
and 26, 1996.
A possible cause of the variable amplitude of V237
could be the presence of more than one periodicity in its light curve.
The power spectrum obtained with the CLEAN algorithm (Roberts, Lehar &
Dreher 1987) shows two significant peaks corresponding to closely spaced
periods: d and d. These two periods are
too long and too closely spaced to represent any low
sub-harmonics of the fundamental period of the radial pulsations.
We may offer two possible explanations for the
observed changes of the amplitude of the light curve of V237:
a) One of the periodicities identified in the power spectrum corresponds
to non-radial pulsations. It is customarily assumed that SX Phe stars
pulsate exclusively in radial modes. However, there are no reasons to
reject the hypothesis that some of them may exhibit variability related
to non-radial pulsations. Non-radial pulsations were observed for several
Sct stars which can be considered PopI counterparts of SX Phe
stars.
b) The variable exhibits the Blazhko effect which is observed for a
significant fraction of RR Lyrae stars.
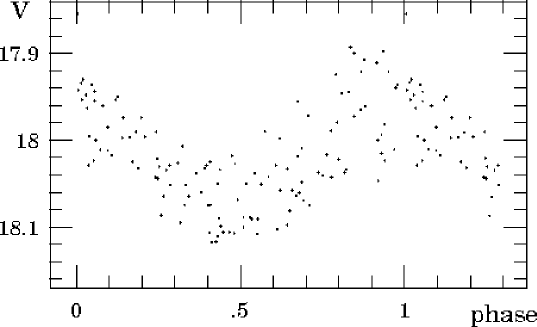
3.2 Variable V238
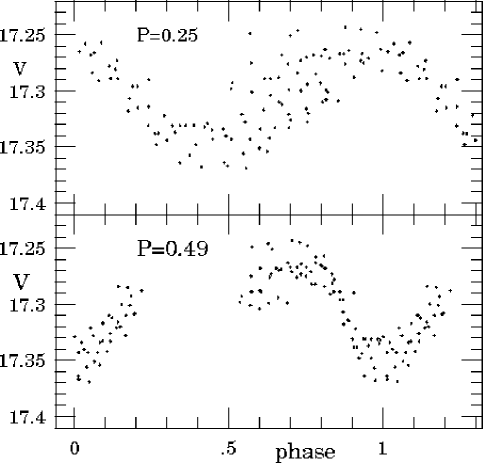
This star has been given the sequential number V238, in continuation with the numbering scheme of the catalogue of Helen Sawyer Hogg. The photometric data at the light maximum are: , . The light variations of V238 can be phased with two possible periods: day and day. The corresponding light curves are shown in Figure 6. One can see that adoption of the longer period leads to a smaller scatter of the phased light curve. The colour index at maximum light and the short period suggest a contact binary of the W UMa-type (EW). However, the period of 0.25 day is very short for the observed colour, if the star follows the standard period-colour relation for contact binaries; the period of 0.49 day seems to be more likely. The light curve is poorly covered when the longer period is assumed; especially poorly covered is the secondary minimum, which seems to be relatively shallow implying a poor-thermal-contact or semi-detached binary (EB type).
V238 is a very interesting and somewhat mysterious binary, irrespective of whether it is a member of M3 or lies in front of it. If it is a member of the cluster, then its position on the CMD, close to the giant branch, is unusual. We do not know any EW or EB binaries with comparably short orbital periods; such periods would be hard to reconcile with giant star dimensions. We also do not know any spotted giants of the FK Comae type which would rotate that rapidly, at the brink of the rotational breakup. The assumption that the star is a contact binary with day leads – via the calibrations (Rucinski 1994, 1995) – to a prediction of for the cluster parameters of and . The metallicity correction here is large, about +0.5 mag; therefore, if the binary is not in the cluster and has solar metallicity, then . This is a prediction for a genuine EW contact system; if this is an EB system, then the star is probably fainter, as the calibrations tend to over-estimate luminosities in such situations (Rucinski & Duerbeck 1997). These numbers disagree with the absolute magnitude of V238 if it is a cluster member: With (Harris 1996), it should have . Thus, it appears that the binary is projected onto the cluster. This is not a trivial resolution of the mystery, as at , the implied distance from the galactic plane would be kpc. This would make V238 not only the most distant of known galactic contact binaries, but also a most distant one from the galactic plane.
4 RR Lyrae Variables
Among the 42 RR Lyrae variables that we rediscovered were 33 of Bailey type ab (fundamental mode pulsators), 7 type c (first overtone mode) and two double-mode pulsators (RRd stars). The variables, their Bailey types and periods are listed in Table 2; the designation N (north) or S (south) indicates the field in which the variable was located. For the most part, the periods we adopted are either those listed by Szeidl (1965) in his major study of the cluster, or within 0.001 day of those periods. (The only exceptions are V203 which was not studied by Szeidl and V79, the star that has switched modes (cf. section .) Also listed in the table are the mean magnitudes and the amplitudes determined by fitting the light curve of each star to a 6th order Fourier series, i. e. an equation of the form:
| (3) |
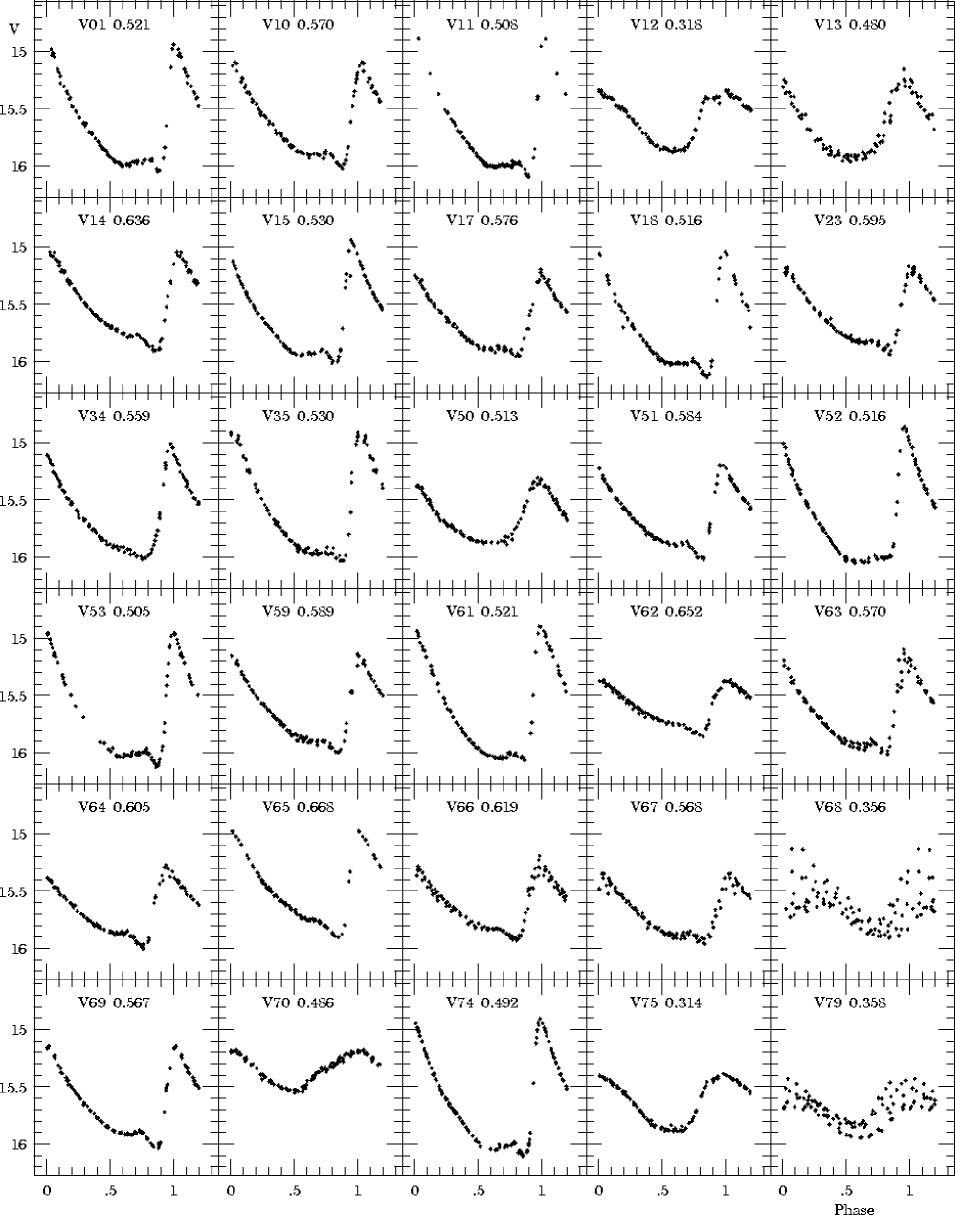
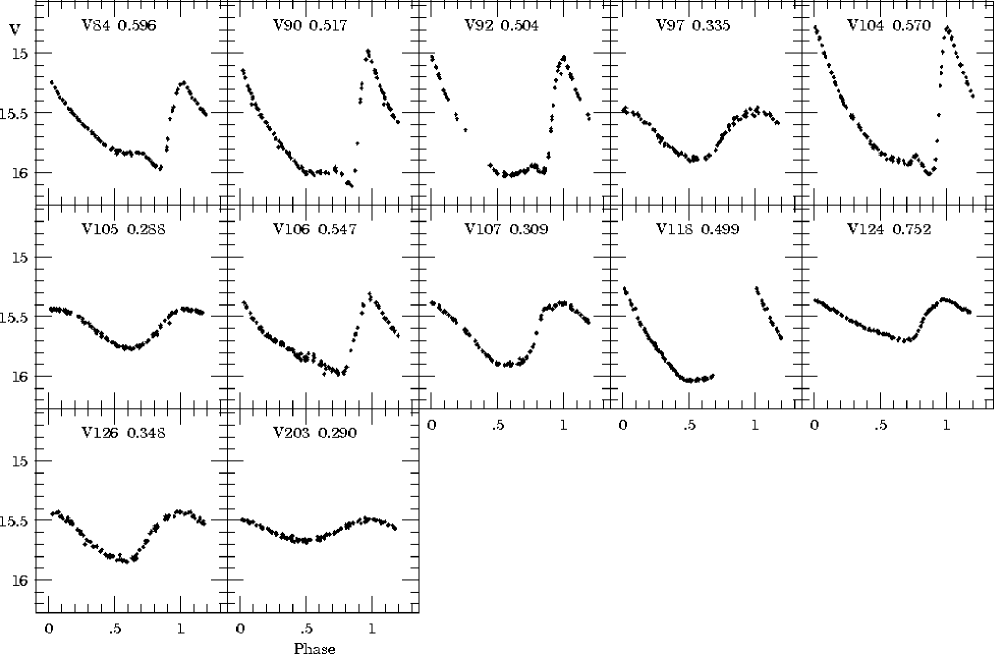
according to the method of Simon & Teays (1982). The mean magnitudes listed in Table 2 are the values that we obtained from the above fits. For the RRab stars, we also list the maximum deviation parameter as defined by Jurcsik & Kovacs (1996, hereafter referred to as JK) for establishing whether or not a star has an irregular light curve. The light curves for the RR Lyrae variables are shown in Figures 7 & 8. Stars with are considered to be irregular. An examination of the light curves of Figs. 7 and 8 indicate that, in general this is the case, but there are some exceptions. In our light curves for V63 and V66, the magnitude of maximum light is different on different nights, even though the for both of these stars is considerably less than 3. Szeidl (1965) also commented that the light curves for these two stars varied. On the other hand, for V11 and V84, both with greater than 3, our light curves and Szeidl’s study do not reveal any variations in the light curve.
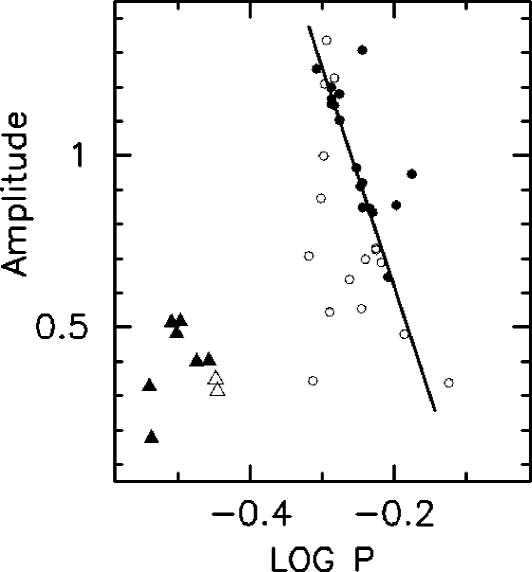
The period-amplitude relation is plotted in Figure 9 where the symbols are as follows: open circles for the RRab stars with , solid circles for the those with , open triangles for the RRd stars (plotted with their overtone periods) and solid triangles for the RRc stars. There are some interesting features to note in the diagram. Among the RRab stars, most of the stars with the irregular light curves have lower amplitudes than the others. These are probably ‘Blazhko variables’ where the amplitude of the light variation is modulated at a longer period than the basic pulsation. In a study of Blazhko variables, Szeidl (1988) found that the highest amplitude of a Blazhko star fits the period-amplitude relation of the regular RRab stars. In the 15 day interval of our observations, we may have observed some of the Blazhko stars during their phase of maximum amplitude. This explains why some of them fit in with the regular RRab stars in the period-amplitude plot while most of them have lower amplitudes. One can also see that most of the regular RRab stars (solid circles) form a tight sequence in the diagram, but three have high amplitudes for their periods when compared with the others. These three stars (V14, V65 and V104) are also the three brightest of the ‘regular’ RRab stars. This implies that there is a period-luminosity-amplitude relation, as previously noted by Sandage (1981a) in a study of M3. We shall discuss this further in section .
In Figure 9, most of the RRc and RRd stars form a continuous sequence of decreasing amplitude with increasing period, but V105 and V203, the two stars with the shortest periods, do not fit into this sequence. Sandage (1981b) determined colours and temperatures for some of the RR Lyrae variables in M3 and in his plot of ‘reduced’ period against temperature, it can be seen that these two stars have shorter periods than other stars with the same temperature. This is evidence that the two stars might be second overtone pulsators (RRe stars). In a recent study of the globular cluster IC 4499, Walker & Nemec (1996) found a distribution of amplitude with period similar to Figure 9 and they considered the short period variables to be RRe stars. However, the models of Bono et al. (1997) indicate that there are short period first overtone pulsators with low amplitudes like those of V105 and V203. Thus they could also be RRc stars. Stellingwerf et al. (1987) predicted that, if RRe stars exist, they should have a light variation that has a sharper peak at maximum light than first overtone pulsators. The light curves in Figure 9 indicate that this may be the case for V203, but not for V105. We have therefore tentatively classified V105 and V203 as RRc stars, but note that they may be RRe stars.
4.1 Fourier Analysis of the RRc Variables
Using hydrodynamic pulsation models, Simon & Clement (1993, hereafter referred to as SC) showed that physical properties such as mass, luminosity, temperature and a helium parameter could be computed for RRc stars from the pulsation period and the Fourier phase parameter where (see equations 2, 3, 6 and 7 of their paper). In an application of their method to photographic data for RRc stars in six galactic globular clusters, they found that mean masses and luminosities increase and mean temperatures fall with decreasing cluster metallicity. Since the original study of SC, CCD observations of RR Lyrae variables in a number of clusters have been published and this has made it possible to calculate Fourier parameters with higher precision than those derived from photographic data. Subsequent studies based on CCD data (Clement et al. 1995, Clement & Shelton 1996, 1997) confirm SC’s original result. To continue the endeavour to compute physical parameters for RRc stars in globular clusters, we apply the technique to the RRc stars that we observed in M3. For this analysis, we considered only stars for which the error in is . It is not desirable to have errors larger than this because an error of in leads to an uncertainty of in mass, in magnitude and 20K in temperature. The errors in for five of the RRc stars that we have studied in M3 are all less than . For the other two, V105 and V203, which may in fact be RRe stars, the errors are somewhat larger, mainly because of their low amplitudes. The physical parameters (mass, luminosity, temperature and relative helium abundance) that we have derived are listed in Table 3, along with the values and their standard errors computed according to the method of Petersen (1986) and the temperatures derived by Sandage (1981b) from the [] colour.
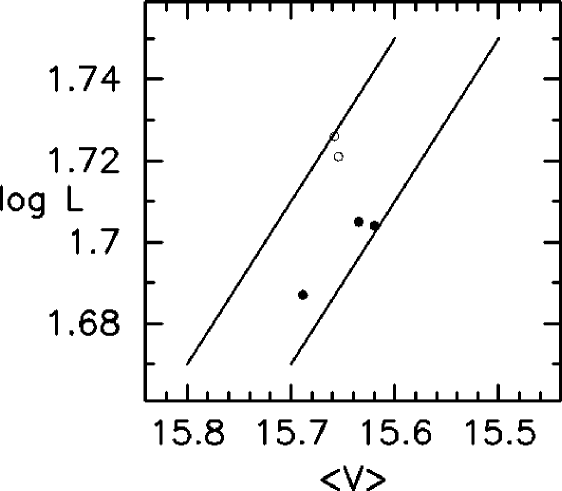
In Figure 10, we show a plot of against mean . The stars in the north and south fields are plotted with different symbols because there could be a systematic difference of up to in magnitude between the two fields. The envelope lines have a slope of and are separated by in , which represents the uncertainty in the values of computed from and period. All of the points fit between the two lines and so our analysis indicates that SC’s equation gives the correct ranking for .
The masses we list for these stars in Table 3 can be compared with masses for the RRd stars in M3. Nemec & Clement (1989) analysed published observations of the two RRd stars V68 and V87. For V68, they determined a fundamental period and period ratio , but for V87, they could not determine a definitive value for the period ratio because of an uncertainty in the value of . From the Petersen diagram of Cox (1995), we estimate a mass of for V68 if and if . This is comparable to the masses we have derived from SC’s equations for V107 and V75, but somewhat larger than the masses for the other stars, particularly V97 and V126 for which we derived . Evolutionary models (Dorman et al. 1993; Yi et al. 1993) do not predict masses as low as in the instability strip. However, de Boer et al. (1997) have estimated a mean mass of for some field HB stars, a value that is also low when compared with evolutionary models. They derived these HB masses from , , luminosity and Hipparcos parallaxes. Thus the masses that we have derived from SC’s equation are comparable to those determined by other methods.
From Table 3, we see that the temperatures that Sandage (1981b) derived are different from the ones we computed from , but both methods indicate that V12 is the hottest and V126 is the coolest and the coefficient of correlation between the two sets of values is . Sandage also derived temperatures from . These are about 100K lower than the ones he derived from , but they are highly correlated with them (coefficient of correlation ). Smith (1995) has pointed out that it is difficult to establish the effective temperature for a pulsating star to better than 300K.
In Table 4, we compare the mean parameters that we have derived for the M3 RRc stars with those determined for other clusters. This is an update to Table 6 of Clement & Shelton (1997) with the mean absolute magnitudes () and the Oosterhoff type included. These mean magnitudes were calculated from , assuming a value of for of the sun (Bishop 1996) and using the bolometric correction formula adopted by Sandage & Cacciari (1990). The [Fe/H] values listed are from Jurcsik (1995) and HB refers to the parameter (B-R)/(B+V+R) of Lee et al. (1994). The mean parameters for each cluster are based only on stars for which the error in is . In the Clement & Shelton (1997) paper, the parameters that we quoted for M3 were based on values published by Cacciari & Bruzzi (1993), but these latter authors did not quote any errors for their Fourier parameters and so we have not included their data here. The mean values of , temperature and helium parameter that we derive from our data are the same as those from Cacciari & Bruzzi (1993), but our mean mass is less than theirs. This difference could occur either because our sample of only five RRc stars is not a good representation of the RRc stars in M3 or because the Cacciari & Bruzzi sample included a number of stars for which the uncertainty in was greater than . It is important to have accurate values for a larger sample of the RRc stars in M3 because the masses of these stars have important implications for stellar evolution theory. According to Lee et al. (1990), the RR Lyrae variables in the Oosterhoff type II clusters have evolved away from the horizontal branch and therefore should have higher luminosities and lower masses than those in the type I clusters which are on the ZAHB. If the mean mass of the RRc stars in M3 turns out to be greater than the mean mass for M9 and NGC 2298, this will substantiate the Lee et al. (1990) hypothesis.
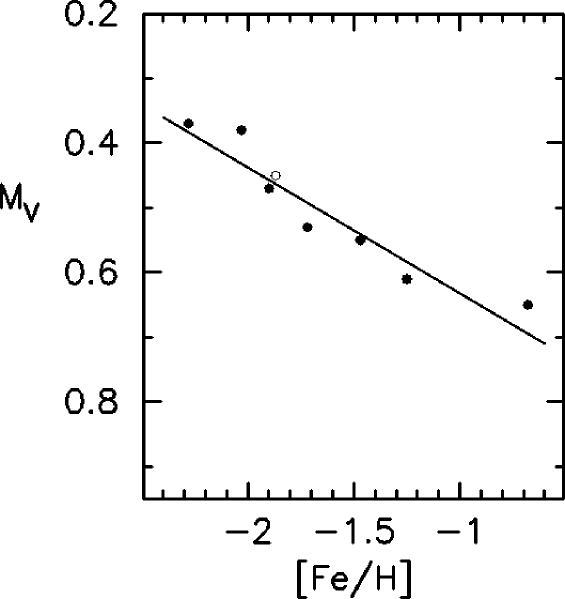
Using the data of Table 4, Clement (1996) derived a luminosity-[Fe/H] relation:
| (4) |
This is plotted in Figure 11. The line drawn through the points represents the above equation. The open circle is the mean () that Mandushev et al. (1996) derived for the HB of the globular cluster M55 by main sequence fitting to nearby subdwarfs with known trigonometric parallaxes. The agreement is excellent, but the absolute magnitudes calculated from equation (4) are brighter than those calibrated by statistical parallax (Layden et al. 1996) or by the Baade-Wesselink method (Fernley 1994, Clementini et al. 1995). However, there are other investigations that predict brighter values for . For example, a study of the RRd stars in the LMC by Alcock et al. (1997) indicates that the RRd stars have ranging from to . The stars in question probably have [Fe/H] between and (Alcock et al. (1996) and so their results are in good agreement with the data in Table 4. The luminosities derived by Sandage (1993) from pulsation theory are also similar to our values. His -[Fe/H] relation is:
| (5) |
It differs in slope from the one we list because he uses Zinn’s (1985) metallicity scale which does not have as large a range as that of Jurcsik (1995). Using Zinn’s scale, Clement (1996) derived
| (6) |
which is similar to Sandage’s (1993) relation. Even with new data available from the Hipparcos satellite, the controversy over the luminosity of RR Lyrae stars continues. RR Lyrae magnitudes determined by Reid (1997) based on trigonometric parallax measurements of local subdwarfs are considerably brighter that those derived from statistical parallaxes of RR Lyrae stars (Fernley et al. 1997, Tsujimoto et al. 1997). For the RR Lyrae variables in M5, M15 and M68, Reid (1997) derived , and respectively, values that are even brighter than the ones we list for these clusters in Table 4. Taking a different approach, Feast & Catchpole (1997) applied the Cepheid P-L relation calibrated with Hipparcos trigonometric parallaxes to horizontal branch stars in the LMC and M31 and estimated that for RR Lyrae variables with [Fe/H] which is also brighter than the Table 4 values. Thus, at the present time, there is still considerable uncertainty about the absolute magnitudes of RR Lyrae stars. The various methods for deriving the absolute magnitudes predict values that span a range of approximately mag for the RR Lyrae variables in metal poor clusters like M15 and M68 and mag for more metal rich clusters like M5. These differences could arise because of invalid assumptions in some of the methods, or they could occur because the different methods have been applied to stars with different properties. It is well known that the luminosity of an RR Lyrae star depends on its evolutionary state. What if most field RR Lyrae stars are less evolved than cluster RR Lyrae stars with the same metallicity? This could explain why the statistical parallax method, which has been applied only to field stars, indicates lower luminosities than main sequence fitting from trigonometric parallaxes of subdwarfs, which has been applied only to globular cluster stars. These are some of the issues that need to be addressed before we can have a full understanding of RR Lyrae luminosities.
4.2 Analysis of the RRab Variables
In a recent series of papers, JK, Kovács & Jurcsik (1996, 1997; hereafter referred to as KJ96, KJ97) and Jurcsik (1997, hereafter refered to as J97) have shown that metallicity, absolute magnitudes, intrinsic colours and temperatures of RRab stars can be expressed as linear combinations of period and the low-order amplitudes and phases of the Fourier decomposition of their light curves. Specifically, their formulae are
| (7) |
| (8) |
| (9) |
and
| (10) |
The formulae are valid only for RRab stars with ‘regular’ light curves, i. e. stars for which the maximum deviation parameter is less than 3. According to Table 2, seventeen of the RRab stars in our sample have ‘regular’ light curves and so we can use these stars to test the various formulae of JK, KJ96, KJ97 and J97. In Table 5, we list the values we derived for , and from equation (3) and the , temperature and [Fe/H] that we computed from equations (7), (8) and (10) for these 17 RRab stars. (At the bottom of the table, we also include the data for the two stars V11 and V84 which appear to have regular light curves, but have .) Before we applied their equations, we added to the values and subtracted from the values that we list in Table 5 because our Fourier parameters were derived from a cosine series, while theirs were from a sine series.
The mean value of [Fe/H] derived from for the (first) 17 RRab stars listed in Table 5 is with a standard deviation of . This is in good agreement with [Fe/H]=, the value that Jurcsik (1995) adopted for M3, based on spectroscopic observations. Thus, our data vindicate the formula of JK.
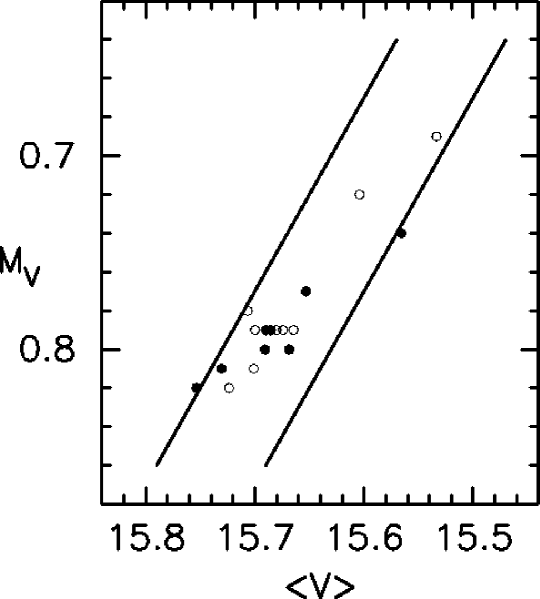
In Figure 12, we plot the values calculated from equation (8) against mean for the 17 stars of Table 5. The stars in the north and south fields are plotted with different symbols because there could be a systematic difference of up to in magnitude between the two fields. The envelope lines, plotted with a slope of unity, are separated by which represents the uncertainty in the calibration of KJ96. All of the points fall within these boundaries, thus indicating that equation (8) reproduces the correct ranking of relative luminosity for the RRab stars in M3. The actual values are fainter than the one we list for M3 in Table 4 because the zero point for equation (8) was calibrated with Baade-Wesselink luminosities published by Clementini et al. (1995). The mean that we have calculated for these 17 stars is magnitude brighter than the that Clement and Shelton (1997) derived by the same method for three RRab stars in the more metal rich globular cluster NGC 6171, thus confirming that RR Lyrae in metal rich systems are fainter.
An interesting feature of Figure 12 is the fact that there are three stars that are brighter than the others. They have a mean magnitude of compared with for the other 14. These three stars (V14, V65 and V104) are the three that do not fit into the sequence of ‘regular’ RRab stars in the period-amplitude plot of Figure 9. Sandage (1981a) also noted a scatter in the period- amplitude relation for M3 and attributed it to the fact that, as a consequence of the period-mean density law for pulsating variable stars, the more luminous stars are expected to have longer periods. The period-mean density relation for Oosterhoff type I compositions derived by Cox (1995) from models calculated with OPAL opacities is:
| (11) |
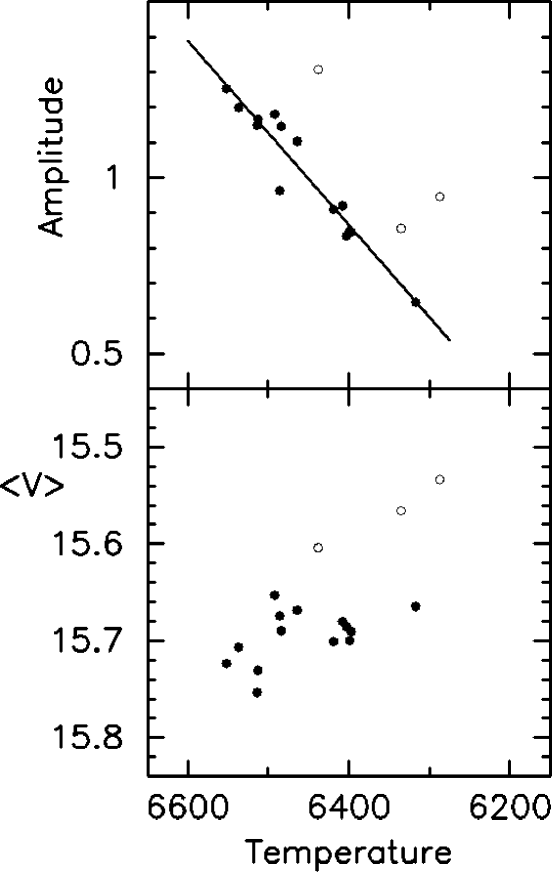
Sandage corrected for the luminosity effect by using the period-mean density relation to calculate a ‘reduced’ period for each star. The ‘reduced’ period is the period a star would have if its luminosity were the same as the mean luminosity of all of the RR Lyrae variables in the cluster. He found that, in a plot of amplitude against ‘reduced’ period, the scatter in the period-amplitude plot was considerably reduced. At the time of Sandage’s (1981a) study, it was assumed that amplitude was a unique function of temperature, but this assumption is no longer considered valid. Since we have derived temperatures for the RRab stars with regular light curves, we can use these temperatures to test this. A plot of amplitude versus temperature is shown in the upper panel of Figure 13. The three brightest stars V14, V65 and V104 are plotted as open circles and the others are solid circles. The straight line in the diagram is a least squares fit to the solid circles. The diagram indicates that the three bright stars all have low temperatures compared with other stars with the same amplitude. If equation (10) is valid for calculating temperature, then there is not a unique amplitude-temperature relation for the RRab variables in M3. The amplitude-temperature relation is a function of luminosity as well. The models of Bono et al. (1997) also show that the amplitude-temperature relation for RRab stars is a function of mass and luminosity in the sense that lower masses and/or higher luminosities cause the amplitude to be higher at a given temperature. This is exactly what we see in Figure 13. In the lower panel of the diagram, we plot mean magnitude against temperature. The points delineate a typical horizontal branch evolutionary track (cf. Yi et al. 1993). Most of the stars appear to be on the ZAHB, but the three brightest stars are in a more advanced evolutionary state. One might therefore expect these three stars to have increasing periods, but Szeidl’s (1965) study of period changes does not indicate this to be the case. His analysis, based on diagrams plotted for observations made over an interval of approximately 65 years, showed an increasing period for V14, a decreasing period for V104 and a fluctuating period for V65. However, it is generally accepted (cf. Smith 1995) that most of the observed period changes of RR Lyrae variables are not caused by evolution on the horizontal branch. Rathbun & Smith (1997) pointed out that the observed rates of period change can be too large and of the wrong sign because of a period change ‘noise’ that overlies evolutionary period changes. Thus the failure to detect period increases for V65 and V104 does not mean they have not yet evolved away from the ZAHB.
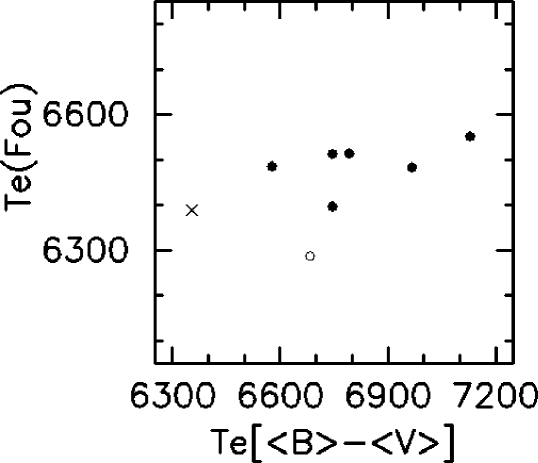
As previously noted, the temperatures in Table 5 were calculated from equation (10) that relates temperature to the values of and [Fe/H] calculated from equations (7) and (9). Thus the temperatures have been derived from the pulsation period and Fourier parameters. It would be useful to have an independent derivation of the temperatures for these stars. Sandage (1981b) derived temperatures for seven of these stars (V1, V18, V34, V51, V65, V74 and V90), and also for V84, from and from []. In Figure 14, we plot the temperatures calculated from the J97 formula against those that Sandage derived from []. The correlation between the temperatures derived by the two methods for these eight stars is not very strong (coefficient of correlation ), and it is not clear whether or not V65 fits in with the other points in the diagram. If we exclude V65, the correlation is stronger (). Thus it is not clear from our data whether or not J97’s formula for calculating the effective temperature for RRab stars from Fourier parameters is valid. Since our conclusion that there is not a unique amplitude-temperature relation for the RRab stars in M3 is based on the temperatures that we calculated for the three bright stars (V14, V65 and V104) from Fourier parameters, this conclusion is called into question.
4.3 The RRd Variables
The analysis of RRd stars is often a useful method for determining stellar masses, but such analyses require that the periods be known to a precision of 4 figures. Since our observations were made over an interval of only two weeks, we can not determine periods for the two RRd stars with the necessary precision. However, what is interesting about these stars is the fact that the strength of the first overtone oscillations has increased since they were last observed. In fact, previous studies indicated that V79 was an RRab star and now it is an RRd star with the first overtone dominating. This result, which has been discussed in another paper by us (Clement et al. 1997), indicates blueward evolution on the horizontal branch.
5 Summary
From a photometric time-sequence survey of 4077 stars (including 25 BSS) with in the globular cluster M3, we have been unable to find any definite eclipsing binary stars. We have discovered only one likely eclipsing binary and one SX Phe type star in spite of monitoring 4077 stars with and observing 25 BSS. The newly identified SX Phe star, V237, shows a light curve with a variable amplitude. It may be the first known SX Phe star exhibiting the Blazhko effect. An alternative interpretation is that V237 shows non-radial pulsations. Variable V238 shows variability either with the period of 0.49 d or with period of 0.25 d. Adoption of the longer period leads to classification of V238 as a close eclipsing binary. On the cluster colour-magnitude diagram, the variable occupies a position a few hundredths of magnitude to the blue of the base of the red giant branch. V238 is a likely descendent of a binary blue straggler.
As a side result we obtained high quality data for 42 of the previously known RR Lyrae variables, including 33 of Bailey type ab, 7 type c and 2 double-mode pulsators. We used equations that relate the physical properties of RRc stars to their pulsation periods and Fourier parameters to derive masses, luminosities, temperatures and helium parameters for five of the RRc stars. The derived values for mass, luminosity and temperature are in reasonable agreement with values obtained by other methods. A comparison of these new values with the data for six other galactic globular clusters confirms previous results that indicated that mean masses and mean luminosities increase and mean temperatures and helium abundances decrease with decreasing cluster metal abundance. We also tested equations that relate [Fe/H], and temperature of RRab stars to pulsation period and Fourier parameters. We derived [Fe/H] in good agreement with spectroscopic determinations. We also found that the derived values correlated well with the observed mean magnitudes. If the derived temperatures are correct, then our observations demonstrate that there is not a unique amplitude-temperature relation for the RRab stars in M3. The amplitude-temperature relation depends on luminosity. One of the RRd stars (V79) has switched modes. In previous studies, it was classified as RRab, but our observations show that it is an RRd star with the first overtone mode dominating. This indicates blueward evolution on the horizontal branch.
acknowledgements
We thank the PATT for the award of telescope time at the Isaac Newton Group of telescopes at the Roque de Los Muchachos Observatory, La Palma, Canary Islands, and the technical staff for their assistance.
RWH thanks the Particle Physics and Astronomy Research Council for the award of a research grant in support of this work. JK was supported by the Polish Committee of Scientific Research through grant 2P03D-011-12 and by NSF grant AST-9528096 to Bohdan Paczyński. CMC and SMR were supported by operating grants from the Natural Sciences and Engineering Research Council of Canada.
References
- [1] Alcock, C. et al. 1996, AJ, 111, 1146
- [2] Alcock, C. et al. 1997, ApJ, 482, 89
- [3] Bailyn, C. D. 1995, ARAA, 33, 133
- [4] Bishop, R. L. 1996, in Observer’s Handbook 1997 (Royal Astronomical Society of Canada) p. 23
- [5] Bono, G., Caputo, F., Castellani, V. & Marconi, M. 1997, A&AS, 121, 327
- [6] Buonanno, R., Corsi, C., Buzzoni, A., Cacciari, C., Ferraro, F. R. & Fusi Pecci, F. 1994, A&A, 290, 69
- [7] Cacciari, C. & Bruzzi, A. 1993, A&A 276, 87
- [8] Clement, C. 1996, BAAS, 28, 1384
- [9] Clement, C. M., Bezaire, J. & Giguere, D. 1995, AJ, 110, 2200
- [10] Clement, C. M., Hilditch, R. W., Kaluzny, J. & Rucinski, S. M. 1997, ApJ Letters (in print)
- [11] Clement, C. M., Jankulak, M. & Simon, N. R. 1992, ApJ, 395, 192
- [12] Clement, C. M & Shelton, I. 1996, AJ, 112, 618
- [13] Clement, C. M & Shelton, I. 1997, AJ, 113, 1711
- [14] Clementini, G., Carretta, E., Gratton, R., Merighi, R., Mould, J. R. & McCarthy, J. K. 1995, AJ, 110, 2319
- [15] Cox, A. N. 1995, In Astrophysical Applications of Powerful New Data bases, ASP Conf. Ser. 78, edited by S. J. Adelman and W. L. Wiese, ASP (San Francisco), p. 243
- [16] de Boer, K. S., Geffert, M., Tucholke, H.-J. & Schmidt, J. H. K. 1997 (Hipparcos Venice ’97 Conference)
- [17] Dorman, B., Rood, R. T. & O’Connell, R. W. 1993, ApJ, 419, 596
- [18] Feast, M. W. & Catchpole, R. M. 1997, MNRAS, 286, L1
- [19] Fernley, J. 1994, A&A, 284, L16
- [20] Fernley, J., Barnes, T. G., Skillen, I., Hawley, S. L., Hanley, C. J., Evans, D., Solano, E. & Garrido, R. 1997 (Hipparcos Venice ’97 Conference)
- [21] Ferraro, F. R., Fusi Pecci, F., Cacciari, C., Corsi, C., Buonanno, R., Fahlman, G. G. & Richer, H. B. 1993, AJ, 106, 2324
- [22] Fusi Pecci, R., Ferraro, F. R., Corsi, C. E., Cacciari, C., & Buonanno, R. 1992, AJ, 104, 1831
- [23] Guhathakurta, P., Yanny, B., Bahcall, J. N. & Schneider, D. P. 1994, AJ, 108, 1786
- [24] Harris, W.E. 1996, AJ, 112, 1487
- [25] Hut P., McMillan, S., Goodman, J., Mateo, M., Phinney, E. S., Pryor, C., Richer, H. B., Verbunt, F. & Weinberg, M. 1992, PASP, 104, 981
- [26] Jurcsik, J. 1995, ActaA, 45, 653
- [27] Jurcsik, J. 1997, submitted to A&A (J97)
- [28] Jurcsik, J. & Kovács, G. 1996, A&A, 312, 111 (JK)
- [29] Kaluzny, J., Kubiak, M., Szymanski, M., Udalski, A, Krzeminski, W., Mateo, M. 1995, A&AS, 112, 407
- [30] Kaluzny, J., Kubiak, M., Szymanski, M., Udalski, A, Krzeminski, W., Mateo, M. 1996, A&AS, 120, 139
- [31] Kovács, G. & Jurcsik, J. 1996, ApJ, 466, L17 (KJ96)
- [32] Kovács, G. & Jurcsik, J. 1997, A&A, 322, 218 (KJ97)
- [33] Layden, A. C., Hanson, R. B., Hawley, S. L., Klemola, A. R. & Hanley, C. J. 1996, AJ, 112, 2110
- [34] Landolt, A.U. 1992, AJ 104, 340
- [35] Lee, Y.-W., Demarque, P. & Zinn, R. 1990, ApJ, 350, 155
- [36] Lee, Y.-W., Demarque, P. & Zinn, R. 1994, ApJ, 423, 248
- [37] Leonard, P. J. T. 1989, AJ, 98, 217
- [38] Leonard, P. J. T. & Fahlman, G. G. 1991, AJ, 102, 994
- [39] Mandushev, G. I., Fahlman, G. G., Richer, H. B. & Thompson, I. B. 1996, AJ, 112, 1536
- [40] Nemec, J. M. & Clement, C. M. 1989, AJ, 98, 860
- [41] Nemec, J. M. & Park, N.-K. 1996, In The Origins, Evolution and Destinies of Binary Stars in Clusters, ASP Conf. Ser. 90, edited by E. F. Milone and J.-C. Mermilliod ASP (San Francisco), p. 359
- [42] Petersen, J. O. 1986, A&A, 170, 59
- [43] Rathbun, P. G. & Smith, H. A. 1997, PASP, (October issue)
- [44] Reid, I. N. 1997, AJ, 114, 161
- [45] Roberts, D.H., Lehar, J., Dreher, J.W. 1987, AJ 93, 968
- [46] Rucinski, S.M. 1994, PASP, 106, 462
- [47] Rucinski, S.M. 1995, PASP, 107, 648
- [48] Rucinski, S.M. & Duerbeck, H.W. 1997, PASP, submitted
- [49] Sandage, A. 1953, AJ, 58, 61
- [50] Sandage, A. 1981a, ApJ, 244, L23
- [51] Sandage, A. 1981b, ApJ, 248, 161
- [52] Sandage, A. 1993, AJ, 106, 703
- [53] Sandage, A. & Cacciari, C. 1990, ApJ, 350, 645
- [54] Sarajedini, A. & da Costa, G. S. 1991, AJ, 102, 628
- [55] Saust, A. B. 1997, Los Alamos preprint astro-ph/9706217 (to be submitted to ApJ)
- [56] Sawyer Hogg, H. 1973, Publ. DDO 6, No. 3, p. 1
- [57] Schechter, P.L., Mateo, M., Saha, A. 1993, PASP, 105, 1342
- [58] Schwarzenberg-Czerny, A. 1991, MNRAS 253, 198
- [59] Simon, N. R. & Clement, C. M. 1993, ApJ, 410, 526 (SC)
- [60] Simon, N. R. & Teays, T. J. 1982, ApJ, 261, 586
- [61] Smith, H. A. 1995, RR Lyrae Stars (Cambridge University Press)
- [62] Stellingwerf, R. F., Gautschy, A. & Dickens, R. J. 1987, ApJ, 313, L75
- [63] Stetson, P., 1987, PASP, 99, 191
- [64] Stryker, L. L. 1993, PASP, 105, 1081
- [65] Szeidl, B. 1965, Budapest Mitt. No. 58
- [66] Szeidl, B. 1988, in Multimode Stellar Pulsations, ed. G. Kovacs, L. Szabados, & B. Szeidl (Budapest Konkoly Observatory), p. 45
- [67] Tsujimoto, T., Miyamoto, M. & Yoshii, Y. 1997, (Hipparcos Venice ’97 Conference)
- [68] Walker, A. R. & Nemec, J. M. 1996, AJ, 112, 2026
- [69] Yi, S., Lee, Y.-W. & Demarque, P. 1993, ApJ, 411, L25
- [70] Zinn, R. 1985, ApJ, 293, 424
| Var | [days] | X | Y | Type | |||
|---|---|---|---|---|---|---|---|
| V237 | 17.90 | 18.10 | 0.15 | 0.04010 | 19 | -181 | SX Phe |
| V238 | 17.25 | 17.35 | 0.58 | 0.4983 | 55 | -265 | Ecl? |
Remarks:
-
XY:
The rectangular coordinates X & Y are offsets in arcsec from the cluster center. The coordinates are tied to the system of rectangular coordinates from the Sawyer Hogg (1973) catalogue.
-
V238:
Period P=0.25 d is also feasible but excludes classification of variable as eclipsing binary (see Fig. 6).
| Variable | Bailey | Period | Amplitude | ||
| & Field | type | (days) | (V) | ||
| 1 (S) | ab | 0.5206250 | 15.6899 | 1.1461 | 2.1 |
| 10 (N) | ab | 0.5695185 | 15.6803 | 0.9203 | 1.4 |
| 11 (S) | ab | 0.5078918 | 15.6861 | 1.3357 | 3.5 |
| 12 (S) | c | 0.3178890 | 15.6198 | 0.5156 | |
| 13 (S) | ab | 0.4799 | 15.6803 | 0.7072 | 38.5 |
| 14 (S) | ab | 0.6359019 | 15.5658 | 0.8556 | 2.0 |
| 15 (S) | ab | 0.5300794 | 15.6686 | 1.1034 | 1.2 |
| 17 (S) | ab | 0.5757 | 15.6939 | 0.6978 | 7.6 |
| 18 (S) | ab | 0.5163623 | 15.7534 | 1.1492 | 2.2 |
| 23 (N) | ab | 0.5953756 | 15.6326 | 0.7293 | 6.9 |
| 34 (N) | ab | 0.5591012 | 15.6743 | 0.9635 | 1.9 |
| 35 (S) | ab | 0.5296 | 15.6530 | 1.1796 | 2.3 |
| 50 (S) | ab | 0.5130879 | 15.6861 | 0.5435 | 9.5 |
| 51 (S) | ab | 0.5839818 | 15.6906 | 0.8461 | 1.9 |
| 52 (N) | ab | 0.5162250 | 15.7067 | 1.1988 | 2.7 |
| 53 (N) | ab | 0.5048878 | 15.7245 | 1.2088 | 19.5 |
| 59 (S) | ab | 0.5888053 | 15.6854 | 0.8337 | 1.5 |
| 61 (N) | ab | 0.5209312 | 15.7021 | 1.2253 | 3.4 |
| 62 (N) | ab | 0.6524077 | 15.6313 | 0.4796 | 5.7 |
| 63 (N) | ab | 0.5704164 | 15.6997 | 0.8489 | 2.4 |
| 64 (N) | ab | 0.6054588 | 15.6972 | 0.6883 | 3.7 |
| 65 (N) | ab | 0.6683397 | 15.5335 | 0.9460 | 2.2 |
| 66 (N) | ab | 0.6191 | 15.6645 | 0.6463 | 1.6 |
| 67 (N) | ab | 0.5683609 | 15.7267 | 0.5535 | 16.3 |
| 68 (N) | d | 0.356 | 15.6359 | 0.348 | |
| 69 (N) | ab | 0.5665878 | 15.7009 | 0.9097 | 1.2 |
| 70 (N) | ab | 0.4865 | 15.3660 | 0.3434 | 25.2 |
| 74 (N) | ab | 0.4921441 | 15.7237 | 1.2526 | 2.0 |
| 75 (N) | c | 0.3140790 | 15.6544 | 0.4809 | |
| 79 (N) | d | 0.358 | 15.7122 | 0.313 | |
| 84 (N) | ab | 0.5957289 | 15.6733 | 0.7246 | 4.1 |
| 90 (S) | ab | 0.5170334 | 15.7305 | 1.1658 | 2.9 |
| 92 (S) | ab | 0.5035553 | 15.7330 | 0.9990 | 18.1 |
| 97 (S) | c | 0.3349289 | 15.6886 | 0.4000 | |
| 104 (N) | ab | 0.5699231 | 15.6040 | 1.3070 | 2.2 |
| 105 (N) | c? | 0.2877427 | 15.6014 | 0.3264 | |
| 106 (N) | ab | 0.5471593 | 15.7183 | 0.6389 | 9.8 |
| 107 (N) | c | 0.3090351 | 15.6580 | 0.5138 | |
| 118 (S) | ab | 0.4993807 | 15.7424 | 0.8754 | 4.8 |
| 124 (S) | ab | 0.7524328 | 15.5423 | 0.3371 | 12.0 |
| 126 (S) | c | 0.3484043 | 15.6348 | 0.4019 | |
| 203 (S) | c? | 0.28964 | 15.5877 | 0.1758 |
| Star | Mass | Temp | helium | Temp | |||
| () | () | parameter | |||||
| V203 | 5.56 | 0.69 | — | — | — | — | 7447 |
| V105 | 3.12 | 0.24 | — | — | — | — | 7516 |
| V107 | 2.66 | 0.05 | 0.682 | 1.726 | 7304 | 0.265 | 7345 |
| V75 | 2.86 | 0.04 | 0.650 | 1.721 | 7306 | 0.268 | 7244 |
| V12 | 3.24 | 0.07 | 0.595 | 1.704 | 7329 | 0.275 | 7396 |
| V97 | 3.89 | 0.12 | 0.513 | 1.687 | 7340 | 0.284 | |
| V126 | 3.94 | 0.13 | 0.523 | 1.705 | 7298 | 0.279 | 7063 |
| Cluster | Oosterhoff | [Fe/H] | HB | No.of | mean | mean | mean | mean | mean |
|---|---|---|---|---|---|---|---|---|---|
| type | stars | mass | temp | helium | Mv | ||||
| NGC 6171 | I | -0.68 | -0.76 | 6 | 0.53 | 1.65 | 7447 | 0.29 | 0.65 |
| M5 | I | -1.25 | 0.19 | 7 | 0.58 | 1.68 | 7388 | 0.28 | 0.61 |
| M3 | I | -1.47 | 0.08 | 5 | 0.59 | 1.71 | 7315 | 0.27 | 0.55 |
| M9 | II | -1.72 | 0.87 | 1 | 0.60 | 1.72 | 7299 | 0.27 | 0.53 |
| NGC 2298 | II | -1.90 | 0.93 | 2 | 0.59 | 1.75 | 7200 | 0.26 | 0.47 |
| M68 | II | -2.03 | 0.44 | 16 | 0.70 | 1.79 | 7145 | 0.25 | 0.38 |
| M15 | II | -2.28 | 0.72 | 6 | 0.73 | 1.80 | 7136 | 0.25 | 0.37 |
| Star | A1 | Mv | Temp | [Fe/H] (error) | ||
|---|---|---|---|---|---|---|
| V1 | 1.54 | 5.73 | 0.3970 | 0.79 | 6484 | -1.55 (0.05) |
| V10 | 1.81 | 6.09 | 0.3154 | 0.79 | 6408 | -1.45 (0.03) |
| V14 | 2.14 | 6.62 | 0.3035 | 0.74 | 6335 | -1.37 (0.05) |
| V15 | 1.60 | 5.83 | 0.3709 | 0.80 | 6464 | -1.52 (0.06) |
| V18 | 1.67 | 5.85 | 0.3791 | 0.82 | 6514 | -1.35 (0.05) |
| V34 | 1.91 | 6.03 | 0.3606 | 0.79 | 6486 | -1.26 (0.04) |
| V35 | 1.63 | 5.91 | 0.4271 | 0.77 | 6492 | -1.48 (0.06) |
| V51 | 1.98 | 6.35 | 0.2856 | 0.80 | 6397 | -1.30 (0.03) |
| V52 | 1.58 | 5.62 | 0.4415 | 0.78 | 6537 | -1.47 (0.07) |
| V59 | 1.99 | 6.31 | 0.3015 | 0.79 | 6403 | -1.31 (0.04) |
| V63 | 1.79 | 6.12 | 0.3195 | 0.79 | 6399 | -1.48 (0.08) |
| V65 | 2.18 | 6.74 | 0.3243 | 0.69 | 6287 | -1.49 (0.04) |
| V66 | 2.08 | 6.63 | 0.2390 | 0.79 | 6317 | -1.36 (0.04) |
| V69 | 1.90 | 6.26 | 0.3041 | 0.81 | 6419 | -1.32 (0.03) |
| V74 | 1.57 | 5.81 | 0.4278 | 0.82 | 6552 | -1.36 (0.06) |
| V90 | 1.65 | 5.80 | 0.3847 | 0.81 | 6513 | -1.38 (0.05) |
| V104 | 1.69 | 5.89 | 0.4241 | 0.72 | 6438 | -1.62 (0.06) |
| V11 | 1.57 | 5.68 | 0.4402 | 0.79 | 6542 | -1.44 (0.05) |
| V84 | 2.09 | 6.53 | 0.2543 | 0.81 | 6389 | -1.22 (0.03) |