New Constraints on Simultaneous Optical Emission
From GRBs Measured by the LOTIS Experiment
Abstract
LOTIS is a gamma-ray burst optical counterpart search experiment located near Lawrence Livermore National Laboratory in California. Since operations began in October 1996, LOTIS has responded to five triggers as of July 30, 1997, which occurred during good weather conditions.
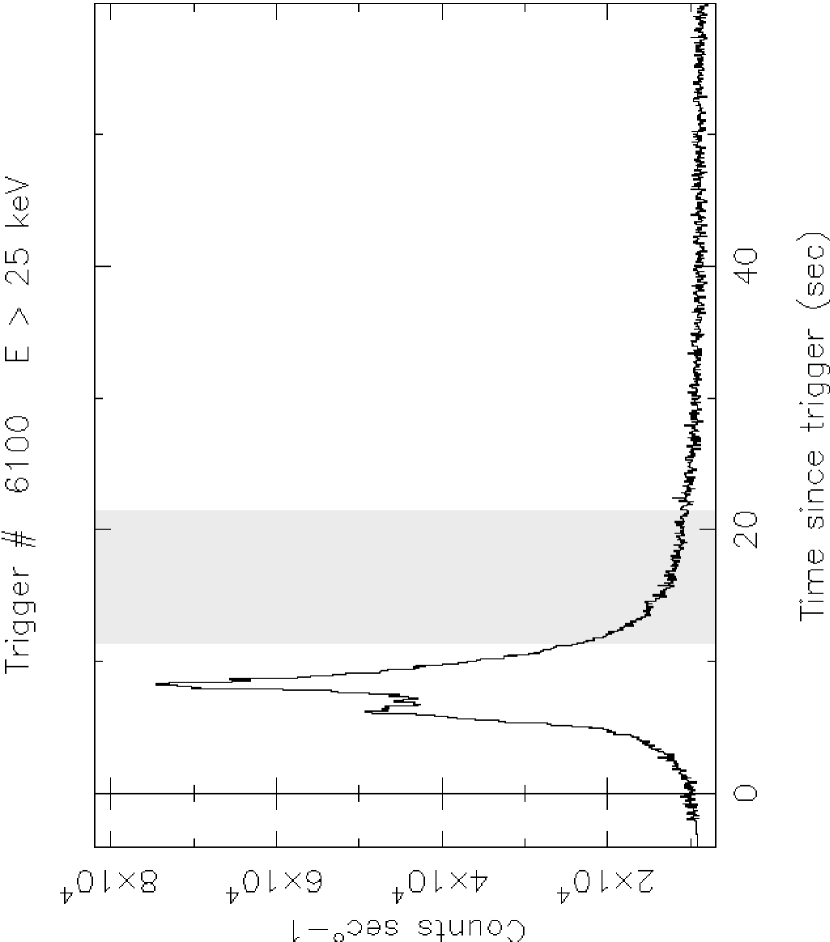
GRB970223 (BATSE Trigger #6100) was an exceptionally strong burst lasting s with a peak at s. LOTIS began imaging the error box s after the burst began, and achieved simultaneous optical coverage of 100% of the region enclosed by the BATSE error circle and the IPN annulus. No optical transients were observed brighter than the m completeness limit of the resulting images providing a new upper limit on the simultaneous optical to gamma-ray fluence ratio of and on the simultaneous optical (at 700 nm) to gamma-ray (at 100 keV) flux density ratio of for a B type spectrum and for an M type spectrum.
1 Introduction
Gamma-ray bursts (GRBs) are brief bursts of high-energy radiation that appear at random positions in the sky. The origin and nature of GRBs remain unresolved (Meegan et al. (1992)). Despite recent progress, much of the difficulty in studying GRBs results from their short duration ( s) and the poor directional precision ( statistical error) available from current orbiting GRB detection experiments (Fishman & Meegan (1995)).
BATSE (Burst and Transient Source Experiment) on-board the CGRO (Compton Gamma Ray Observatory) has provided continuous coverage of GRBs for the past 6 years. BATSE measures the time histories, spectra, and approximate locations of GRBs at a rate of roughly one per day. BATSE’s most significant observations are that the GRB locations are isotropic over the sky and that their brightness distribution is inhomogeneous. These measurements appear to rule out plausible theories of local GRB sources within the plane of our galaxy.
Recently the Italian-Dutch satellite BeppoSAX (Costa et al. 1997a , 1997b) has observed two GRBs with fading X-ray and optical counterparts (Costa et al. 1997c ; 1997d; Heise (1997); van Paradijs et al. (1997); Djorgovski et al. (1997)). These counterpart observations were made many hours after the GRBs and their association with the GRBs remains to be confirmed. While these observations provide information on the GRB distance scale (Metzger et al. (1997)) and their effect on the source enviroment, the observed afterglows may result from processes different from the prompt gamma-ray production mechanism (Katz (1997)). Thus, measurements of optical emission with the gamma-ray emission may provide crucial clues in understanding this process.
We initially adapted an existing wide field-of-view telescope at Lawrence Livermore National Laboratory (LLNL) to obtain rapid ( s) follow-up visual images of GRB error boxes utilizing the BATSE real-time coordinate distribution network as a trigger (BACODINE/GCN: Barthelmy et al. (1994)). This instrument, called GROCSE (Gamma Ray Optical Counterpart Search Experiment), did not find any evidence for optical activity brighter than m (Park et al. (1997)).
Subsequently, we constructed LOTIS (Livermore Optical Transient Imaging System), a second generation instrument with 250 times better sensitivity than the GROCSE. LOTIS has been operating since October 1996. Here we report on the results of LOTIS’s search for simultaneous optical activity associated with GRBs.
2 The LOTIS Experiment
LOTIS was constructed to respond rapidly to real-time GRB triggers provided by GCN (GRB Coordinates Network). The size of the BATSE error box, error of , requires wide field-of-view optics to obtain statistically significant coverage. LOTIS utilizes commercially available Canon f/1.8 telephoto lenses, which have short 200 mm focal lengths and effective apertures of 110 mm diameter. The electronic focal plane sensors are pixel Loral 442A CCDs with pixels driven by custom read-out electronics. The read-out clock rate is 500 kHz, which results in an image read-out time of 8 s. Each Canon telephoto lens/camera assembly has a field-of-view of with a pixel scale of 15 arcsec. Four cameras are arranged in a array to cover a total field-of-view of overlapping in each dimension.
Each of the four cameras has a dedicated SUN/Sparc 2 to control image acquisition. The four camera computers are connected to the system host computer, a SUN/Sparc 10, which runs the observing program, controls the telescope mount, opens and closes the weather protective clamshell housing, reads the weather station information, and communicates with GCN.
The on-line software is interrupt-driven and runs 24 hours per day. It exchanges “packets” (an Internet data exchange protocol) with GCN at a rate of one per minute to verify the connection between the sites. LOTIS starts the observations every night and systematically archives the entire night sky. These overlapping fields are saved to tape providing background images of future GRB sites. The entire observation program and hardware control is fully automated.
Approximately once every 20 days, we receive a “burst” packet from GCN containing preliminary GRB coordinates. The host computer moves the mount rapidly ( 5 s) to the burst coordinates and begins imaging the field for an observation period of 20 min. During this period approximately 60 images are recorded.
LOTIS is located at Site 300, LLNL’s remote test facility, 25 miles east of Livermore, California. Through July 1997 LOTIS has accumulated over 1300 hours of background images, and five GCN triggers were recorded under good weather conditions.
We report on one of these triggers, GRB970223 (BATSE Trigger #6100) which occurred on Feburuary 23, 1997 at 8:26:17.67 UTC. The high gamma-ray fluence of this event allowed GCN to distribute very accurate coordinates, resulting in good coverage of its error box.
3 Observation of GRB970223
GRB970223 had a total gamma-ray fluence of (20–2000 keV) ranking in the top 3% of all GRBs in intensity. The gamma-ray intensity peaked at 8 s after the start of the burst which lasted for 30 s (Figure 1). LOTIS received the GCN burst trigger at 8:26:23 UTC and began imaging at 8:26:29 UTC, 11 s after the burst began. At this time the burst was still in progress, making the observation truly simultaneous with the GRB. The shaded area in Figure 1 represents the 10 s integration time of the first exposure.
LOTIS imaged the field centered on the GCN coordinates (RA=, Dec=) (J2000.0). Later analysis by the BATSE collaboration provided coordinates RA= and Dec= with statistical () and systematic () errors. This position was from the GCN notice but still well within the LOTIS field-of-view enabling us to cover 100% of the BATSE error box. This event was also observed with the Ulysses spacecraft (Hurley et al. (1997)), allowing an IPN (Interplanetary Network) annulus to be constructed, and thus further constraining the search region for possible optical counterparts. Figure 2 shows the BATSE and IPN localizations.
4 Data Analysis
The basic data analysis strategy was to search for new star-like objects appearing within the GRB error box in the first LOTIS images. To determine the exact pointing direction of the LOTIS cameras during this event, we identified several objects in each image with stars in the GSC (Guide Star Catalog, Jenkner et al. (1990)) and calculated the elements of the rotation matrix which was used to convert the (x,y) pixel positions to celestial coordinates. Figure 2 shows the resulting distribution of the objects detected with LOTIS for this event. There are approximately 3300 star-like objects above our detection threshold in the full field-of-view. The BATSE error circle (including a systematic error of 1.6∘) and the IPN annulus are plotted as the ellipse and the narrow arc, respectively. Camera 3 has a deficiency of objects because it was slightly out of focus during this event. This did not significantly affect our sensitivity since nearly 100% of the error box is covered by the other three cameras.
We used two methods to search for optical transients in the first LOTIS images. First, for each object detected with LOTIS within the BATSE error box and the IPN annulus, we looked for corresponding objects in the GSC. We found that all of the star-like objects detected by LOTIS could be identified with a GSC object within 4 pixels (60 arcsec). In the second method, we subtracted the final images, taken 20 min after the start of the GRB, from the first images, taken 11 s after the start of the GRB and searched for new objects at least above the background level. This method would reveal faint transient objects present in the first image but not the last. We also examined similar difference images between the first images and images of the same field taken 28 days later. A few transient objects ( 10) were detected by this method and we carefully examined them. They were all either single hot pixels or grouping of disconnected single pixels which do not resemble the point spread function of our system, likely due to cosmic ray hits in the CCD. All star-like objects present in the first images were also present in the later images. From these analyses we conclude that no new star-like objects appeared in the first 11–21 s after the start of the GRB in the region of sky containing the GRB to the sensitivity limits of the LOTIS instrument.
We determined the sensitivity of the LOTIS images by examining a histogram of measured object brightness on a log-log scale. The measured brightness of each object was determined in the following way. First, the aperture photometry routines in the IDL astronomy package DAOPHOT (Stetson (1987)) were used to determine an instrumental brightness for each object. Then the average ratio of the GSC magnitude and the measured instrumental brightness for 20 hand selected stars was used to relate the instrumental brightness to visual magnitude for all objects in the image.
Figure 3 is the resulting magnitude histogram for the objects in the first image of cameras 1, 2 and 4. The peak in the histogram measures the completeness limit corresponding to the flux level above which the entire population of stars was observed (the LogN-LogS method). We find the complete magnitude for this event to be m.
5 Results
For comparison with models, we derive limits on the ratio of optical to gamma-ray fluence and optical to gamma-ray flux density from our null result.
Since the CCD measures the number of photoelectrons produced by the objects in the image, our limits are based on the minimum number of photoelectrons required for detection by our image processing algorithms. The number of photoelectrons, , produced by a star-like object of magnitude mV is
| (1) |
where is the telescope aperture, is the camera integration time, is the stellar spectral flux density in at m above the Earth’s atmosphere (Allen (1976)), is the atmospheric spectral transmission, is the telescope spectral transmission, and is the CCD quantum efficiency. To determine the minimum photoelectron threshold for detection, we used Equation 1 to calculate the absolute expected number of photoelectrons produced by the basic stellar spectral types over the range of magnitudes in Figure 3. We then counted the number of stars in each magnitude bin above a trial threshold assuming a distribution of stellar spectral types in each magnitude bin given by Hirshfeld & Sinnott (1982). This produced a histogram similar to Figure 3. We varied the trial photoelectron threshold until the calculated peak matched the measured peak in Figure 3. The stellar magnitude necessary to produce this best fit quantity of photoelectrons varied with stellar spectral type from m for B stars to m for M stars according to Equation 1.
For the first image, the shutter was open from 11 s to 21 s after the start of the burst. The upper limit to the GRB’s optical fluence during this time at the top of the atmosphere between 500 nm and 850 nm (where our sensitivity is of its peak value) is given by
| (2) |
which yields if the GRB had an optical spectrum of a B type star to if the GRB had an optical spectrum of an M type star.
To allow comparisons with models, we normalize this result to the total gamma-ray fluence from this event. The total GRB fluence during this time was calculated by fitting the burst spectrum to the “GRB” functional form (Band et al. (1993)), and then integrating the fit over the 20–2000 keV energy range. BATSE’s spectroscopy detectors (SDs), specifically SD4, SD6 and SD7, were used for the fits. The total GRB fluence for this event was . Using these optical and GRB fluences the upper limit of the ratio of the optical fluence during our observation to the total gamma-ray fluence is
| (3) |
for all postulated optical spectra of spectral type B through M.
Finally, since the GRB was still emitting gamma-rays when the LOTIS shutters were open, we can present simultaneous limits on the ratio of the optical flux at a particular wavelength to the gamma-ray flux at 100 keV, the peak of the gamma-ray spectrum. We choose 700 nm as the representative wavelength because it is at the peak of the spectral acceptance of our detector. The limiting optical flux density from LOTIS is for GRB optical spectra similar to B stars or for GRB optical spectra similar to M stars.
The GRB gamma-ray flux density at 100 keV was found by fitting the spectra from SD4 and SD6 during the LOTIS observation interval ( s). The resulting flux density at 100 keV is or .
The resulting flux ratio limit is
| (4) |
for GRB opitcal emission with a B type spectrum and
| (5) |
for GRB optical emission with an M type spectrum for this particular burst.
We conclude that any physical mechanisms for GRBs must not yield simultaneous optical components larger than these new upper limits. LOTIS continues to operate and we are now upgrading the cameras to enhance our sensitivity to m. Further constraining limits on simultaneous optical counterparts are expected.
References
- Allen (1976) Allen, C. W. 1976, Astrophysical Quantities (London: Athlone), 126
- Band et al. (1993) Band, D. L. et al. 1993, ApJ, 413, 281
- Barthelmy et al. (1994) Barthelmy, S. D. et al. 1994, in ”Gamma-Ray Bursts”, AIP Conference Proceedings, 307, ed. G. J. Fishman, J. J. Brainerd & K. Hurley (AIP: New York), 643
- (4) Costa, E. et al. 1997a, IAU Circ. 6572
- (5) Costa, E. et al. 1997b, IAU Circ. 6649
- (6) Costa, E. et al. 1997c, IAU Circ. 6576
- (7) Costa, E. et al. 1997d, Nature, 387, 783
- Djorgovski et al. (1997) Djorgovski, S. G. et al. 1997 Nature, 387, 876
- Fishman & Meegan (1995) Fishman, G. J., & Meegan, C. A. 1995, ARA&A, 44, 415
- Heise (1997) Heise, J. et al. 1997, IAU Circ. 6654
- Hirshfeld & Sinnott (1982) Hirshfeld, A. & Sinnott, R. W. 1982, Sky Catalogue 2000.0 (Cambridge: Sky Pub. & Cambridge U. Press)
- Hurley et al. (1997) Hurley K. et al. 1997, ”Gamma-Ray Bursts”, AIP Conference Proceedings, 384, ed. C. Kouveliotou, M. F. Briggs, G. J. Fishman (AIP: New York), 427
- Jenkner et al. (1990) Jenkner, H., et al. 1990, ApJ, 99, 2082
- Katz (1997) Katz, J. I. & Piran, T. 1997, ApJ, in press
- Meegan et al. (1992) Meegan, C.A., et al. 1992, Nature, 355, 143
- Metzger et al. (1997) Metzger, M. R. et al. 1997 Nature, 387, 879
- Park et al. (1997) Park, H. S. et al. 1997, ApJ, in press
- Stetson (1987) Stetson, P. B. 1987, PASP, 99, 191
- van Paradijs et al. (1997) van Paradijs, J. et al. 1997, Nature, 386, 686