Observations of the Hubble Deep Field with the Infrared Space Observatory V: Spectral Energy Distributions, Starburst Models and Star Formation History
Abstract
We have modelled the spectral energy distributions of the 13 HDF galaxies reliably detected by ISO. For 2 galaxies the emission detected by ISO is consistent with being starlight or the infrared ’cirrus’ in the galaxies. For the remaining 11 galaxies there is a clear mid-infrared excess, which we interpret as emission from dust associated with a strong starburst. 10 of these galaxies are spirals or interacting pairs, while the remaining one is an elliptical with a prominent nucleus and broad emission lines.
We give a new discussion of how the star formation rate can be deduced from the far infrared luminosity and derive star formation rates for these galaxies of 8-1000 per yr, where takes account of the uncertainty in the initial mass function. The HDF galaxies detected by ISO are clearly forming stars at a prodigious rate compared with nearby normal galaxies. We discuss the implications of our detections for the history of star and heavy element formation in the universe. Although uncertainties in the calibration, reliability of source detection, associations, and starburst models remain, it is clear that dust plays an important role in star formation out to redshift 1 at least.
keywords:
infrared: galaxies - galaxies: evolution - star:formation - galaxies: starburst - cosmology: observations1 Introduction
Because of its great depth, high resolution, and the intensive follow-up which has been carried out in it, the Hubble Deep Field (HDF) is an exceptional resource for cosmological studies. The central area of the HDF consists of 5 square arcmin of sky. It was imaged by the Hubble Space Telescope on 150 orbits in December 1995 and reaches to at least 29th magnitude in I (800nm), V (600nm) and B (450nm), and to 27th magnitude in U (300nm) (Williams et al 1996). We were successful in bidding for Director’s Time on the Infrared Space Observatory (ISO) and were awarded a total of 12.5 hours to map the HDF with ISO-CAM in the LW2 (6.7 m) and LW3 (15 m) filters. The observations were carried out in July 1996 and have been described by Serjeant et al (1997). The images have been searched for point sources by Goldschmidt et al (1997): a total of 15 sources were found in the central HDF area at 6.7 m, and 5 at 15 m, of which 6 and 4, respectively, are from complete and reliable sub-samples. A further 27 sources were found in the flanking fields around the HDF. The resulting source-counts have been discussed by Oliver et al (1997) and shown to be consistent with the strongly evolving starburst models previously used to model the 60 m and 1.4 GHz counts (Franceschini et al 1994, Rowan-Robinson et al 1993, Pearson and Rowan-Robinson 1996). Associations for the 17 ISO sources in the central HDF area (2 were detected at both 6.7 and 15 m) were sought with HDF galaxies using a likelihood method (Mann et al 1997) and 13 credible associations were found. In this paper we take the view that these associations tentatively confirm the reality of those sources which are not in the reliable and complete sub-samples. There is ambiguity about some of the associations (Mann et al 1997) and in some case the ISO flux may be due to more than one galaxy (this is particlularly so for the 15 m detections). In this paper we have assumed that all the flux is assigned to the galaxy with the highest likelihood. This assumption does not have a great effect on our overall conclusions. For the two sources where the likelihoods did not completely resolve ambiguities (12 36 43.0 +62 11 52 and 12 36 48.4 +62 12 15), we have conservatively chosen the lower redshift galaxy as the association.
In this paper we discuss the spectral energy distribution of the 13 galaxies detected by ISO in the central HDF area and consider the implications for star formation rates and the overall history of star formation in the universe. Details of the 13 galaxies are given in Table 1.
A striking feature of the fainter HDF galaxies is their blue colours, indicative of high redshift galaxies undergoing bursts of star formation. This is confirmed both by systematic analyses of the colours of the HDF galaxies (Mobasher et al 1996) and by studies of the morphologies of the galaxies (Abraham et al 1996), which show a high proportion of interacting and merging systems. In both respects the HDF galaxies look like a higher redshift version of the starburst galaxies found by IRAS. This was one of the strong motivations for seeking observing time with ISO. The fact that HDF galaxies have been detected by ISO is sufficient to demonstrate that this analogy with IRAS galaxies is highly relevant.
An Einstein de Sitter model ( = 1), with a Hubble constant = 50 km/s/Mpc, has been used throughout the paper.
2 Spectral Energy Distributions
For the 13 galaxies reliably detected by ISO in the HDF (Goldschmidt et al 1997, Mann et al 1997) we have modelled their spectral energy distributions (seds) from 0.3 to 15 m. Spectroscopic redshifts are available for 9 of the galaxies (Cowie 1996, Cohen et al 1996, Phillips et al 1997). For the remaining 4 we have used photometric redshifts determined by the method of Mobasher et al (1996). The latter analysis has been repeated using the total magnitudes and colours given in the STScI HDF catalogue (Williams et al 1996). The resulting redshifts agree well with those determined in a small, fixed aperture by Mobasher et al (1996).
The U,B,V,I data (AB magnitudes) from HST and the J, H/K data of Cowie (1996) have been fitted with galaxy models from the library of Bruzual and Charlot (1993). The near infrared data were corrected to the same aperture as the optical data. For wavelengths beyond 2.5 m, the Bruzual and Charlot models give predictions based on IRAS data for their standard stars, which appear to generate a spurious secondary peak at 12 m (even for the youngest starburst models). We have therefore replaced the Bruzual and Charlot predictions with a Rayleigh-Jeans extrapolation beyond 2.5 m. Excellent fits to the U to K data for our galaxies can be obtained using models with starburst of duration yrs, viewed at a range of subsequent times = 1 to 2.4 Gyr (values of are given in Table 1). In the case of the galaxies for which we have only photometric redshifts, the good fits of the models to the data provide support for the photometric redshifts. Almost equally good fits could be obtained with an exponentially decreasing star formation rate with a time-scale of 1 Gyr. No allowance is made for reddening at this stage. For one galaxy (12 36 43.9 +62 11 30), the 6.7 m emission can be accounted for almost completely by starlight.
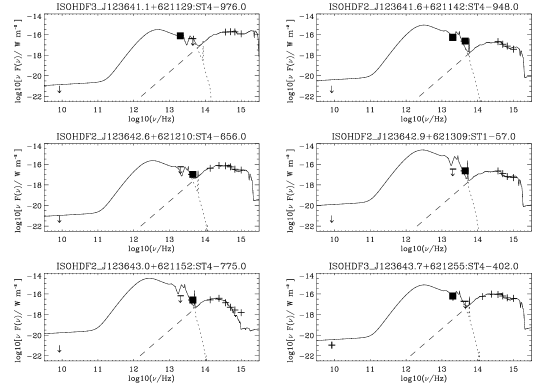
For the remaining 12 galaxies, there is a clear excess of infrared radiation. We have considered first the possibility that we are seeing the infrared ’cirrus’ in the galaxies, emission from starlight in the galaxies absorbed by interstellar grains and reemitted in the infrared. The cirrus models of Rowan-Robinson (1992) have been revised to incorporate very small grains and PAHs correctly (Efstathiou, Rowan-Robinson and Siebenmorgen 1997, in preparation). For 12 of the galaxies, there was no plausible cirrus model, because the resulting far infrared luminosity was always at least 3 times the total optical-uv luminosity of the galaxy. A typical value of for cirrus emission is 0.2-0.3 (Rowan-Robinson et al 1987, Rowan-Robinson 1992). For one galaxy (12 36 48.1 +62 14 32), in which the cirrus model gave a far infrared luminosity comparable to that seen in the optical and uv, we accepted the cirrus model fit (see Fig 1).
Figure 1 shows fits of the standard starburst model of Efstathiou et al (1997) to the infrared spectral energy distributions of the remaining 11 ISO-detected HDF galaxies. The model is a development of the earlier starburst model of Rowan-Robinson and Efstathiou (1993), with a proper treatment of very small grains and PAHs, and gives an excellent fit to the spectra of M82 and the starburst galaxy NGC6090 studied by ISO (Acosta-Pulido et al 1996). Although in most cases we have only a single mid-infrared data point, it is satisfactory that in the case where we have detections at both 6.7 and 15 m , the model fits both data points well. Where only upper limits are available at one of the ISO wavelengths, these are generally consistent with the predictions of the model (for objects 4 and 5 in Table 1, the upper limits at 15 m may imply that the model parameters need adjustment, that an alternative model, eg a dusty AGN torus, may be needed, or that the 6.7 m detections is unreliable). Even more impressive is the fit for 3 galaxies to the VLA detections by Fomalont et al (1996), for which we have assumed in the model the standard radio-far ir correlation ( S(60 m)/S(1.4 GHz) = 90 ) and a radio spectral index of 0.8. This supports the idea that we really are seeing dust emission from starbursts with ISO. In most other cases the models are consistent with the 1.4 GHz upper limit, taken as 12.2 Jy (Fomalont et al 1997) ( but for objects 4, 5 and 10, the radio limits lie significantly below the predictions of the starburst model). If we look at the morphologies of the galaxies in our sample, the 2 non-starburst galaxies are both ellipticals. Of the 11 galaxies whose seds we fit as starbursts, 8 are spirals, 2 are interacting pairs and 1 is a galaxy (possibly spiral) with a prominent nucleus (12 36 46.4 +62 14 06). Broad lines have been found in the optical spectrum of this galaxy and it is possible that the 6.7 mu emission could be from a dusty torus surrounding the AGN, rather than from a starburst. However if this interpretation were correct, the agreement of the radio flux with the prediction of the starburst model would be a coincidence. There are several other objects in which a dusty torus model would give an equally satisfactory fit to the observed infrared excess. However since the covering factor by dust in AGN is generally found to be (Rowan-Robinson 1995), it is unlikely that more than one object in our sample is AGN with its dust torus seen edge-on. The source-count models discussed by Oliver et al (1997) predict that the fraction of AGN expected in 6.7 and 15 m samples should be small. We therefore assume that the infrared excess in the remaining 11 objects is from starbursts rather than from AGN with dusty tori.
Table 1 gives the inferred rest-frame values of at 0.3, 0.8, 15 and 60 m. It can be seen that ranges from 2 to 200, and ranges from 3 to 1000. Thus the implication of the ISO detections is that, at least for the detected galaxies, the bulk of the bolometric luminosity of the galaxies is emitted at far infrared wavelengths. The interpretation of this is similar to that for the starburst galaxies found in IRAS surveys: most massive star formation takes place in dense molecular clouds and is shrouded from view by a substantial optical depth in dust. What is seen in the optical and uv represents stars formed near the edges of clouds, so that the light from these stars can escape directly.
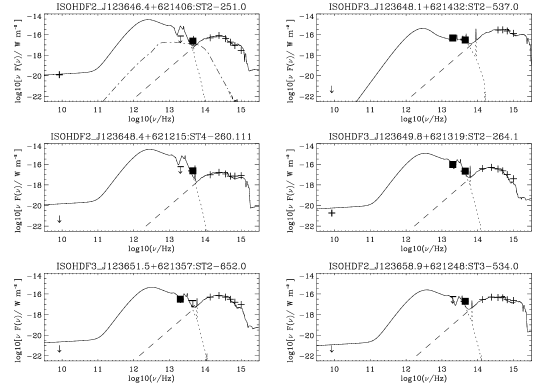
(b) Caption as for Fig 1a.
| Galaxy | redshift | notes | |||||||
| (ISOHDF) | (Gyr) | x | |||||||
| 1 | 12 36 41.1 +62 11 29 | (0.047) | 1.02 | 2.8x | 4.0x | 2.1x | 7.6x | 0.20 | S sb c |
| 2 | 12 36 41.6 +62 11 42 | 0.585 | 1.14 | 2.8x | 7.3x | 1.1x | 3.9x | 101 | I sb b,d |
| 3 | 12 36 42.6 +62 12 10 | 0.454 | 1.14 | 6.9x | 1.8x | 1.7x | 6.0x | 16 | S sb b |
| 4 | 12 36 42.9 +62 13 09 | (0.74) | 1.14 | 5.5x | 1.4x | 5.3x | 1.9x | 495 | S sb b |
| 5 | 12 36 43.0 +62 11 52 | (0.82) | 2.4 | 3.4x | 3.0x | 8.9x | 3.2x | 840 | S sb a |
| 6 | 12 36 43.7 +62 12 55 | 0.558 | 1.14 | 1.4x | 3.6x | 8.6x | 3.1x | 80 | I sb c,e |
| 7 | 12 36 43.9 +62 11 30 | 1.01 | 3.5 | 1.75x | 1.35x | 2.0x | 1.4x | - | E sl b,e |
| 8 | 12 36 46.4 +62 14 06 | 0.960 | 1.28 | 2.2x | 8.1x | 1.1x | 3.9x | 1010 | E sb a,e |
| 9 | 12 36 48.1 +62 14 32 | (0.023) | 1.14 | 6.0x | 1.5x | 1.8x | 1.26x | - | E cirr a,c |
| 10 | 12 36 48.4 +62 12 15 | (0.778) | 1.02 | 4.5x | 1.15x | 6.8x | 2.45x | 640 | S sb a |
| 11 | 12 36 49.7 +62 13 15 | 0.475 | 1.28 | 1.75x | 1.26x | 9.5x | 3.4x | 88 | S sb a,c,e |
| 12 | 12 36 51.5 +62 13 57 | 0.557 | 1.14 | 4.7x | 2.7x | 5.2x | 1.86x | 48 | S sb d |
| 13 | 12 36 58.9 +62 12 48 | 0.320 | 1.02 | 2.4x | 6.0x | 9.0x | 3.2x | 8 | S sb b |
S - spiral
E - elliptical
I - interacting pair
sb - sed fitted with starburst model
cirr - sed fitted with cirrus model
sl - sed fitted with starlight
a - detected at 6.7 m, from reliable and complete sub-sample
b - detected at 6.7 m, from supplementary list
c - detected at 15 m, from reliable and complete sub-sample
d - detected at 15 m, from supplementary list
e - detected at 1.4 GHz (Fomalont et al 1997)
3 Star formation rate
A number of authors have discussed how the star formation rate in a galaxy can be inferred from its optical, ultraviolet or far infrared luminosity. Scoville and Young (1983) estimated the star formation rate of O,B,A stars () from the total far infrared luminosity of galaxies, implicitly assuming a burst of star formation lasts yrs, finding
= 7.7x . (1)
Thronson and Telesco (1986) used a Salpeter IMF to give rates of star formation of all stars and of OBA stars, averaged over the past 2x yrs, per unit far infrared luminosity:
= 2.1x . (2)
= 6.5x . (3)
They attribute the fact that (2) is a factor of 3 higher than (1) to the different assumptions about the duration of the burst. They also give the scaling factors for the star formation rate between the different IMFs and lower mass limits:
M/L (Miller-Scalo, 100, 0.1) : M/L (M-S, 100, 1.6) : M/L (Salpeter, 100, 0.1): M/L (Salpeter, 100, 1.6)
= 10.2 : 4.0 : 3.1 : 1
More recently Madau et al (1996) have calculated total star formation rates and heavy element production, , from the ultraviolet luminosity densities at 2800 , using a Salpeter IMF and the evolutionary models of Bruzual and Charlot (1993). The figures they give are equivalent to
= 5.3x . (4)
= 42 (5)
To convert from 60 m luminosity to star formation rate, we assume that a fraction ( 1) of the optical and uv energy emitted in a starburst is absorbed by dust and emitted in the far infrared, so that
= . (6)
The bolometric correction at 2800 for the 1 Gyr starburst models of Bruzual and Charlot (1993), when viewed at early ages, is 3.5 and those at 15 and 60 m for the dusty starburst model of Rowan-Robinson and Efstathiou (1993) are 6.0 and 1.7, respectively, so using (4) and (6):
= 2.6 x (7)
= 9.3 x
where the factor incorporates (1) the correction from a Salpeter IMF to the true IMF (x3.3 if the Miller-Scalo IMF is the correct one), (2) a correction if the starburst event is forming only massive stars (x 1/3.1 if only O,B,A stars, , are being formed). This estimate, which is now based on detailed starburst models for the optical-uv radiation and proper radiative transfer models for the far infrared emission, is a factor 1.9 higher than that of Scoville and Young (1983, eqn (1) above) and a factor 0.7 times that of Thronson and Telesco (1986, eqn (2) and (3) above).
4 Star formation rates for ISO-HDF galaxies
Table 1 gives the inferred 15 and 60 m luminosities, and star formation rates based on eqn (7), for the 11 HDF starburst galaxies detected by ISO. The star formation rates range (with one exception) from 8-1000 per yr. The galaxies detected by ISO are forming stars at a prodigous rate compared with nearby normal spirals. Although star formation rates based only on 6.7 and 15 m detections are bound to be rather uncertain, because most of the energy is emitted at much longer wavelengths, it is clear that the star formation rates deduced from the uv fluxes detected by HST are a severe underestimate for these galaxies.
It is of course of interest to ask whether these star formation rates can be typical of all the galaxies in the HDF. For 2 of the galaxies detected by ISO, the 6.7 and/or 15 m flux is consistent with emission from starlight and/or cirrus and there is no evidence for a luminous starburst. For other bright galaxies in the HDF, the non-detection by ISO gives a significant upper limit on any excess far infrared emission. For these galaxies the estimates of star formation rate from the uv flux will be correct. However we can not rule out the possibility that for a significant fraction of the fainter HDF galaxies, particularly those with , the presence of a strong far infrared excess is the norm rather than the exception. When we see star formation within our Galaxy or in other nearby galaxies, the bulk of the massive stars (which produce all the heavy elements and most of the ultraviolet light) are formed within dense molecular clouds behind a high optical depth in dust. The starburst galaxies detected by IRAS emit most of their radiation at far infrared wavelengths. It is a reasonable expectation that as we look back to epochs when the bulk of the stars in a galaxy are formed, that this too will take place within dense clouds of molecules and dust and be primarily a far infrared phenomenon. Of course eventually we will see back to epochs when the very first stars form, when little or no heavy elements or dust are present, and star formation will be entirely an optical and uv phenomenon. However this transparent phase may last no more than a few percent of the main star formation phase, say yrs, and be confined to very high redshifts ( ).
5 Infrared luminosity-density and the history of star formation
Madau et al (1996) have used the Canada-France Redshift Survey (Lilly et al 1996) and HDF data to calculate the history of star formation and heavy element generation, under the assumption that the uv gives a complete view of the star formation that is occurring. Integrating over the star formation density as a function of redshift, they conclude that all the heavy elements associated with the visible matter in galaxies can be generated. However if their calculated baryonic density is converted to a value for , a value of 0.0035 is obtained, only 7 of the baryonic density of 0.05, for an assumed = 50, derived from cosmological nucleosynthesis of the light elements (Walker et al 1991). It is not unreasonable to assume that some of the remaining 93 or baryons has participated in star formation and heavy element production. For example, the hot gas in clusters is known to have a heavy element abundance of at least 1/3rd of solar.
We first estimate the far infrared luminosity density for the luminosity function derived from IRAS 60 m data. Oliver et al (1997) have shown that the 6.7 and 15 m source-counts are consistent with the strongly (luminosity-)evolving starburst models which we have used to fit (1) the redshift distribution in IRAS redshift surveys (Saunders et al 1990, Oliver et al 1995), (2) the 60 m source-counts (Pearson and Rowan-Robinson 1996), (3) the far infrared background, including the claimed detection using FIRAS data from COBE by Puget et al (1996) (Pearson and Rown-Robinson 1996, Rowan-Robinson and Pearson 1996), (4) the sub-mJy 1.4 GHz radio counts (Rowan-Robinson et al 1993, Hopkins et al 1996).
The solid curve in Fig 2 shows the luminosity-density at 60 m as a function of redshift. For this is directly derived from IRAS galaxy redshift surveys (the luminosity function given in line (23) of Table 3 of Saunders et al 1990). The extrapolation to higher redshift is the luminosity evolution model used in Pearson and Rowan-Robinson (1996), Rowan-Robinson et al (1993), and Oliver et al (1997) to fit the deep 60 m and 1.4 GHz source-counts, for which
= , (8)
= .
Using eqn (7) we can convert this to a density of star formation, and integrate to derive a total mass-density in stars or in heavy elements. We find
= 0.008 , =0.00019 . (9)
These values are not unreasonable. They require that twice as much star formation as has been inferred by Madau et al (1996) from the uv integrated light has taken place shrouded by dust. The total fraction of baryonic matter that has participated in star formation would be of order 20 , with about 1/3rd of the resulting heavy elements now residing in the luminous parts of galaxies. The remainder could be in baryonic objects in the halos of galaxies or in intergalactic gas (including the hot X-ray emitting gas in clusters). In fact evolutionary rates appreciably steeper than that assumed in eqn (8) can probably not be ruled out at this stage. If the star-forming galaxies we have detected with ISO are typical of the fainter HDF galaxies, then we may require that more than 50 of baryons have participated in star-formation and heavy element production, presumably with a truncated IMF so that most of the baryons now reside in dark remnants. Similar conclusions are reached if we use the model for evolution of infrared galaxies of Franceschini et al (1994, 1997 in preparation), shown as a broken line in Fig 2.
We have also estimated the contribution to the 60 m luminosity-density implied directly by the ISO-HDF starburst galaxies. There are 5 starburst galaxies in the redshift bin 0.4-0.7 and 3 in the redshift bin 0.7-1.0 (omitted the galaxy with broad lines). Estimating the volume of the universe sampled by the HDF survey we find contributions of 6.0 2.0x and 2.6 1.5x for the redshift ranges 0.4-0.7 and 0.7-1.0 respectively. These estimates take no account of sources fainter than the ISO limit and they are subject to any uncertainty in the ISO calibration (probably a factor of 50either way), as well as the considerable uncertainty associated with extrapolating from 6.7 and 15 m to 60 m, so must be seen as very preliminary. They appear to be significantly higher than the predictions for evolution of the form (8) (the solid line in Fig 3) by factors of 5 and 10 respectively. This may imply that the evolution of starburst galaxies is steeper than assumed in eqn (8) for 0 z 1. Alternatively our models may overestimate the 60 m luminosities for at least some of the galaxies, for example because the 6.7 and 15 m radiation comes from dust tori around AGN.
We have also shown in Fig 2 one of the more extreme of the models of Pei and Fall (1995, dotted line). This illustrates that the luminosity density estimated from the ISO-HDF galaxies is not at odds with current data on the number-density of quasar absorption-line clouds or the observed heavy element abundance at high redshift. However for this model , , which would probably imply that only higher mass stars were being formed in the ISO-HDF galaxies.
Support for the idea that stronger evolution than (8) is required for the starburst galaxy population comes from the fit to the ISO counts by Oliver et al (1997). The Pearson and Rowan-Robinson (1996) model fails to predict a strong enough contribution to the counts by starburst galaxies. The Franceschini et al (1994) model, involving a strongly evolving starburst population in elliptical galaxies, appears to give a better fit to the ISO counts. This idea can be tested by the deep 90 m surveys which we and others are carrying out with ISO. It will also be interesting to observe the HDF galaxies detected by ISO at submillimetre wavelengths, for example with SCUBA on the JCMT.

6 Conclusions
We have modelled the spectral energy distributions of the 13 galaxies reliably associated with ISO sources detected at 6.7 andor 15 m. For 2 galaxies the emission detected by ISO is consistent with being starlight or normal infrared ’cirrus’ in the galaxies. For the remaining 11 galaxies there is a strong mid-infrared excess, which we interpret as emission from dust associated with a strong starburst. In 3 cases the starburst model appears to be confirmed by the good agreement of the the predicted radio flux with that detected by Fomalont et al (1996). Inferred rest-frame luminosities () at 0.3, 0.8, 15 and 60 m are given and ranges from 3 to 1000 for the 11 galaxies. Thus most of the the bolometric luminosity of the galaxies is predicted to emerge at far infrared wavelengths.
We give a new discussion of how the star formation rate can be deduced from the far infrared luminosity and derive star formation rates of 8-1000 per yr, where takes account of the uncertainty in the initial mass function (=1 for Salpeter IMF). The HDF galaxies detected by ISO are clearly forming stars at a prodigous rate compared with nearby normal galaxies. We discuss the implications of our detections, and of the IRAS 60 m luminosity function and evolution, for the history of star and heavy element formation in the universe. We conclude that at least 20 of baryons must have participated in star formation.
Acknowledgements
This paper is based on observations with ISO, an ESA project, with instruments funded by ESA Member States (especially the PI countries: France, Germany, the Netherlands and the United Kingdom) and with the participation of ISAS and NASA. We thank the referee, Harry Fergurson, for comments and suggestions which enabled us to improve this paper. This work was supported by PPARC (Grant no. GR/K97828) and by the EC TMR Network Programme (Contract no. FMRX-CT96-0068).
References
- [1] Abraham R.G., Tanvir N.R., Santiago B.X., Ellis R.S., Glazebrook K., and van den Bergh S., 1996, MN 279, L47
- [2] Acosta-Pulido, J.A., et al., 1996, AA 315, L121
- [3] Bruzual A.G., and Charlot, S., 1993, ApJ 405, 538
- [4] Cohen, J.G., Cowie, L.L., Hogg, D.W., Songaila, A., Blandford, R., Hu, E.M., Shopbell, P., 1996, ApJ 471, L5
- [5] Cowie, L.L., 1996, http:/www.ifa.hawaii.edu/cowie /hdf.html
- [6] Fomalont, E.B., Kellermann, K.I., Richards, E.B., Windhorst, R., Partridge, R.B., 1997, ApJ 475, L5
- [7] Franceschini A., Mazzei, P., de Zotti, G., Danese, L., 1994, ApJ 427, 140
- [8] Goldschmidt P. et al., 1997, MN
- [9] Hopkins, A., Mobasher, B., Cram, L., Rowan-Robinson, M., 1997, MN in press
- [10] Lilly, S.J., Le Fevre, O., Hammer, F., Crampton, D., 1996, ApJ 460, L1
- [11] Madau, P., Ferguson, H.C., Dickinson, M.E., Giavalisco, M., Steidel, C.C., Fruchter, A., 1996, MNRAS 283, 1388
- [12] Mann, R.G. et al., 1997, MN
- [13] Mobasher, B., Rowan-Robinson, M., Georgakakis, A., Eaton, N., 1996, MN 282, L7
- [14] Oliver, S., et al., 1995, in ’Wide-Field Spectroscopy and the Distant Universe’, eds. S.J.Maddox and A.Arogon-Salamanca (World Scientific) p.274
- [15] Oliver, S. et al., 1997, MN
- [16] Pearson, C., Rowan-Robinson, M., 1996, MN 283, 174
- [17] Pei, Y.C., and Fall, S.M., 1995, ApJ 454, 69
- [18] Phillips, A.C., Guzman, R., Gallego, J., Koo, D.C., Lowenthal, J.D., Vogt, N.P., Faber S.M., Illingworth, G.D., 1997, ApJ (in press)
- [19] Puget, J.-L., Abergal A., Bernard J.-P., Boulanger F., Burton W.B., Desert F.-X., Hartmann D., 1966, AA 308, 5
- [20] Rowan-Robinson, M., Helou, G., Walker, D., 1987, MN 227, 589
- [21] Rowan-Robinson, M., 1992, MN 258, 787
- [22] Rowan-Robinson M., 1995, MNRAS 272, 737
- [23] Rowan-Robinson, M., Efstathiou, A., 1993, MN 263, 675
- [24] Rowan-Robinson, M., Pearson, C., 1996, in ’Unveiling the Infrared Background’, ed. E.Dwek (American Inst. of Physics) p.192
- [25] Rowan-Robinson M., Benn C.R., Lawrence A., McMahon R.G., Broadhurst T.J., 1993, MNRAS 263, 123
- [26] Saunders, W., Rowan-Robinson, M., Lawrence, A., Efstathiou, G., Kaiser, N., Frenk, C.S., 1990, MN 242, 318
- [27] Scoville, N.Z., Young, J.S., 1983, Ap.J 265, 148
- [28] Serjeant, S. el al., 1997, MN
- [29] Thronson, H., Telesco, C., 1986, Ap.J 311, 98
- [30] Walker, T.P., Steigman, G., Schramm, D.N., Olive, K.A., Kang, H.-S., 1991, ApJ 376, 51
- [31] Williams, R.E., et al., 1996, AJ 112, 1335