Hot Evolved Stars in the Centers of M 31 and M 32
Abstract
We present UV images of M 31 and M 32, as observed by HST with the refurbished FOC. The galaxies were observed through the F175W and F275W filters, allowing the construction of color magnitude diagrams (CMDs) for the hundreds of detected sources found in each image. Comparison of these data with the stellar evolutionary tracks of horizontal branch stars and their progeny shows that for the first time outside of our own Galaxy, we may be measuring the colors of individual stars that are evolving along post asymptotic giant branch (PAGB), post-early AGB, and AGB-Manqu paths. Searching to the 6 detection limit, we find 1349 stars in M 31 and 183 stars in M 32. We compare the distribution of stars in the CMDs with the expectations from theory.
Motivation
The spectra of elliptical and spiral galaxy bulges exhibit a strong upturn shortward of 2700 Å, dubbed the “UV upturn.” Characterized by the color, the UV upturn shows strong variation (ranging from 2.05–4.50 mag) in nearby quiescent galaxies. The UV upturn is thought to vary with the composition of an evolved stellar population, because the lifetimes of stars leaving the horizontal branch vary by orders of magnitude. Stars that evolve along the asymptotic giant branch (AGB) and post-AGB evolutionary paths are short-lived in comparison to the AGB-Manqu stars that spend 107 yr at high luminosity (100 L⊙) and high temperature (TK). The longer-lived stars are more efficient UV emitters, and thus it is thought that they comprise a greater proportion of the populations with the stronger UV upturns (see Brown et al. 1997 for a reviewbrown97 ).
Many groups have tried to characterize the stellar populations in early-type galaxies by fitting their composite spectral energy distributions (SEDs) with the synthetic spectra of model stellar populations (cf. Brown et al. 1997brown97 ). However, the considerable ambiguity in this process has not determined unequivocally the populations producing the UV flux. Our goal in this work was to directly characterize these stellar populations through UV photometry of the individual stars in two galaxies: M 31 and M 32. To pursue this goal, we have taken deep exposures of these galaxies with the F175W and F275W filters on the Faint Object Camera (FOC). The resulting color-magnitude diagrams (CMDs) that can be constructed from this photometry can be compared to the predictions of stellar evolutionary theory.
Observations
The observations for this work are summarized in Table 1. Our photometry was performed with the IRAF package apphotx, which we used to find stars that were detected at 6 above the diffuse background. This search found 1349 sources in M 31 and 183 in M 32. We then simulated the data in order to determine our completeness limits and spurious source contamination. These simulations show that our detection capability drops below 50% for stars dimmer than 24th magnitude in each individual filter for a given galaxy. However, our actual detection capability is somewhat better than that estimated from these simulations, since we generate our source list by searching in both filters. Our magnitudes use the STMAG system; in Table 1 corresponds to 1 count/sec in the filter. We have constructed 3-color images of the galaxies (see Ferguson & Brown, this volume) using our own FOC data and archival WFPC2 data.
| M 31 | M 32 | |||
| R.A.2000 | ||||
| Dec.2000 | ||||
| (kpc) | 770 | 770 | ||
| (mag) | 0.11 | 0.11 | ||
| (mag) | 3.51 | 4.50 | ||
| F175 | F275 | F175 | F275 | |
| Exp. (sec) | 19773 | 8390 | 16179 | 8990 |
| PSF FWHM (pix) | 4.6 | 4.0 | 4.3 | 3.9 |
| 19.43 | 21.47 | 19.43 | 21.47 | |
Comparison with Theory
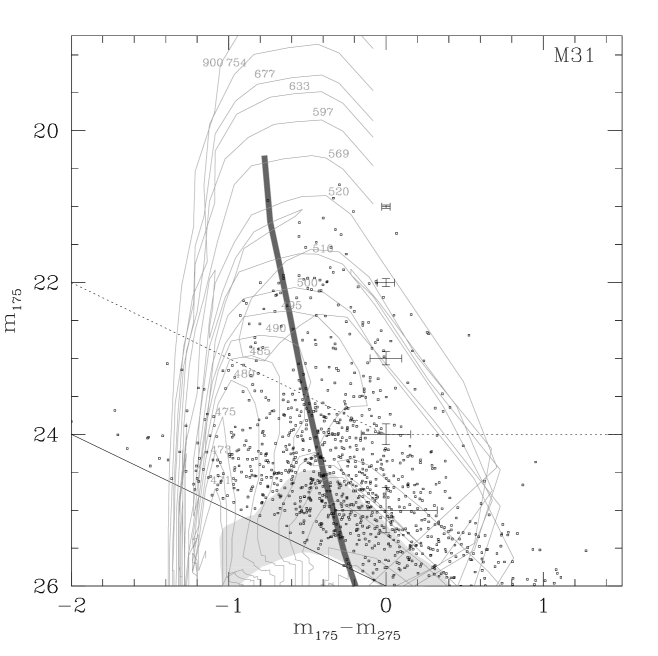
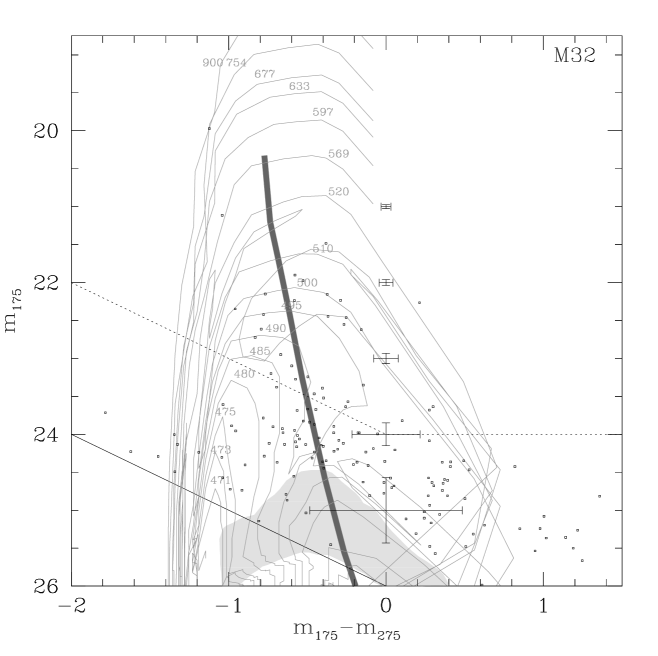
In Figs. 1 and 2, we have produced CMDs for these sources, and compared them with stellar evolutionary tracks for HB and post-HB stars. The evolutionary tracks were placed in the CMDs by finding the closest Kurucz (1993kurucz93 ) synthetic spectrum for each step along the track, normalizing it to agree with the distance and reddening for the galaxies (Table 1), and then folding it through the appropriate instrument response curves using the IRAF task calcphot. We have also performed Monte Carlo simulations of the CMD that would arise from a population of extreme horizontal branch (EHB) stars, chosen to reproduce the M 31 F175W countrate. In our simulations, this population is assumed to originate from a flat mass distribution on the blue end of the HB, i.e., the number of stars per unit mass is uniform across the EHB. Our simulations show that there should be a gap in the distribution of stars in each CMD (see Figs. 1 & 2). The gap is present because of the rapid evolution between two evolutionary phases: the core He burning on the HB, and the later shell He burning in the “slow blue phase.”
Although the exposure times on both galaxies are approximately equal, the M 31 luminosity function peaks at mag and mag, while the M 32 luminosity function peaks at mag and mag. This is in line with theories of the UV upturn, since one would expect brighter (and thus short-lived) stars in the galaxy with the weaker UV upturn.
Puzzles
Since the distribution of stars in our CMDs does not agree with the expectations from our simulations, we compared our data to that from other investigations, in order to investigate possible problems with our data. These investigations turned up a few more discrepancies:
The F175W countrate in both of our images is approximately 60% higher than that predicted from IUE observations (private communication Calzetti) of M 31 and M 32.
Comparison of common sources in our data and that of pre- COSTAR F175W data (King et al. 1992king92 ) shows our sources to be 1.1 mag fainter.
Comparison of common sources in our data and that of archival WFPC2 F300W data shows that the mean color for these sources is 0.23 mag, when it should be between 0.0 and -0.20 mag for hot UV sources at 10,000 K 50,000 K.
Because of these discrepancies, we cannot as yet characterize the stellar populations in M 31 and M 32. We are attempting checks of the data calibration and our own calculations. This work is still in progress.
References
- (1) Brown, T. M., Ferguson, H. C., Davidsen, A. F., & Dorman, B. 1997, ApJ, 482, 685.
- (2) Dorman, B., Rood, R. T., & O’Connell, R. W. 1993, ApJ, 419, 596.
- (3) Ferguson, H. C., & Davidsen, A. F. 1993, ApJ, 408, 92.
- (4) King, I. R., et al. 1992, ApJ, 397, L35.
- (5) Kurucz, R. L. 1993, CD-ROM 13, ATLAS9 Stellar Atmosphere Programs and 2 km/s Grid (Cambridge: Smithsonian Astrophys. Obs.).
- (6) Vassiliadis, E., & Wood, P. R. 1994, ApJS, 92, 125.