Soft X-ray lines and gas composition in NGC 1068
Abstract
Previous X-ray and ultraviolet spectroscopy suggested that the Fe/O abundance ratio in NGC 1068 may be abnormally high. We have tested this suggestion by measuring and modeling the ASCA spectrum of NGC 1068. We have measured some 15 X-ray lines, to an accuracy better than a factor 2, and modeled the continuum in two different ways. The first assumes that the hard X-ray continuum is the reflection of the nuclear source by two, extended, photoionized gas components; a warm (T K) gas and a hot (T K) gas. All the observed emission lines are produced in this gas and there is an additional, extended 0.6–3 keV pure continuum component. The model is similar to the one proposed by Marshall et al. (1993). The second model is a combination of a hard reflected continuum with a soft thermal plasma component. The calculations show that the emission lines in the photoionized gas model are in very good agreement with the observed ones assuming solar metallicity for all elements except for iron, which is more than twice solar, and oxygen, which is less than 0.25 solar. Models with solar oxygen are possible if the 0.5–1 keV continuum is weaker but they do not explain the magnesium and silicon lines. The thermal model fit requires extremely low metallicity (0.04 solar) for all elements. We discuss these findings and compare them with the ASCA spectra of recently observed starburst galaxies. We argue that the apparent low metallicity of starburst galaxies, as well as of the extended nuclear source in NGC 1068, are inconsistent with galaxy chemical evolution. The explanation for this apparent anomaly is still unknown and may involve non-thermal continuum mechanisms and, in some cases, depletion onto grains. Given the strong H-like and He-like lines, as well as the prominent Fe-L emission features, the origin of the soft X-ray lines in this source is more likely photoionized gas. We compare our model with the recent Iwasawa et al. (1997) paper. We also show that fluorescence lines of low-Z element lines in AGN is likely to be larger than previously assumed.
1 INTRODUCTION
NGC 1068 is perhaps the best studied Seyfert 2 galaxy, with X-ray observations by EXOSAT, GINGA, ROSAT, BBXRT and ASCA (for references and general description see Marshall et al.; 1993). The most striking X-ray feature is the strong (equivalent width, EW keV) K complex that is split into three components corresponding to “neutral” (6.4–6.5 keV), He-like (6.7 keV) and H-like (6.96 keV) iron lines. The large EW is probably the result of the obscured central continuum and the directly viewed line producing gas (Krolik & Kallman; 1988). This iron line complex was first resolved in BBXRT data (Marshall et al. 1993) and was later studied by Ueno et al. (1994) and Iwasawa, Fabian and Matt (1997).
Marshall et al. (1993) suggested a two component model to explain the X-ray emitting gas in NGC 1068. The first is a “warm” component with a typical temperature of 2 K, and the second a more highly ionized “hot” component, with T K. Both components are ionized by the central X-ray source and co-exist, with pressure equilibrium, throughout the nucleus. Both components reflect the optical-ultraviolet-X-ray continuum, and the broad Balmer lines, and are thus the “electron scattering mirror” in this source. That analysis showed that the iron abundance, as calculated from the EW of the 6.4 keV line, is high, 2–3 times solar. The absence of a detectable O viii line has been interpreted, within the framework of the model, as indication for a very small O/H. The implication is that the O/Fe abundance ratio is very small, an order of magnitude below solar. Ueno et al. (1994) measured a very weak O viii line and confirmed the BBXRT measurements of the K lines. These authors took a different approach and modeled the observed K lines, as well as several softer lines, by a thermal plasma. Their underlying assumption is that collisionally ionized gas is producing the observed emission lines. However, such models require abnormally low metallicity since the predicted soft X-ray lines are much stronger than those observed.
Marshall et al. have also noted the extreme weakness of the O iii] ultraviolet line in this galaxy and suggested that the oxygen abundance anomaly extends to the cooler gas, in the narrow line region (NLR). The ultraviolet spectrum has been investigated, in more detail, by Netzer (1997), reaching a similar conclusion about the O/C and O/N abundance ratio.
We have undertaken a more detailed study of the spectrum of NGC 1068, aiming at better constraints on the soft X-ray lines and the chemical composition of the X-ray emitting gas. We have used the recent ASCA data set, as described in §2, and measured many soft X-ray lines. We have modeled the gas in various ways, as discussed in §3 and the findings are discussed in §4.
2 DATA SELECTION AND ANALYSIS
NGC 1068 was observed by ASCA on 1993 July 25 with an on-source time ksec. The ASCA satellite and instruments are described in Tanaka, Inoue & Holt (1994). In summary, four co-aligned, grazing-incidence, foil-mirror telescopes direct X-rays simultaneously onto four focal-plane instruments. There are two CCD detectors – the Solid-state Imaging Spectrometers (SIS) and two gas–scintillation proportional–counters – the Gas Imaging Spectrometers (GIS).
NGC 1068 was observed with the SISs in 4-CCD mode, with data accumulated in both ’FAINT’ and ’BRIGHT’ telemetry modes. As NGC 1068 has a relatively low count rate in the SIS, the superior resolution available in ’FAINT’ mode could not be utilized. Therefore the FAINT and BRIGHT mode data were combined for the analysis presented here.
We extracted the “raw” event files from the ASCA archive and used these as a starting point for our analysis. These files were created from the original telemetry data and have been corrected to produce linearized detector coordinates, gain corrected pulse–height values and sky co-ordinates determined from the spacecraft aspect solution. We applied data selection and cleaning algorithms using FTOOLS/XSELECT v3.5. Data were rejected by removing ’hot’ and ’flickering’ pixels in the SISs; removing data accumulated during passages through the South Atlantic Anomaly; imposing a minimum geomagnetic rigidity of 6 GeV/; removing data accumulated when the angle from the Earth’s limb was less than 20∘ during orbit-day and less than (SIS) or (GIS) during orbit-night; restricting SIS data to event ’GRADES’ 0,2,3 and 4 and rejecting data taken within 200 seconds after crossing the day/night terminator. We combined the LOW, MEDIUM and HIGH bit-rate data.
Application of these screening criteria gave a mean effective exposure time of 39 ks in the GIS instruments and ks in the SIS instruments. The SIS exposures were significantly lower because necessary differences in the selection criteria for the two instruments, SIS data in 4–CCD mode are particularly prone to problems with telemetry saturation during periods of LOW bit-rate, these caused data dropouts and hence a reduction in useful exposure time.
Images were extracted from the screened and cleaned data from all instruments, and region descriptors defined for the extraction of light curves and spectra. For the two SIS instruments, we used a 3 arcmin circle centered on NGC 1068 with the background taken towards the edge of the same CCD chip. For the two GIS instruments, we used a circular extraction cell of 5 arcmin radius centered on NGC 1068 with the background taken in a nearby source-free region.
The ASCA light curves reveal no significant flux variability across the observation, and thus we consider only the mean spectrum in this paper.
Data from both pairs of SIS and GIS instruments were analyzed together, but with the normalization of each data set allowed to vary relative to the others (since there are small discrepancies in the absolute flux calibrations of the detectors). We used the SIS response matrices released November 1994, and the GIS response matrices released March 1995.
3 MEASUREMENT AND ANALYSIS
3.1 Empirical Fits
Inspection of the ASCA spectrum clearly shows a hard continuum source, strong K lines, several lower energy emission features and a soft 0.5–3 keV continuum component (Marshall et al.; 1993, Ueno et al.; 1994). As argued by Wilson et al. (1992), the soft 0.5–3keV emission is from an extended source, which is contributing at least half the flux at those energies. The likely explanation is an extra-nuclear starburst region. This would imply that the soft X-ray central source is weaker than the one assumed in Marshall et al. (see an extensive discussion by Pier et al., 1996).
Our approach in this work is to first measure the soft X-ray lines in a way which is independent of any model and then to compare those measurements with the prediction of several specific models. The first step is to fit the 0.6–10 keV continuum and all significant emission features that do not correspond to known detector features. The procedure assumes that the observed continuum can be approximated by two smooth functions, such as two power-laws or an absorbed power-law and a thermal continuum. There are several combinations that produce reasonable fits and we do not attach great significance to the chosen functions since they do not represent physical entities. We accept any combination that fits well the overall underlying spectrum. The soft component was allowed to vary freely in the fit, while the hard component was allowed to range between 1.5 and 1.7 in slope. Fig. 1 shows an example where the high energies are fitted a power-law with absorbed soft X-ray part and the low energies are fitted by a second, unabsorbed power-law. In this example, the hard component photon slope is 1.6 () and the soft component slope is . Other combinations give equally good fits where in all cases the hard X-ray photon slope is between 1.5 and 1.7.
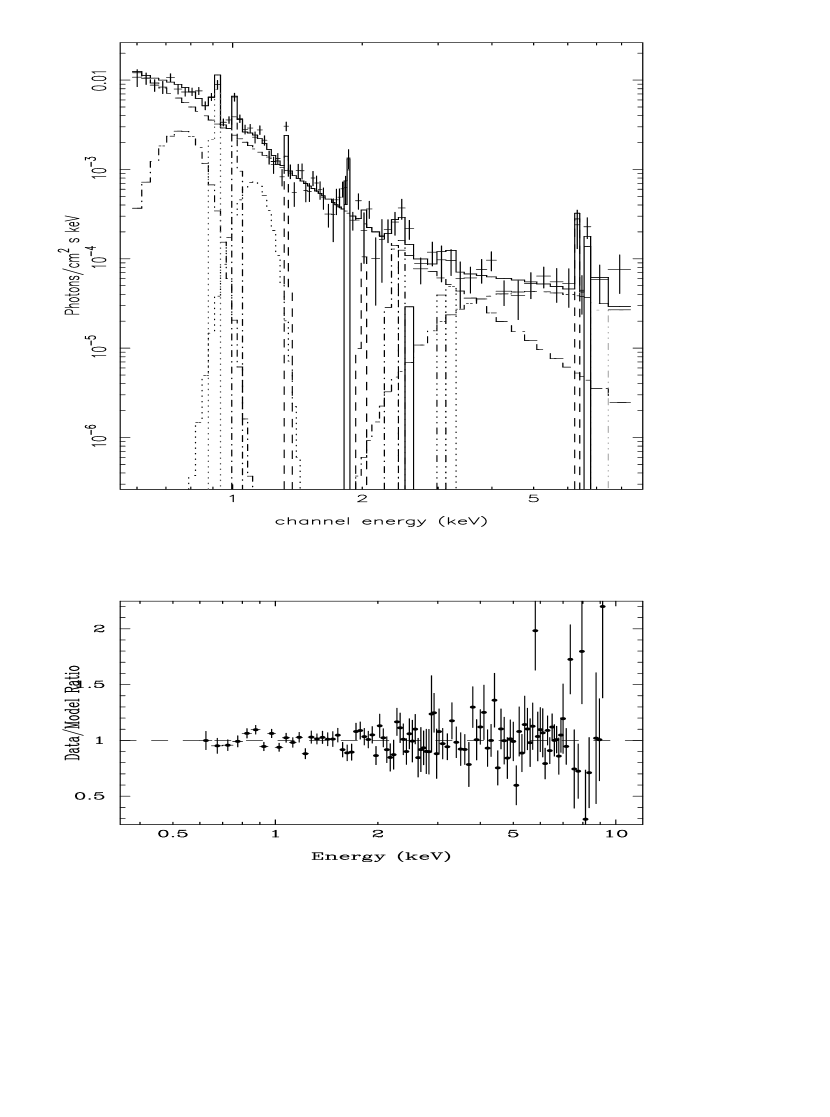
Next, we have added a large number of narrow gaussian lines as free parameters. These include the strongest H-like and He-like lines of all elements in ION and about 20 Fe-L lines. A large number of those are crowded in a small energy range, especially over the ranges of 0.7–0.9 and 1–1.2 keV, which contain a plethora of iron-L lines. The ASCA resolution at those energies is not sufficient to model individual lines and we have fitted these regions by broad gaussians, where the width and centroid energies were chosen based on the spread on the predicted shape of the line blends. Some line pairs (e.g. the H-like and He-like magnesium lines) are also close in energy and while we attempt to fit them individually, in the error analysis (see below) we consider only the combined strength. The total number of broad and narrow gaussians, including the 3 iron K lines, is 15. Fig. 1 shows one of the best fits and Table 1 lists the line intensities corresponding to it.
| Line | Observed flux111One flux unit corresponds to ergs cm-2s-1 | Model 1222Low oxygen, break at 1 keV | Model 2333Solar oxygen, break at 0.5 keV | 90% confidence interval |
|---|---|---|---|---|
| O vii | 0.47 | 0.54 | ||
| O viii | 0.30444The calculated EW, relative to the observed continuum, is 23 eV. | 0.26 | ||
| Fe L 0.7-0.8 keV | 0.98 | 0.42 | 0.13 | |
| Ne ix 915 eV | 0.61 | 0.36 | 0.09 | |
| 0.72 - 0.92 keV | 1.11 | 0.78 | 0.22 | 1.08 - 2.1 |
| Ne x 1.02 keV | 0.32 | 0.08 | 0.05 | |
| Fe L 1.03-1.15 keV | 0.35 | 0.18 | 0.18 | |
| total 1.0 - 1.2 keV | 0.67 | 0.26 | 0.23 | 0.47 - 0.86 |
| Mg xi 1.34 keV | 0.09 | 0.08 | 0.04 | |
| Mg xii 1.47 keV | 0.0 | 0.03 | 0.03 | |
| total 1.34 - 1.47 keV | 0.12 | 0.11 | 0.07 | 0.07 - 0.17 |
| Si xiii 1.85 keV | 0.16 | 0.07 | 0.02 | |
| Si xiv 2.0 keV | 0.03 | 0.05 | 0.05 | |
| total 1.85 - 2.01 keV | 0.19 | 0.12 | 0.07 | 0.11 - 0.28 |
| S i-S x 2.35 keV | 0.07 | 0.02 | 0.02 | |
| S xv 2.45 keV | 0.07 | 0.02 | 0.01 | |
| S xvi 2.62 keV | 0.02 | 0.04 | 0.04 | |
| total 2.35 - 2.62 keV | 0.16 | 0.08 | 0.07 | 0.02 - 0.32 |
| Ar xvii 3.10 keV | 0.04 | 0.01 | 0.01 | |
| Ar xviii 3.30 keV | 0.06 | 0.02 | 0.02 | |
| total 3.1 - 3.31 keV | 0.10 | 0.03 | 0.03 | 0.01 - 0.19 |
| Fe i-Fe xvi 6.4 keV | 0.5 | 0.5 | ||
| Fe xvii-Fe xxiii 6.5 keV | 0.36 | 0.15 | ||
| Fe i-Fe xxiii 6.4–6.5 keV | 0.86 | 0.86 | 0.65 | 0.63 - 1.14 |
| Fe xxv 6.7 keV | 0.54555The EW of the 6.7 keV line is 1.05 keV | 0.50 | 0.5 | 0.29-0.83 |
| Fe xxvi 6.96 keV | 0.29 | 0.30 | 0.29 | 0.09 - 0.52 |
Error estimates are carried out separately for lines and continuum. The continuum uncertainties are not very important since the acceptable range of slopes is rather small (less than 0.2 dex). As for the lines, we have estimated the 90% confidence interval for each line. The step which corresponds to the 90% error range for any particular line, depends upon the number of free parameters which are interdependent with that line normalization. This in turn depends on the relative proximity of other lines, and where the line falls in the spectrum. The line and line-blend estimates are listed in Table 1.
Next we introduce various physical models that represent some combinations of photoionized and collisionally ionized plasmas.
3.2 Models Involving Photoionized Gas
We have investigated the possibility that the observed soft X-ray lines are due to photoionized gas in the nucleus of NGC 1068. We have tried this idea in two different ways: by looking at line intensities in a specific, two component photoionization model, and by scanning a grid of models in a search for the best combination of ionization parameter and column density that fit the ASCA spectrum.
The specific photoionization model assumes that all emission lines originate in two distinct photoionized gas component, a highly ionized component (hereafter the “hot”component) and a moderate ionization component (hereafter the “warm” component). Regarding the continuum, the assumption is that there is a “hard” (1–10 keV), obscured nuclear part, typical of Seyfert galaxies, and a “soft” (3 keV) extended part which is of unknown origin and plays no part in exciting the nuclear gas. Thus, the observed continuum is made out of three components: 1. The reflection of the nuclear continuum by the hot photoionized gas. 2. The reflection of the nuclear continuum by the “warm” photoionized gas, and 3. The extended, directly observed continuum. The soft component contributes a negligible amount above 5 keV. Thus, the normalization is such that the two reflected components (in about equal amounts, see below) fit the observed ASCA and GINGA high energy continuum and that the combination of all three gives a good representation of the overall continuum energy distribution.
The spectral energy distribution (SED) of the central continuum is similar to the one used by Marshall et al. (1993), except for the soft X-ray part. It is made of an infrared-optical-UV broken power-law that fits the overall energy budget of NGC 1068 and an X-ray power-law of photon slope that fits the 1–50 keV continuum. The X-ray is added smoothly to the UV part, below 1 keV. The resulting , without taking into account the soft extended continuum, is 1.6. The nuclear continuum produces about 15% of the total flux at 1 keV and the rest is assumed to be extended (i.e. the 15% is the fraction of the reflected nuclear source out of the total, reflected plus directly observed extended flux).
We have also tried to extend the nuclear component, with the same slope, to lower energies (0.5 keV). As shown below, this helps the oxygen abundance anomaly but introduces other difficulties. The exact optical-UV continuum properties are not very important for the purpose of the present discussion but are influencing the observed ultraviolet lines (see Netzer, 1997).
We have used the photoionization code ION (Netzer 1996 and references
therein) to
model the X-ray ionized gas in NGC 1068. The model inputs are the assumed
central continuum, the density and column density, the X-ray
ionization parameter (i.e. as defined by the 0.1–10 keV photon flux, see
Netzer 1996) and the abundances. We have tested two
possible compositions. The first is motivated by the suspected
unusual oxygen and iron abundances and assumes the
following dust-free composition:
H:He:C:N:O:Ne:Mg:Si:S:Ar:Fe=
:103:3.4:1.1:1.5:1:0.35:0.35:0.16:0.07:1.2,
i.e. solar except for iron, which is three times solar and oxygen, which is
0.2 solar. As shown
below, this is in good agreement with the observations. The second is the same
except that O/H is solar (8).
The photoionization model which is compared with our line measurements is similar to the one presented by Marshall et al. (1993). The warm component column density is 5 cm-2 with an illuminated face density of N cm-3 and the hot component column is 1.9 cm-2, with illuminated-face density of 3100 cm-3. In both models , which is required to explain the large spatial extent of the gas (the optical “mirror”). The illuminated face X-ray ionization parameters are 3.5 and 310, for the warm and hot components respectively (for the physical dimensions see Marshall et al. 1993). We have not introduced any expansion motion but assumed local microturbulences that correspond to the local sound speed. This has some minor effects on the observed spectrum since in this reflection-only geometry, continuum fluorescence can influence some observed line intensities (Krolik and Kriss 1995; Netzer 1996).
Having defined the gas density, location and abundance, we have calculated the expected X-ray spectrum of the two components. The normalization of the reflected and emitted spectrum of the hot and warm components (i.e. the flux unit in Table 1) is such that the calculated K lines match the observed values (Table 1, Model 1). The two separate components, and the resulting composite spectrum, are shown in Fig. 2. Also shown is a comparison of the model (reflected nuclear continuum) with the observations (reflected plus the directly observed extended continuum).

As evident in Fig. 2, the warm gas component exhibits a rich soft X-ray spectrum, composed of numerous lines and edges, and strong “neutral” K lines at 6.4–6.5 keV. The strongest soft X-ray features are Ne ix 915 eV, Mg xi 1.34 keV, Si xiii 1.85 keV and several Fe-L lines. There is a noticeable broad absorption feature, centered around 1.5 keV, which is due to the combined opacity of neon and iron. Oxygen opacity is not important because of the low assumed oxygen abundance. The same is true for the strength of the O viii line which, with the assumed composition, is consistent with the measured upper limit. The volume averaged gas temperature in this component is about 1.1 K and the highest (illuminated face) temperature is 1.5 K. The hot component spectrum is of much higher ionization and temperature (1.5–3.9 K). This gas produces strong He-like and H-like iron lines and the strongest soft X-ray lines are Ne x 1.02 keV, Mg xii 1.47 keV, Si xiv 2.0 keV, S xvi 2.62 keV and a few Fe-L lines.
Table 1 gives the calculated line intensities, normalized as explained, and compares them with the measurements. It shows that the assumed continuum shape, ionization parameter and metalicity, produce a good fit to the observed spectrum.
We have searched for ways to eliminate the need for the abnormally low O/H and found that it is strongly dependent on the 0.5–1 keV incident flux. We have therefore tried a fit assuming a nuclear source with a slope covering the entire 0.5–50 keV range, i.e. much weaker than the previously guessed continuum below 1 keV. In this case, oxygen is less ionized and the O viii equivalent width is consistent with the observed upper limit with solar O/H. However, the model suffers from several inconsistencies. First, the calculated 0.7–0.8 keV Fe-L line fluxes are well below their observed intensity, despite the large assumed Fe/H. Second, some other lines, most notably Ne ix 915 eV, Mg xi 1.34 keV and Si xiii 1.85 keV are much below their observed flux. Thus, in this case, the abundances of neon, magnesium and silicon are all problematic. As seen in Table 1, the overall fit in this case is much less satisfactory.
The second approach is to calculate a grid of hot and warm photoionization models, to combine them with an additional, soft continuum component, and to use a minimization technique to search for the combination that fit best the observed spectrum. This three component fit is chosen from a grid of models (presented as atables in the fitting routine XSPEC) covering a range of column density and X-ray ionization parameter, and assuming a single-slope 0.5–50 keV continuum. The soft soft excess is modeled as thermal bremsstrahlung emission (to avoid emission lines, see below) with temperature as the only free parameter. The photoionized gas composition is identical to the one shown above. Using these components, we find a reasonable good fit with gas kT=0.44 keV (T=5.1K) plasma, column densities of 1022.4 cm-2 (warm) and 1022.6 cm-2 (hot) and X-ray ionization parameters of 1.3 (warm) and 95 (hot). These ionization parameters are measured at the illuminated face and are thus slightly above the volume averaged ionization parameters of the models. The reduced is 1.37 for 509 degrees of freedom. We do not show this fit since it is similar in quality, and major features, to the one shown in Fig. 1. We also note that allowing little freedom in the assumed composition can significantly improve the fit. We avoid this additional complication since, with the limited ASCA capability, it adds nothing to the understanding of the source.
3.3 Models Involving Collisionally Ionized Gas
Our next model is meant to test the hypothesis that most of the line and continuum soft flux is due to the extended, starburst region. The purpose is to test the required composition and overall 0.6–3 keV continuum shape and not to model individual lines.
We have modeled the soft spectrum by a hot plasma “meka” model. The meka model describes an emission spectrum from hot diffuse gas based on the model calculations of Mewe & Gronenschild (1985), Mewe, Lemen, & van den Oord (1986), and Kaastra (1992). The model inputs are plasma temperature hydrogen density and composition. Meka includes line emission from C, N, O, Ne, Na, Mg, Al, Si, S, Ar, Ca, Fe and Ni. We assumed a gas density of 103 cm-3 and allowed the plasma temperature and composition to vary. We added a continuum and a broad Gaussian 6.5 keV line to fit the hard X-ray emission and to enable a reasonable parameterization of the overall X-ray spectrum and hence achieve a meaningful minimization. The best fit is obtained with kT=0.59 keV and metallicity of 0.043 solar. We have measured the line emission between 0.6 and 1 keV, which represents most of the line flux in our best fit model. The measured equivalent width (EW) of the line blend relative to the 0.59 keV continuum, is about 400 eV, i.e. similar to the total emission line EW measured by our two photoionization models. This verifies that models with higher metallicity gave unacceptable fits since they produce too much line emission. This is of great importance to NGC 1068, and to starbursts in general, as discussed in the following section.
4 DISCUSSION
Our data analysis and model fitting show clear evidence for several strong soft X-ray lines in the spectrum of NGC 1068. We have measured those with typical uncertainty of a factor two. The EWs are large, compared with those predicted for Seyfert 1 galaxies (Netzer 1996). This indicates either collisionally ionized plasma or else photoionized gas seen against a reflected continuum. Below we examine the consequence of both as well as the new model by Iwasawa et al. (1997).
4.1 Photoionization models
The two component photoionized gas model, with small O/H, large Fe/H and continuum break at 1 keV, nicely reproduces the observed line intensities in NGC 1068, given the uncertainties. The Marshall et al. (1993) result of large Fe/H is confirmed by our fitting of the K complex as well as by the measured intensity of the Fe-L lines. Given this continuum, the observed upper limit on the O viii line intensity suggests that O/H is smaller than about 0.25 solar, again in agreement with Marshall et al. The composition of all other metals is within a factor two of solar.
Reducing the nuclear flux by moving the break to 0.5 keV, considerably change the conclusion about O/H. This is now consistent with solar but other lines are in bad agreement with the observations. In particular, we could not find a satisfactory fit with solar Ne/H, Mg/H and Si/H. The key future observation is the O vii line which is predicted to be strong in both cases (see Table 1). For example, the line ratios O vii /Ne ix 915 eV and O viii /Ne ix 915 eV could be used to confront the two possibilities. AXAF has got the capability to observe this ratio.
The unusual gas composition required by our photoionized gas models is a severe theoretical problem, since large enhancement of all metals, including oxygen, is expected in central regions of evolved galaxies. It is possible that the poor calibration of the ASCA detectors below 0.6 keV, and the low signal-to-noise of BBXRT, are the origins of the discrepancy. Alternatively, the models shown here do not represent the physical conditions in NGC 1068. However, the presence of a rich spectrum of other metal lines, all consistent with each other, hint to some anomaly in the O/Ne, O/Mg, O/Si and O/S ratios, and in particular in O/Fe. We note again the unusually weak O iii] line in this galaxy, compared with the intensity of semi-forbidden lines of nitrogen and carbon. As explained in Netzer (1997), this is not observed in four other Seyfert galaxies, with measurable ultraviolet narrow lines, and is consistent with low O/N and O/C. Millimeter observations of this galaxy, also hint to an unusual composition (Sterenberg, Genzel, and Tacconi, 1995).
The warm photoionized gas component in NGC 1068 is similar in column density and ionization parameter to many “warm absorber” systems observed in Seyfert 1 galaxies (see George et al. 1997 for references and review). It is interesting to examine the spectrum of the present warm component when observed against a bare central continuum, since the Seyfert 1 systems are normally assumed to originate in gas which is much closer to the central source. We have examined this possibility and found some differences as well as various dynamical implications. The issue has been addressed by Krolik and Kriss (1995) and Netzer (1996) and is beyond the scope of the present paper.
Our photoionization model requires a third, pure continuum component to explain the 0.5–3 keV excess. As discussed below the origin of this component is unclear.
4.2 Collisionally Ionized Plasma
We have attempted to fit the soft X-ray flux by hot plasma models with variable composition. Our single temperature solution requires extremely low (0.04 solar) metallicity. A similar difficulty was encountered by Ueno et al. (1994), who have attempted a multiple component fit to the spectrum. Their best solution is composed of two hot plasma components one of which has 0.03 solar abundance. The origin of this problem is the large EW of lines associated with such a hot plasma. We do not consider such models adequate for NGC 1068, or other evolved regions in galactic nuclei. No optical observations support this and we know of no theoretical model to support this. We note that Pier et al. (1996) suggested that much of the soft excess in NGC 1068 is due to bremsstrahlung emission from the optical “mirror”. This radiation is specifically included in our calculation and, as seen in Fig. 2, cannot explain the soft excess.
The apparent composition anomaly is common to other starburst galaxies. As shown by Serlemitsos, Ptak and Yaqoob (1995), several other sources show soft X-ray lines which, when fitted with multi-component hot plasma models indicate very low metallicity. Interesting examples are shown by Ptak et al. (1997) who studied M82 and NGC 253. Their deduced metallicities are 10–30% solar. We have remeasured the M82 ASCA data used by Ptak et al. and found several soft X-ray lines with typical EWs in the range of 50–100 eV, i.e. similar to those observed in NGC 1068. In the context of hot plasma models, the lines indicate very low metallicity similar to the extended X-ray source in NGC 1068. The most likely explanation is that another, pure continuum model is contributing at those energies. Ptak et al. suggested inverse Compton or accretion-driven point sources, possibly X-ray binaries. They also suggest depletion by dust that will help explain the low iron abundance. Given all unknowns, we cannot be sure that most of the soft X-ray lines in NGC 1068 are due to photoionized gas.
NGC 1068 differs significantly from starburst galaxies by showing large EW low-ionization, H-like and He-like iron lines. The latter two are most probably due to high temperature photoionized gas and one must consider the consequences for production of other lines. Given solar metallicity, such gas must also produce strong argon, sulphur and silicon lines as well as some magnesium, neon and Fe-L emission (see Fig.2). Most of these are in the 0.6–3 keV range where contribution from the extended component is suspected. This makes the simple hot plasma explanation even more questionable. Another important difference is the intensity of the Fe-L lines. The Ptak et al. (1997) observations of M82 and NGC 253, clearly show these lines to be weaker than computed in solar metallicity hot plasma models. We find the lines, that are produced in our case by recombination, not collisions, consistent with higher-than-solar metallicity.
4.3 Reflection by the central torus
An alternative explanation to the warm photoionized component was recently proposed by Iwasawa et al. (1997). These authors suggested that the 6.4 keV iron line originates in the Compton thick “walls” of the central obscuring torus. The model is different from ours in two major ways. First, because of the Compton thick gas, there is more absorption, and hence almost no reflection below about 3 keV (see their Fig. 3). All the X-ray flux below this energy is either due to the hot photoionized gas or the extended emission. Additional manifestations of the Compton thick medium are an extended low energy wing on the 6.4 keV line and very strong 7.1 keV absorption.
While we clearly identify some flux excess at energies below 6.4 keV, with EW of about 100 eV, our fit does not require any 7.1 keV absorption. However, the poor signal-to-noise prevents us from reaching a firm conclusion on this point. As for the low-energy wing, its EW is of the same order as expected from a relativisticly broadened nuclear line. If the continuum and line are both scattered, the relativistic disk component would have the same equivalent width with respect to that continuum, with eV EW in the line wing itself (cf Nandra et al. 1997), as it does when it is directly observed. Thus an alternative explanation is that the X-ray mirror reflects both central line and continuum.
Finally, this explanation would require an even larger iron composition since much of the produced 6.4 keV photons are absorbed by the Compton thick gas.
The second major difference between our model and Iwasawa et al. is the origin of the nuclear mirror. This mirror is known to be extended and covers a sizable fraction of the NLR. In our model, the scattering of the optical broad lines, and optical-UV continuum, is due to both warm and hot components. The amount of reflection is consistent with the required column density and covering fraction (see Marshall et al., 1993, for details). In the Iwasawa et al. (1997) model, only the hot component is extended, and contributes to the reflection, while the warm X-ray gas occupies a very small ( pc) region. Since very hot gas would broaden the reflected BLR Balmer lines beyond recognition, the model requires another, yet unknown medium to explain the extended mirror.
Iwasawa et al. (1997) also suggested a small redshift of the He-like and H-like iron K lines. We find a satisfactory fit for those lines with narrow Gaussian at the systemic velocity.
4.4 Low-Z fluorescence lines
A comment on the intensity of some soft X-ray metal lines is in order. The fluorescence yield of low ionization species is a strongly increasing function of the atomic number. Thus, a fluorescence excitation of low-Z metals, such as oxygen, neon and magnesium, is thought to be negligible. Our calculations clearly show that this is not the case. The reason is the steep high energy continuum of AGN in general, and NGC 1068 continuum in particular. While the yield is indeed small, the K-shell excitation energy of low-Z metals is much lower than in high Z species, and the much larger photon flux more than compensates for the lower yield. We predict that future X-ray experiments of sufficiently high resolution, such as the grating instruments on AXAF and XMM, will discover relatively strong fluorescence lines of low ionization (i.e. lower than Li-like ions) oxygen, neon, magnesium, silicon and sulphur.
Acknowledgements: We are grateful to Ian George, Richard Mushotzky, Paul Nandra, Amiel Sternberg and Andy Ptak for useful comments and discussion. This research is supported by a grant of the Israel Science Foundation. We acknowledge the financial support of the Universities Space Research Association (TJT). The analysis was performed using XSELECT (version 1.3) and XSPEC (version 9). This research made use of data obtained through the HEASARC on-line service, provided by NASA/GSFC.
References
- (1) George, I, et al., 1997, ApJ, (submitted)
- (2) Iwasawa, K, Fabian, A.C., & Matt, G., 1997, MNRAS (submitted)
- (3) Kaastra, J.S. 1992, An X-Ray Spectral Code for Optically Thin Plasmas (Internal SRON-Leiden Report, updated version 2.0)
- (4) Krolik, J.H., & Kallman, T.R., 1988, ApJ L 320, L5
- (5) Krolik, J. & Kriss, G., 1995, ApJ, 447, 512
- (6) Marshall, F.E., et al. 1993, ApJ, 405, 168
- (7) Mewe, R., Gronenschild, E.H.B.M., and van den Oord, G.H.J. 1985, A&AS, 62, 197
- (8) Mewe, R., Lemen, J.R., and van den Oord, G.H.J. 1986, A&AS, 65, 511
- (9) Netzer, H., 1996, ApJ, 473, 781
- (10) Netzer, H., 1997, Astrophs.Sp.Sci., (in press)
- (11) Pier, E.A., Antonucci, R., Hurt, T., Kriss, G, & Krolik, J., 1994, ApJ 428, 124
- (12) Ptak, A., Serlemitsos, P., Yaqoob, T., & Mushotzky, R., 1997, ApJ (submitted)
- (13) Serlemitsos, P., Ptak, A, & Yaqoob, T., 1996, in The Physics of Liners in View of Recent Observations, ASP conference series vo. 103 (Eracleous, Koratkar, Leitherer, & Ho eds.), p70
- (14) Sternberg, A., Genzel, R., & Tacconi, L., 1994, ApJLett, 436, L134
- (15) Tanaka, Y., Inoue, H., & Holt, S., 1994, PASJ, 46, L37.
- (16) Ueno, S, Mushotzky, R.F., Koyama, K., Iwasawa, K, Awaki, H., & Hayashi, I., 1994, PASJ, 46, L71
- (17) Wilson, A.S., Elvis, M., Lawrence, A., & Bland-Hawthorn, J, 1992, ApJLett, 391, L75