T. Oosterbroek (toosterb@astro. estec.esa.nl) 11institutetext: Astrophysics Division, Space Science Department of ESA, ESTEC, P.O. Box 299, 2200 AG Noordwijk, The Netherlands
08.09.2 Her X-1; 08.14.1; 08.16.7 Her X-1; 13.25.5)
The BeppoSAX LECS X-ray spectrum of Hercules X-1
Abstract
We present 0.1–10 keV observations of Her X-1 obtained with the Low-Energy Spectrometer Concentrator instrument onboard the BeppoSAX satellite during the main on-state of the 35 day cycle. We confirm the existence of an intense 0.093 keV blackbody component and a broad emission feature at 0.94 keV. The pulse phase dependence of these components is similar, suggesting a common origin. This is most likely fluorescent excitation of moderately ionized (10–100) material located at the inner edge of the accretion disk.
keywords:
accretion, accretion disks – X-rays: binaries – individual: Her X-11 Introduction
Her X-1 is an eclipsing binary X-ray pulsar with a pulse period of 1.24s and an orbital period of 1.7 days (Tananbaum et al. [1972]; Giacconi et al. 1973). The source exhibits a 35 day X-ray intensity cycle comprising a 10 day duration main on-state and a fainter 5 day duration secondary on-state approximately half a cycle later. At other phases of the 35 day cycle, Her X-1 is still visible at a low level (Jones & Forman 1976). This modulation has been ascribed to a tilted precessing accretion disk that periodically obscures the line of sight to the neutron star (Gerend & Boynton 1980). In addition, a regular pattern of X-ray intensity dips are observed at certain orbital phases. These may be caused by obscuration from periodically released matter from the companion star (Crosa & Boynton 1980).
The broad-band on-state X-ray spectrum of Her X-1 is known to be complex and consists of at least the following components: (1) a power-law with a photon index, , of 0.9 in the energy range 2–20 keV. (2) cyclotron absorption (Trümper et al. 1978; Mihara et al. 1990) at energies keV. (3) A broad Fe emission feature near 6.4 keV (Pravdo et al. 1977; Choi et al. [1994]). (4) A 0.1 keV blackbody (Shulman et al. 1975; Catura & Acton 1975; McCray et al. 1982; see also Mavromatakis 1993; Vrtilek et al. 1994; Choi et al. 1997) and (5) a broad emission feature between 0.8–1.4 keV, which may be unresolved Fe L shell emission (McCray et al. 1982, see also Mihara & Soong 1994).
Pulse-phase spectroscopy using the Einstein Objective Grating (OGS) and Solid State Spectrometers (SSS) in the energy range 0.15–4.5 keV by McCray et al. (1982) reveals that the maximum intensities of the blackbody and power-law components are shifted by 240∘. It is likely that the blackbody component results from hard X-rays that are reprocessed in the inner accretion disk. McCray et al. (1982) note that the maximum intensity of the unresolved 0.8–1.4 keV feature appears coincident with that of the blackbody.
The Low-Energy Concentrator Spectrometer (LECS) on board the BeppoSAX satellite is an imaging gas scintillation proportional counter sensitive in the 0.1–10 keV energy range (Parmar et al. 1997). The LECS energy resolution is a factor 2.4 better than that of the ROSAT Position Sensitive Proportional Counter (PSPC; 0.1–2.5 keV; Trümper 1983) and comparable to that of the Solid State Imaging Spectrometer (SIS) instrument at energies keV (Tanaka et al. 1994). In this paper we utilize the broad-band coverage, moderate spectral resolution and good sensitivity of the LECS to investigate pulse phase dependent changes in the overall Her X-1 spectrum, paying particular attention to the low energy components.
2 Observations
BeppoSAX observed Her X-1 at a 35 day phase, , of 0.07-0.15 (using the ephemeris of Wilson et al. (1993)) between 1996 July 24 13:34 and July 27 13:13 (UTC). This was close to the expected intensity maximum which occurs at 0.1. The standard LECS extraction radius of 8′ was used. Good data were selected from intervals when the minimum elevation angle above the Earth’s limb was 4∘ and when the instrument configuration was nominal using the SAXLEDAS 1.4.0 data analysis package. The spectral analysis was performed with the response matrix from the 1996 December 31 release of SAXDAS. Since the LECS was only operated during satellite night-time, this results in a total exposure of 61 ks. The observation included eclipsing and dipping intervals which were excluded from further analysis leaving an exposure of 37 ks. All spectra were rebinned to have 20 counts in each bin to allow the use of the statistic.
2.1 Phase averaged spectrum
| NH ( atoms cm-2) | |
|---|---|
| Blackbody temperature (keV) | |
| Blackbody normalization1 | |
| (power-law photon index) | |
| Power-law normalization2 | |
| Fe L line energy (keV) | |
| Fe L line FWHM (keV) | |
| Fe L line normalization3 | |
| Fe K line energy (keV) | |
| Fe K line FWHM (keV) | |
| Fe K line normalization3 | |
| 1.38 | |
| dof | 913 |
with the bolometric source luminosity in 1039 ergs s-1 and the distance in units of 10 kpc, assuming isotropic emission; 2photons keV-1 cm-2 s-1 at 1 keV; 3total photons cm-2 s-1 in the line.


We first investigated the phase averaged spectrum shown in Fig. 1. An intense soft flux from Her X-1 is clearly indicated by the large number of counts visible below the instrument’s entrance window cutoff at 0.28 keV. For such a bright, high galactic latitude source, background subtraction is not critical and a standard 112 ksec blank field exposure was used. A simple absorbed power-law model gives an unacceptable fit with a of 27 for 921 degrees of freedom (dof). Adding a 0.1 keV blackbody improves the fit markedly, but still gives a of 6.1. Including a broad Gaussian emission feature at 0.94 keV with an equivalent width (EW) of 410 eV reduces the to 2.1. Finally, the addition of a Gaussian emission feature at 6.4 keV with an EW of 460 eV gives a of 1.38. Given the current calibration status of the LECS, it is not deemed worthwhile to add further components. Note that we cannot discriminate between a single broad Gaussian line at 0.94 keV and two narrow lines at 0.90 and 1.06 keV seen in an extended low-state observation (Mihara & Soong 1994). The results of the phase averaged fit are given in Table LABEL:tab:ave_fits. All uncertainties are quoted at 68% confidence.
The best-fit blackbody temperature of keV is consistent with that measured in the main on-state using the OGS of keV by McCray et al. (1982). As in the OGS data, there is no evidence for any emission features or edges directly associated with this component. The structure in the residuals (see Fig. 1) around 0.25 keV may indicate a more complex low-energy spectral shape, or may result from small uncertainties in the LECS energy calibration. The soft component can also be represented by a 0.34 keV bremsstrahlung model, which gives a similar value of , and similarly shaped residuals, but results in a value of NH of atoms cm-2. It is likely that the 0.94 keV feature seen in the LECS spectrum is the same component as seen in the SSS as an unresolved 0.8–1.4 keV feature and in the ASCA SIS as narrow 0.90 and 1.06 keV lines. This feature most likely originates from Fe L transitions and is hereafter referred to as the “Fe L line”. The blackbody to power-law (2–14 keV) luminosity ratio is 0.08, which differs slightly from the value (0.13) obtained by McCray et al. (1982).
The best-fit value of the equivalent hydrogen column density, NH, of atoms cm-2 is significantly lower than that of McCray et al. (1982) of 1.5–2.7 atoms cm-2 using the OGS and that of Mavromatakis (1993) obtained during the secondary on-state with the PSPC and a power-law and blackbody spectral model of atoms cm-2. The NH obtained with a bremsstrahlung model is consistent with the value of Mavromatakis (1993). The LECS NH is consistent with the upper limit of atoms cm-2 inferred from the absence of a 2200Å interstellar absorption feature in the spectrum of the counterpart star (Gursky et al. 1980).
2.2 Pulse profile
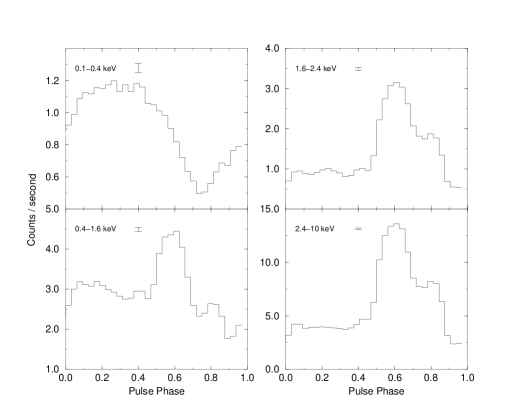

Event arrival times were first converted to the solar system barycenter. Since the light travel time across the Her X-1 orbit (26 s) is large compared to the pulse period, the event arrival times were additionally corrected to the Her X-1 center of mass using the ephemeris of Deeter et al. ([1991]). These corrected data were divided into 32 phase bins and folded over a number of trial periods and a pulse period of s obtained. The uncertainty was determined by performing a linear least-squares fit to the pulse arrival times. This value is consistent with the pulse period history as obtained from BATSE observations. The 0.1–10 keV pulse profile divided into four energy ranges is shown in Fig. 2. This confirms the phase shift between the hard (2 keV) and the soft (0.4 keV) pulses first seen by McCray et al. ([1982]).
2.3 Pulse phase resolved spectra
We next investigated the pulse phase dependence of the various features identified in the phase averaged spectrum. The corrected event data were folded into 20 phase bins using the pulse period given above. The same model as used to describe the phase averaged spectrum was fit to each of the spectra. Inspection of the results revealed that the NH, the central energy of the Fe K line, and the widths of the two Fe lines did not vary significantly with pulse phase, and so these were held fixed at the best-fit values given in Table LABEL:tab:ave_fits.
Figure 3 shows the variations in the best-fit spectral parameters as a function of pulse phase. Clear variations in all the parameters, except for the energy of the Fe L line, are visible. We note that the pulse phase dependence of the blackbody temperature seems to mirror that of the power-law normalization. It is unclear whether the observed change in the blackbody temperature results from an actual change in the underlying blackbody, or from e.g. incorrect modeling of the power-law continuum. Any such effects are likely to be strongly phase dependent given the large variations in normalizations of the two components (see Fig. 3), and we note that the observed change in the blackbody temperature occurs at pulse phases where the blackbody component is faintest.
3 Discussion
There is a strong similarity between the pulse phase dependence of the blackbody and 0.94 keV emission features (see Fig. 3). This suggests that these spectral components are physically related. We have searched for any orbital phase dependence of this relation. Pulse phase resolved spectra were accumulated over orbital phases 0.06–0.45 and 0.45–0.72 (center of eclipse occurs at phase 0.0). There is no significant difference in the behavior of the different fit parameters in the two data sets.
The LECS results are consistent with the illuminated inner part of the accretion disk being the reprocessing site. In a model where the accretion disk intercepts a fraction of the hard X-ray beam (which is then reprocessed) a 180∘ phase difference between the hard X-rays and the reprocessed X-rays is expected. If the disk is tilted with respect to the rotation axis of the neutron star the phase difference can be different from 180∘. Since we find a 250∘ phase difference, this is consistent with a “tilted” disk (for a more detailed discussion see McCray et al. [1982]). A way to test this is to observe Her X-1 at other . If the tilt of the disk varies with , as predicted by the precessing disk models (e.g. Gerend & Boynton 1980), the phase difference should change. Unfortunately, both the BeppoSAX observation and that of McCray et al. (1982) were performed at approximately the same . We searched for a change in the phase difference using data obtained during the first and last 50 ksec of our observation (i.e. a total of 12 ksec exposure time). We find a decrease of 1150∘ which is inconclusive, mainly due to uncertainties in the determination of the peak of the broad soft pulse.
Choi et al. (1994) find that the intensity of the 6.4 keV Fe K line is modulated in phase with the “soft” component reported by McCray et al. (1982). The LECS data is of insufficient quality to investigate this relation, due to the low count rate and penetration effects in the instrument (cf. Parmar et al. 1997). However, it appears likely that both the Fe L and K lines exhibit a similar modulation, and thus have the same origin.
Kallman (1995) discusses Fe L/K emission line ratios and mean line energies in photoionized gases. The line ratio depends on the shape of the ionizing continuum, the column density of the emitting material and the ionization parameter (Tarter et al. 1969). The mean line energies increase with , ranging from 0.750 to 1.29 keV and 6.40 to 6.95 keV for Fe L and K, respectively. Combining the calculations of Kallman (1995) with the line energies and intensities given in Table LABEL:tab:ave_fits and assuming a power-law continuum with in the range 0.5–1.0 allows and NH to be constrained to be 10–100 and atoms cm-2, respectively. The blackbody component could be reprocessed emission originating at higher optical depths in the disk. If the reprocessing region is located at the magnetospheric radius of 3000 km, then the derived value of and the peak power-law luminosity of erg s-1gives an NH of only – atoms cm-2 for a beam opening angle of 0.1 (). However, it is likely that the reprocessing region is not a single layer with uniform density, but more complex, such that there are no unique values of NH and .
Acknowledgements.
T. Oosterbroek acknowledges an ESA Research Fellowship. The BeppoSAX satellite is a joint Italian and Dutch programme.References
- [1975] Catura R.C., Acton L.W., 1975, ApJ 202, L5
- [1994] Choi C.S., Nagase F., Makino F., et al., 1994, ApJ 437, 449
- [1997] Choi C.S., Seon K.I., Dotani T., Nagase F., 1997, ApJ 476, 81
- [1980] Crosa L., Boynton P.E., 1980, ApJ 235, 999
- [1981] Deeter J.E., Boynton P.E., Pravdo S.H., 1981, ApJ 247, 1003
- [1991] Deeter J.E., Boynton P.E., Miyamoto S., et al., 1991, ApJ 383, 324
- [1972] Forman W., Jones C.A., Liller W., 1972, ApJ 177, L103
- [1976] Gerend D., Boynton P.E., 1976 ApJ 209, 562
- [1973] Giacconi R., Gursky H., Kellog E., et al., 1973, ApJ 184, 227
- [1980] Gursky H., Dupree A.K., Hartmann L.W., et al., 1980 ApJ 237, 163
- [1976] Jones C., Forman W., 1976 ApJ 209, L131
- [1995] Kallman T.R., 1995, ApJ 455, 603
- [] Mavromatakis F., 1993, A&A 273, 147
- [1982] McCray R.A., Shull J.M., Boynton P.E., et al., 1982, ApJ 262, 301
- [1990] Mihara T., Makishima, K., Ohashi T., Sakao T., Tashiro M., 1990 Nat 346, 250
- [] Mihara T., Soong Y., 1994. In: Makino F. (ed.) Proc. of New Horizon of X-ray astronomy. Universal Academy, Tokyo, p. 419
- [1997] Parmar A.N., Martin D.D.E., Bavdaz M., et al., 1997, A&AS 122, 309
- [1977] Pravdo S.H., Becker R.H., Boldt E.A., et al., 1977, ApJ 215, L61
- [1975] Shulman S., Friedman H., Fritz G., Henry R.C., Yentis D.J., 1975, ApJ 199, L101
- [1972] Tananbaum H., Gursky H., Kellog E.M., et al., 1972, ApJ 174, L143
- [] Tanaka Y., Inoue H., Holt S.S., 1994, PASJ 46, L37
- [] Tarter C.D., Tucker W., Salpeter E.E., 1969, ApJ 156, 943
- [1978] Trümper J., Pietsch W., Reppin C., Voges W. Staubert R., Kendziorra E., 1978, ApJ 219, L105
- [1983] Trümper J., 1983, Adv. Space Res. 2, 241
- [1990] Vrtilek S.D., Mihara T., Primini F.A., et al., 1994, ApJ 436, L9
- [1993] Wilson R.B., Finger M.H., Pendleton G.N., Briggs M., Bildsten L., 1993. In: Holt S. (ed.) The Evolution of X-ray Binaries. AIP, New York, p. 475