Tim Bedding (bedding@physics.usyd.edu.au)
Stellar populations from adaptive optics observations: four test cases
Abstract
We describe a first attempt to apply adaptive optics to the study of resolved stellar populations in galaxies. Advantages over traditional approaches are (i) improved spatial resolution and point-source sensitivity through adaptive optics, and (ii) use of the near-infrared region, where the peak of the spectral energy distribution for old populations is found. Disadvantages are the small area covered and the need for excellent seeing. We made observations with the ADONIS system at the European Southern Observatory of the peculiar elliptical galaxy NGC 5128; the irregular galaxy IC 5152 (a possible outer member of the Local Group); the Sc galaxy NGC 300 (a member of the Sculptor group); and the Sgr window in the bulge of the Milky Way. These different fields give excellent test cases for the potential of adaptive optics. In the first two cases, we failed to obtain photometry of individual stars, which would have required excellent seeing. For NGC 300 we measured magnitudes for nine individual supergiants (–20.2), but did not go deep enough to detect the tip of the RGB of an old population. For the Sgr field we produced a infrared luminosity function and colour-magnitude diagram for 70 stars down to . These are the deepest yet measured for the Galactic bulge, reaching beyond the turn-off.
keywords:
Instrumentation: Adaptive Optics – Galaxies: stellar content – Galaxies: individual: NGC 5128, IC 5152, NGC 300 – Galaxy: stellar content1 Introduction
Much progress has been made towards an understanding of galaxy formation (e.g., ? (? ? (?). However, the formation of elliptical galaxies and the bulges of spirals and the relationship between them remains an area of considerable uncertainty. Did they form shortly after the Big Bang in a short period of intense activity that consumed all the gas and prevented further star formation? Or did they have several episodes of star formation, somehow triggered by mergers or accretion processes? In this case, the observed light would come from both old and intermediate age stars.
The issue can be resolved by constructing luminosity functions (LFs) and colour-magnitude diagrams (CMDs) for the stars in ellipticals and bulges, and comparing these with predictions from stellar evolutionary theory. The theory is fairly well understood, having been tested and calibrated on open and globular clusters spanning a wide range of ages and metallicities (see reviews by ? (? ? (?; ? (? ? (?). The project requires photometry to identify and measure luminosities for the stars at the top of the asymptotic giant branch (AGB). This method would complement the existing integrated spectroscopic data and would allow one to study the stellar distribution, to separate the different populations, and to estimate the ages, metallicities and distances of these populations.
HST/WFPC2 has been used for such projects at visible wavelengths, both for globular clusters in nearby galaxies (? (? ? (?; Jablonka et al., in preparation) and the stellar components of more distant galaxies (?; ?). However, there are several arguments for making these stellar population studies in the near-infrared (?; ?):
-
•
The spectral energy distributions of red giant stars peak in the infrared, increasing the contrast relative to the underlying fainter and bluer stars.
-
•
Extinction and reddening from dust are less than in the visible ().
-
•
The degeneracy in the optical colours of the red giant branch is avoided. This degeneracy makes it difficult to determine ages or metallicities from optical photometry, especially for the more metal-rich populations that dominate bulges and ellipticals (?).
-
•
The transformation between the photometric observations and theory (, ) is easier in the infrared than in the visible: the colour is directly related to , and the and magnitudes are directly related to (e.g. Frogel et al. 1992, Johnson 1992). The filter is particularly useful for constructing deep luminosity functions because the bolometric correction is essentially independent of colour (; ? (? ? (?).
Until now, accurate infrared photometry for individual stars has only been possible in galaxies of the Local Group. The bulge of the Milky Way has been well studied in the near-infrared (?; ?; ?), as have the dwarf elliptical M32 (?) and the bulges of the Local Group spirals M31 (?) and M33 (?; ?). Obtaining CMDs for more distant galaxies would clearly be a very significant result. For example, the top of the AGB in M31, M32 and M33 is clearly seen to have a sharp cutoff at (?), reflecting the fact that these three galaxies are at about the same distance. Measuring this cutoff magnitude in more distant galaxies should allow distance determination. Here we make steps towards this goal by exploiting another advantage of near-infrared observations: the availability of adaptive optics.
Adaptive optics (AO) involves using a deformable mirror to make real-time corrections to image distortions that arise from atmospheric turbulence (see ? (? ? (? for a recent review). By reducing the diameters of stellar images and so increasing the signal relative to the background sky, this technique gives a substantial gain in the sensitivity of point-source photometry. Furthermore, the improvement in spatial resolution reduces confusion in crowded regions. One important limitation is that, until laser beacons become available, we are restricted to fields which lie near a bright foreground star.
In this paper we describe a first attempt to apply adaptive optics to the study of resolved stellar populations in galaxies. We have selected four widely different targets for this study which together provide excellent cases for testing the potential of adaptive optics.
2 Observations and data reduction
Observations were made in 1995 March and August with the ESO 3.6-m telescope using ADONIS (ADaptive Optics Near Infrared System; ? (? ? (?; ? (? ? (?; ? (? ? (?). The ADONIS instrument is the successor to COMEON+. Wavefront sensing is done at visible wavelengths and the science detector operates in the near infrared. For the latter we used the SHARP II camera, which contains a NICMOS 3 array with pixels, giving a field of . The response of the system peaks in the band (1.6 m).
An adjustable mirror in ADONIS allows one to make offsets of a few arcseconds within a field, which we found useful in constructing a local flat field. It also allowed us to ensure that neither the bright reference star nor its diffraction spikes fell on the science detector. For each field we obtained a sequence of exposures offset by from the field centre in each of four orthogonal directions. The median of these frames was used to construct a flat field. After dark-subtraction, flat-fielding and interpolation over hot pixels, the images were aligned and added to produce a single mosaic. Due to the sub-stepping process, the central of the mosaic has the greatest effective exposure time and hence the highest signal-to-noise ratio.
We performed aperture photometry using the DAOPHOT package within IRAF. Our photometric standard was HD 161743 (spectral type B9 IV), for which we adopted magnitudes of and (?). The internal errors were measured using DAOPHOT in all cases. Results for the four targets are described in the next section.
3 Results
3.1 The giant elliptical galaxy NGC 5128
The S0/E pec. galaxy NGC 5128 (Cen A) is of interest both as the closest radio galaxy and because it shows evidence of having undergone a recent interaction. Fortuitously, two foreground stars are superimposed on the body of the galaxy. These are SAO 224118 (, spectral type K5) and SAO 224131 (; F0), which lie at distances of 4.5′ and 10.9′ from the nucleus and away from the central dust lane.
The ADONIS observations were made on 1995 March 23 and August 21. We observed fields next to both reference stars, but seeing conditions were poor and fast variations prevented good correction. The first star, SAO 224118, was bright () and produced too much scattered light on the science detector, preventing accurate sky subtraction. From a total integration time of 1 hour near the second star we failed to detect any individual stars in NGC 5128, down to an estimated magnitude limit of . Assuming the presence of old giant stars reaching , this allows us to place a lower limit on the distance to the galaxy of about 3 Mpc.
Since these observations, ? (?) have published the first colour-magnitude diagram of the NGC 5128 halo, obtained with HST/WFPC2. They resolved this galaxy into stars and convincingly detected the tip of the old RGB at , deriving a distance of Mpc, consistent with our lower limit. These RGB stars would have , beyond our magnitude limit. ? (? also detected a handful of AGB stars, extending to , equivalent to . These stars would be at the limit of our detection and their absence is explained by the small field covered here, although we speculate that a few would have been detected with better seeing.
3.2 The halo of IC 5152
IC 5152 is a typical dwarf irregular (dIrr) galaxy on the outer fringe of the Local Group, at a distance of about 1.6 Mpc (?; ?). We observed a field in the outer part of IC 5152 in 1995 August using SAO 247284 as a reference. This star has coordinates , , magnitudes , , and spectral type A3. The seeing was 0\farcs6–1\farcs0. From a 40-minute integration at we detected three very faint stellar sources but low counts prevented us from deriving accurate magnitudes.
Our failure to detect more stars could indicate that IC 5152 is more distant than 1.6 Mpc, or that its halo does not extend this far from the nucleus. On the basis of these marginal detections and the results obtained on NGC 300 (discussed below), we believe that useful results would have been possible on IC 5152 under excellent seeing conditions.
3.3 The disk of NGC 300
NGC 300 is a spiral galaxy in the Sculptor Group and lies at a distance of about 2 Mpc (?; ?). Infrared photometry of the brightest M-supergiants in NGC 300 has been carried out by ? (?). They published colours and magnitudes for ten stars, five of which they confirmed spectroscopically as galaxy members, with the rest being foreground dwarfs. The magnitudes of these bright M-supergiants in NGC 300 range from to and their colours range from to .
There are no suitable reference stars for the bulge of NGC 300. We used a bright star superimposed on the disk, about 2′ SW of the nucleus in the prominent SW spiral arm. The star is located at , and, according to the Guide Star Catalogue, has a magnitude of 9.2 on a IIIaJ plate. In the future, with improved AO systems, it may be possible to use the compact nucleus of NGC 300 itself as a reference to study the central regions.
We used ADONIS on 1995 August 24 to observe a field 15′′S and 15′′E of the reference star. For these observations, the offsets applied between each sub-exposure were 1′′ rather than . The field was located in between, but did not include, the red stars R21 () and R20 () of ? (?).
A image taken during particularly good seeing ( at the seeing monitor) revealed about twelves sources with FWHM –. However, reliable photometry was prevented by a bright strip across the image that was probably caused by reflected or scattered light from the reference star. For comparison, a deep (30-minute) NTT frame taken in band in 0\farcs6 seeing as part of a separate program (?) shows the same stars, confirming the sensitivity of adaptive optics. Note that photometry of the NTT image in this region is impossible because the reference star is saturated.
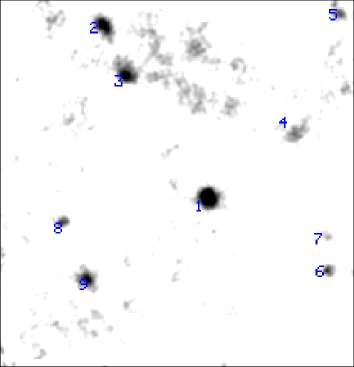
Our -band ADONIS image was not compromised by scattered light and is shown in Figure 1. It is the result of a 40-minute exposure taken in moderately good seeing (1′′ at the seeing monitor). However, the slow variation of the seeing allowed good correction by the AO system. The magnitudes of the stars labelled 1 to 9 are: 18.29, 18.54, 19.16, 20.21, 19.41, 19.48, 19.76, 19.81 and 19.67. The stars detected here are more than three magnitudes fainter than the bright supergiants of ? (?) that reach .
This field is not crowded, although the surface magnitude of the underlying stars is mag/arcsec2 (?). We resolved individual supergiants, but did not go deep enough to detect the tip of the RGB of an old population, which would be at at the distance of NGC 300. The stars observed here correspond to the bright supergiants with seen in the optical colour-magnitude diagrams of the disk of NGC 300 (?; ?).
3.4 The faintest stars in the Galactic bulge
We selected a field in the direction of the Galactic bulge, which should yield information about the structure of the inner Milky Way. We observed the Sgr field, which is located at , at a projected distance of kpc from the Galactic centre (assuming kpc). This is a crowded field, with sources covering a wide range of magnitudes. The reference star is located at , . This star has estimated magnitudes of and .
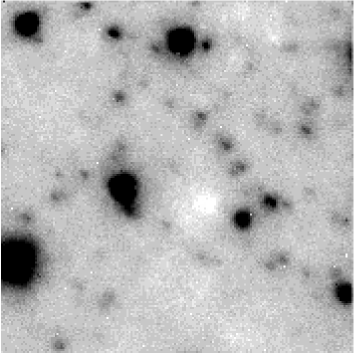

Figure 2 shows a 40-minute exposure in taken on 1995 August 24 during particularly good seeing. The FWHM of stellar sources is . This image is much deeper than a combined exposure of 160 minutes taken the previous night in poorer seeing. We have found 70 stars in this image and obtained aperture photometry with DAOPHOT. Because of the variation of the PSF across the image, the aperture corrections for both the program stars and the photometric standard are large ( mag) and are therefore an important source of error in the final photometry.
Note that the accuracies of photometry and of transformation to the standard system are limited for AO observations by the fact that the AO corrections differ for the program stars, the AO reference star and the photometric standards, due to sky and seeing variations. All images were taking in a close temporal sequence to minimize these errors, but we conclude that our zero point is good to only mag.
Figure 3 shows a luminosity function for the Sgr window. As well as the ADONIS data, we have included the measurements of ? (?), which cover the brighter magnitudes from to . This infrared luminosity function represents the deepest yet measured for the Galactic bulge, reaching beyond the bulge turn-off, which is located at .

Figure 4 shows a deep infrared colour-magnitude diagram from our ADONIS data. Note, however, that the -band photometry is less accurate because of poorer seeing and we detected only half of the sources seen in the images taken on August 22. The position of the sources for the photometry were determined in the deeper images. The internal errors in the magnitudes for are small (a few hundredths of a magnitude), and for are much larger ( mag). The photometry has larger errors, and the limiting magnitude is about one magnitude brighter than at .
4 Conclusions
We have made a first attempt to apply adaptive optics to the study of stellar populations in our galaxy and beyond. In the cases of NGC 5128 and IC 5152, we failed to detect individual stars. We believe that these targets should be feasible with ADONIS in good seeing. For NGC 300 we resolved a small number of K supergiants in the disk and presented a deep -band luminosity function. For the Sgr bulge window our colour-magnitude diagram and luminosity function are the deepest yet obtained, reaching the turn-off of the bulge population for the first time in the infrared. These results demonstrate the feasibility of the method. Four factors are important in determining potential results:
- Seeing
-
The quality of adaptive correction depends critically on the temporal frequency of the seeing variations. Obtaining CMDs of distant galaxies is only feasible under excellent seeing conditions ( and slow variations). Good seeing, and hence good adaptive correction, also helps to reduce the problems of field crowding.
- Contamination
-
The line of sight to distant objects goes through the halo of our Galaxy, which contains many low mass stars. These can be estimated down to very faint magnitudes using simple Galactic models, and turn out not to be important. The contamination by background galaxies is expected to dominate at very faint magnitudes. In principle, this could be accounted for by observing control fields.
- Availability of reference stars
-
We require a bright star to be conveniently located for wavefront sensing. We found it best to use reference stars of . Brighter stars produce stray light contamination, making it difficult to flat-field and background-subtract, and fainter stars do not allow good correction.
- Field of view
-
Adaptive optics correction is presently restricted to a small field around the reference star. This makes it time consuming to cover large regions of sky, which is necessary to improve the statistics.
With ADONIS on the ESO 3.6-m telescope we reached a 3-sigma limiting magnitude of in one hour on point sources. Based on the limiting magnitude obtained in the NGC 300 field under good seeing conditions (FWHM), we estimate that ADONIS can detect the brightest stars in bulges and ellipticals out to a distance modulus of (3 Mpc). These figures are based on an absolute magnitude of for the brightest giants in spheroidal populations of Local Group galaxies (neglecting reddening). For comparison, for the Centaurus group has (?).
The results presented here should be surpassed by HST/NICMOS, provided that this system can be made to operate to specification. However, observations using adaptive optics on 8-m class telescopes, while restricted to small fields of view, should be competitive with HST/NICMOS because of the larger aperture and higher spatial resolution.
Laser beacons should dramatically increase the sky coverage of adaptive optics (see the review by ? (? ? (?). A natural guide star will still be required to determine the overall wavefront tilt, but this star can be faint and the chances will be high of finding a suitable guide star somewhere in the field of interest. Using a laser beacon will also eliminate the problem of scattered light from the bright reference star, an important advantage.
We intend in the future to use the new deconvolution/co-addition codes developed recently by ? (?). Their algorithm optimally combines numerous dithered frames of the same object in a deep sharpened image, on which accurate photometry can be performed (e.g., ? (? ? (?). It is very likely that such a technique, combined to the improved performances of the AO systems of the VLT, will be competitive with HST/NICMOS.
Acknowledgements.
We are happy to thank the ADONIS team and the Adaptive Optics Group at ESO for their efficiency and support, especially J.-L. Beuzit, P. Bouchet, N. Hubin, D. Le Mignant, P. Prado and E. Prieto. We also thank A. Quirrenbach, A. Zijlstra and R. Fosbury for their help and useful discussions. T.R.B. is grateful to the Australian Research Council for financial support. F.C. is supported by ARC94/99-178 ”Action de Recherche Concertée de la Communauté Française (Belgium)” and Pôle d’Attraction Interuniversitaire P4/05 (SSTC, Belgium). This work was performed in part under the auspices of the U.S. Department of Energy by Lawrence Livermore National Laboratory under Contract W-7405-Eng-48.References
- [1] [ ] Beckers, J. M., 1993, ARA&A 31, 13
- [2]
- [3] [ ] Bender, R., Davies, R. L. (eds.), 1996, Proc. IAU Symp. 171: New Light on Galaxy Evolution, Kluwer: Dordrecht
- [4]
- [5] [ ] Bessell, M. S., Wood, P. R., 1984, PASP 96, 247
- [6]
- [7] [ ] Beuzit, J.-L., Brandl, B., Combes, M., et al., 1994, ESO Messenger 75, 33
- [8]
- [9] [ ] Bica, E., Barbuy, B., Ortolani, S., 1991, ApJ 382, L15
- [10]
- [11] [ ] Carignan, C., 1985, ApJS 58, 107
- [12]
- [13] [ ] Courbin, F., Claeskens, J.-F., 1997, ESO Messenger (in press)
- [14]
- [15] [ ] Davidge, T. J., 1991, ApJ 380, 116
- [16]
- [17] [ ] Elias, J. H., Frogel, J. A., Matthews, K., Neugebauer, G., 1982, AJ 87, 1029 (Erratum: 87, 1893)
- [18]
- [19] [ ] Freedman, W. L., 1992, AJ 104, 1349
- [20]
- [21] [ ] Freedman, W. L., Madore, B. F., Hawley, S. L., et al., 1992, ApJ 396, 80
- [22]
- [23] [ ] Frogel, J. A., Whitford, A. E., 1987, ApJ 320, 199
- [24]
- [25] [ ] Fusi Pecci, F., Buonanno, R., Cacciari, C., et al., 1996, AJ 112, 1461
- [26]
- [27] [ ] Gendron, E., Lena, P., 1995, A&AS 111, 153
- [28]
- [29] [ ] Humphreys, R. M., Graham, J. A., 1986, AJ 91, 522
- [30]
- [31] [ ] Magain, P., Courbin, F., Sohy, S., 1997, ApJ (submitted; preprint astro-ph/9704059)
- [32]
- [33] [ ] McLean, I. S., Liu, T., 1996, ApJ 456, 499
- [34]
- [35] [ ] Minniti, D., 1995, A&A 300, 109
- [36]
- [37] [ ] Minniti, D., Bedding, T. R., 1995. In: Walsh, J., Danziger, I. J. (eds.), Science with the VLT, ESO Springer: Berlin, p. 236
- [38]
- [39] [ ] Minniti, D., Olszewski, E. W., Rieke, M., 1993, ApJ 410, L79
- [40]
- [41] [ ] Minniti, D., Olszewski, E. W., Rieke, M., 1995, AJ 110, 1686
- [42]
- [43] [ ] Renzini, A., Fusi Pecci, F., 1988, ARA&A 26, 199–244
- [44]
- [45] [ ] Rich, R. M., Mould, J. R., Graham, J. R., 1993, AJ 106, 2252
- [46]
- [47] [ ] Richer, H. B., Pritchet, C. J., Crabtree, D. R., 1985, ApJ 298, 240
- [48]
- [49] [ ] Rousset, G., Beuzit, J.-L., Hubin, N., et al., 1994. In: Ealey, M. A., Merkle, F. (eds.), Adaptive Optics in Astronomy, Proc. SPIE vol. 2201, , p. 1088
- [50]
- [51] [ ] Sandage, A., 1986, ApJ 307, 1
- [52]
- [53] [ ] Silva, D., 1996. In: Minniti, D., Rix, H. W. (eds.), Spiral Galaxies in the Near–IR, Reidel: Dordrecht, p. 3
- [54]
- [55] [ ] Soria, R., Mould, J. R., Watson, A. M., et al., 1996, ApJ 465, 79
- [56]
- [57] [ ] van den Bergh, S., 1994, AJ 107, 1328
- [58]
- [59] [ ] VandenBerg, D. A., Stetson, P. B., Bolte, M., 1996, ARA&A 34, 461
- [60]
- [61] [ ] Walker, A. R., 1995, PASP 107, 683
- [62]
- [63] [ ] Zijlstra, A. A., Minniti, D., Brewer, J., 1996, ESO Messenger 85, 23
- [64]