The Age Of Globular Clusters In Light Of Hipparcos: Resolving the Age Problem?
Abstract
We review five independent techniques which are used to set the distance scale to globular clusters, including subdwarf main sequence fitting utilizing the recent Hipparcos parallax catalogue. These data together all indicate that globular clusters are farther away than previously believed, implying a reduction in age estimates. We now adopt a best fit value at with an additional uniform systematic uncertainty of . This new distance scale estimate is combined with a detailed numerical Monte Carlo study (previously reported by Chaboyer et al. 1996a) designed to assess the uncertainty associated with the theoretical age-turnoff luminosity relationship in order to estimate both the absolute age and uncertainty in age of the oldest globular clusters.
Our best estimate for the mean age of the oldest globular clusters is now Gyr, with a one-sided, 95% confidence level lower limit of 9.5 Gyr. This represents a systematic shift of over 2 compared to our earlier estimate, due completely to the new distance scale—which we emphasize is not just due to the Hipparcos data. This now provides a lower limit on the age of the universe which is consistent with either an open universe, or a flat, matter dominated universe (the latter requiring ). Our new study also explicitly quantifies how remaining uncertainties in the distance scale and stellar evolution models translate into uncertainties in the derived globular cluster ages. Simple formulae are provided which can be used to update our age estimate as improved determinations for various quantities become available. Formulae are also provided which can be used to derive the age and its uncertainty for a globular cluster, given the absolute magnitude of the turn-off, or the point on the subgiant branch 0.05 mag redder than the turn-off.
keywords:
stars: interiors – stars: evolution – stars: Population II – globular clusters: general – cosmology: theory– distance scaleCERN-TH/97-121
CWRU-P4-97
astro-ph/9706128
June 1997 (revised July 97)
1 Introduction
The absolute age of the oldest Galactic globular clusters (GCs) currently provides the most stringent lower limit to the age of the universe, and as such, provides a fundamental constraint on cosmological models. In particular, for some time the best GC age estimates have been in direct contradiction with the maximum Hubble age for the preferred cosmological model, a flat matter dominated universe. The most recent comprehensive analyses suggested a lower limit of approximately 12 Gyr for the oldest GC’s in our galaxy ( e.g. Chaboyer, Demarque, Kernan & Krauss 1996, hereafter Paper I ), which, for a flat matter dominated model, implies , a value which is low compared to almost all observational estimates.
Because of this apparent discrepancy, it remains critically important to continue to re-evaluate the errors associated with the GC age determination process itself. GC age estimates are obtained by comparing the results of theoretical stellar evolution calculations to observed color magnitude diagrams. The absolute magnitude of the main-sequence turn-off () has small theoretical errors, and is the preferred method for obtaining the absolute ages of GCs (e.g. Renzini (1991)). Age determination methods which utilize the color of the models, or post main-sequence evolutionary models are subject to much larger theoretical uncertainties, and do not lead to stringent age limits.
In recent years, a number of authors have examined the question of the absolute age GCs (e.g. Chaboyer & Kim (1995), Mazzitelli et al. (1995), Salaris et al. (1997)) using different assumptions for the best available input physics. Chaboyer (1995) presented a table of absolute GC ages based on a variety of assumptions for the input physics needed to construct the theoretical age- relationship. VandenBerg et al. (1996) have presented a review of the absolute ages of the GCs, and by comparing results from different authors, include an discussion on how various uncertainties in the age dating process effect the final age estimate.
In order to obtain both a best estimate, and a well-defined lower limit to the absolute age of the oldest GCs, we earlier adopted a direct approach of running a Monte Carlo simulation. In our Monte Carlo, the various inputs into the stellar evolution codes were varied within their inferred uncertainties, utilizing 1000 sets of isochrones, and the construction of over 4 million stellar models. From these theoretical isochrones, the age- relationship was determined, and combined with an empirical calibration of 111Throughout this paper, the terms (V(RR)) and (V(HB)) will be used interchangably, with the understanding that (V(HB)) refers to the mean magnitude of the HB in the instability strip. in order to calibrate age as a function of the difference in magnitude between the main sequence turn-off and horizontal branch (). This calibration was used to derive the mean age of 17 old, metal-poor GCs using . The principal result of this work was an estimate for the age of the oldest GCs of Gyr, with the one-sided 95 C.L. lower bound of 12.1 Gyr ( Paper I ) mentioned above. Another important result was an explicit demonstration that the uncertainty in overwhelmingly dominated the uncertainty in the GC age determination. We chose a Gaussian distribution for the uncertainty in because the data, while scattered, appeared to be appropriately distributed about the mean value, which we then determined to be at , with an uncertainty of approximately at the confidence level.
Since this work was completed, the Hipparcos satellite has provided improved parallaxes for a number of nearby subdwarfs (metal-poor stars) (Perryman et al. (1997)), the distance to a GC has been estimated using white dwarf sequence fitting (Renzini et al. (1996)), a number of new astrometric distances to GCs have been published (Rees (1996)), and improved theoretical horizontal branch models have become available (Demarque et al. (1997)). This has lead us to critically re-evaluate the globular cluster distance scale (and hence, the calibration), and update our estimate for the absolute age of the oldest GCs. We find, using the full Hipparcos catalogue along with the other independent distance estimators that all the data suggests that this distance scale, and hence the GC age estimate have shifted by a significant amount, suggesting that the dominant uncertainty in was, and still is, not statistical but rather systematic in character.
A detailed discussion of the globular cluster distance scale is presented in §2. The input parameters and distributions in the Monte Carlo are presented in §3. The principal results of this paper are presented in §4, which includes simple formulae which can be used to update the absolute age of the oldest GCs when improved estimates for the various input parameters become available. Finally, §5 contains a brief summary of our results, and a brief discussion of their cosmological implications.
2 The Globular Cluster Distance Scale
It is currently impossible to directly determine distances to GCs using trigometric parallaxes. While such distance estimates may be available in the future from micoarcsecond space astrometry missions (Lindegren & Perryman (1996), Unwin, Boden & Shao (1996)), at present a variety of secondary distance estimates are all that is available for GC’s. The different techniques rely upon different data and assumptions. As such, we have elected to review a number of these techniques, and present a GC distance scale which is based on combining 5 independent estimates. To facilitate this, we have reduced the various distance estimates to a calibration of . This allows us to derive GC ages via the method (see §4). As we are interested in absolute ages, we have focused our attention on those techniques which rely upon the minimum number of assumptions and thus hopefully should provide a priori the most reliable absolute distances.
2.1 Astrometric Distances
A comparison of the proper motion and radial velocity dispersions within a cluster allows for a direct determination of GC distances, independent of reddening (Cudworth (1979)). Although this method requires that a dynamical model of a cluster be constructed, it is the only method considered here which directly measures the distance to a GC without the use of a ‘standard’ candle. The chief disadvantage of this technique is its relatively low precision. This problem is avoided by averaging together the astrometric distances to a number of different GCs. Rees (1996) presents new astrometric distances to eight GCs, along with two previous determinations. As pointed out by Rees, there are possibly large systematic errors in the dynamical modeling of M15, NGC 6397 and 47 Tuc. As such, these clusters will be excluded in our analysis. In addition Rees (private communication) cautions that the distance to M2 will be revised soon to due to a new reduction of the M2 proper motions. Excluding this cluster from the analysis results in six clusters whose distances have been estimated astrometrically. Table 1 tabulates the astrometric distances from Rees (1996). Unless otherwise noted, the numbers are those given by Rees (1996).. For the values, we have given preference to the high dispersion results of Kraft, Sneden and collaborators. Taking the weighted average of the values listed in Table 1 results in at , where the average value has been calculated using the same weights as in the average.
2.2 White Dwarf Sequence Fitting
Renzini et al. (1996) have utilized deep HST WFPC2 observations of NGC 6752 to obtain accurate photometry of the cluster white dwarfs. They have combined this with similar observations of local white dwarfs with known parallaxes and masses (close to those in the cluster) to derive the distance to NGC 6752 using a procedure similar to main sequence fitting. The derived distance modulus is assuming . This reddening estimate is from Zinn (1985), and is identical to those found by Burnstein & Heiles (1982) and Carney (1979). NGC 6752 is a moderately metal-poor ( from Zinn & West (1984)) cluster with (tabulated by Chaboyer et al. 1996c ). NGC 6752 has an extremely blue HB, thus, an estimate of V(HB) relies upon an extrapolation of the observed photometry. As such the determination of V(HB) in NGC 6752 is rather uncertain, and so have elected to take a rather generous error bar in the determination of V(HB) of mag. Combining the above quantities yields .
2.3 Subdwarf Main Sequence Fitting
Using parallaxes of nearby field stars, it is possible to define the position of the ZAMS, and via a comparison to deep GC color magnitude diagrams obtain a rather direct estimate of the distance to a cluster. Unfortunately, the position of the ZAMS is a rather sensitive function of metallicity, and there are few nearby subdwarfs. Hence, there are few metal-poor stars with well determined absolute magnitudes.
The release of the Hipparcos data (Perryman et al. (1997)) has improved this situation somewhat, providing a large database of high quality parallax measurements. The Hipparcos catalogue contains over 100,000 stars, of which nearly 21,000 stars have parallax errors less than 10%. The Hipparcos catalogue has been searched for stars which are suitable for GC main sequence fitting. When selecting stars for use in main sequence fitting, it is important to avoid potential biases due to unresolved binaries and stars which are evolved off the ZAMS. Known or suspected binaries which are not resolved photometrically should be avoided as both magnitudes and colors may be significantly altered by the presence of a companion. The use of stars which have evolved off the ZAMS may lead to systematic errors in the derived distance moduli, as it is not clear if GCs and metal-poor field stars are exactly of the same age. For example, a 2 Gyr age difference between a calibrating subdwarf at and a GC would lead to a systematic error of 0.14 mag in the distance modulus (based on our standard isochrones). To be safe, we will only consider stars with . Fainter than this, the stars are essentially unevolved.
Many of the stars in the Hipparcos catalogue have large relative parallax errors and are not useful for main sequence fitting. For these reason, we have elected to only consider stars with . This stringent selection criterion was selected to minimize potential Lutz-Kelker type biases (Lutz & Kelker (1973), Brown et al. (1997)). The Hipparcos catalogue was searched for stars which (a) have , (b) are fainter than , and (c) are not known or suspected Hipparcos binaries or variables. This resulted in a list of 2618 stars, of which the great majority have near solar metallicity. As we are interested in the most metal-poor globular clusters, we require stars with . To identify the metal-poor stars in the Hipparcos sample, we have cross identified the above Hipparcos subsample with a variety of catalogues: the 1996 high resolution spectroscopic catalogue Cayrel de Strobel et al. (1997), the Carney et al. (1994) catalogue, and the measurements reported by Gratton et al. (1997) and Pont et al. (1997). Stars with were selected for further study. Carney et al. (1994) and Pont et al. (1997) obtained numerous radial velocity measurements which could be used to identify potential binaries. Gratton et al. (1997) have search for binaries based on an excess infrared flux. Any stars which were known or suspected binaries were removed from our final list. In total only 10 stars in the Hipparcos catalogue pass our stringent selection criterion (, , , and not known or suspected binaries). Given the small parallax errors in our sample, Lutz & Kelker (1973) type corrections are expected to be small (Brown et al. (1997)). This issue is explored via a detailed Monte Carlo analysis in Appendix A, where it is concluded that the sample is indeed free from systematic biases, and so no corrections have been applied to the absolute magnitudes derived from the Hipparcos parallax observations. Another indication that possible Lutz-Kelker type corrections are small for our sample is that the the maximum value is 0.08, well below our threshold of 0.10. This makes it extremely unlikely that stars whose true parallax are systematically smaller than the observed parallax are preferentially included in our sample (the source of Lutz-Kelker type biases).
Our subdwarf sample only has two stars in common with the sample of Pont et al. (1997). This is because the Pont et al. (1997) sample only includes five stars on the ZAMS (). As discussed above, even as small as a 2 Gyr age difference between evolved subdwarfs and the GC will lead to systematic errors in the distance modulus of mag. Of the unevolved stars in the Pont et al. (1997) sample, three are known binaries, which we do not use. Pont et al. (1997) apply an average binary correction of mag to the 6 binaries in their total sample. The Poisson (root ) noise in this correction is mag. If one has a large sample of binaries (), then the approach taken by Pont et al. (1997) to include average binary corrections is sound. However, given that the small number statistics in the present sample results in a very large error in the binary correction, we believe it is best not to use the binaries.
Theoretical models predict that the location of the ZAMS is a sensitive function of metallicity. Even with the Hipparcos data, the current observations are not accurate (or numerous) enough to empirically derive the ZAMS location as a function of metallicity. There are only four subdwarfs whose absolute magnitudes are known to within mag. Unfortunately, the colors predicted by the models are still rather uncertain, and so we do not have a reliable calibration of how the location of the ZAMS changes as a function of metallicity. Thus one should ensure that the mean metallicity of subdwarf sample used in the main sequence fitting should be as close as possible to the metallicity of the GC. This requires accurate metallicity determinations.
We have searched the literature for abundance analyses, based upon high dispersion, high signal to noise spectrum. King (1997) has performed a detailed abundance analysis of HD 134439 and HD 134440 (a common proper motion pair). Rather surprisingly, King finds that the abundances of the -capture elements are consistently some dex below the vast majority of metal-poor field stars, and those observed in GC giant stars. Due to their relatively high abundance, theoretical models predict that the -capture elements play an important role in determining the position of a star in the color magnitude diagram. Given the peculiar abundances in these two stars, we have elected not to use them in main sequence fitting. The calibrating subdwarf data for the remaining 8 stars is presented in Table 2. Most of the data in Table 2 has been taken from the Hipparcos catalogue. The reddening estimates are from Carney et al. (1994) when available, or Pont et al. (1997). The values are discussed in detail below.
The abundance of HD 193901 has been determined by a number of groups. Recent values of are (Carretta & Gratton (1997)), (Axer et al. (1994)) and (Tomkin et al. (1992)). The higher abundances derived by Axer et al. (1994) and Gratton et al. (1997) may be largely due to the different effective temperature scales adopted by these authors compared to Tomkin et al. (1992). This is still a matter of active debate, so we have elected to simple average the above values. In our main sequence fitting analysis (§2.3.1 and §2.3.2), we explore the consequences of the various values. HD 145417 has not been extensively studied, and the only spectroscopic metallicity determination is (Gratton et al. (1997)).
Balachandran & Carney (1996) have presented a detailed abundance analysis of HD 103095 (Groombridge 1830), the subdwarf with the best determined absolute magnitude. They found . Other abundances appeared to be typical of metal-poor stars. This is very similar to the value obtained by Gratton et al. (1997) (). The Balachandran & Carney (1996) value is adopted in this work. The abundance of HD 120559 has been determined to be (Axer et al. (1994)). Tomkin et al. (1992) have found for HD 126681.
The metallicity of BD+59 2407 is (Gratton et al. (1997)) based on high signal to nose data. Carney et al. (1994) found in their low signal to noise data. An examination of the Gratton et al. (1997) and Carney et al. (1994) abundances indicates that the former are systematically more metal-rich than the later. Gratton et al. (1997) found that on average, their values were +0.34 dex more metal rich than Tomkin et al. (1992). Once again, part of this difference is attributable to the different effective temperature scales. We have again elected to adopt the average value , and will discuss the different scales in §2.3.1 and §2.3.2.
A detailed abundance analysis of HD 25329 has been presented by Beveridge & Sneden (1994). They found , while Gratton et al. (1997) report . Beveridge & Sneden (1994) note that HD 25329 is a N-enhanced star; only of observed halo dwarfs are N-enhanced. However, they find that the relative abundances of -capture and iron peak elements are normal for metal-poor stars. Nitrogen comprises only of the mass fraction of the heavy elements in a star. Thus, the fact that HD 25329 is N-enhanced is unlikely to affect its position on the color magnitude diagram, and so it will be used in the main sequence fitting. Taking a simple average of the above two determinations results in .
Finally, CPD-80 349 has (Pont et al. (1997)). This is based on low signal to noise spectra, and is on the same system as Carney et al. (1994). This is apparently the most metal-poor star in the Hipparcos catalogue (see Figure 1), and an improved abundance determination would be of great benefit. This star has (Pont et al. (1997)). Given the poor quality of the abundance determination, and the fact that it is difficult to determine the reddening for a single star, we have elected not to use CPD-80 349 in our main sequence fits.
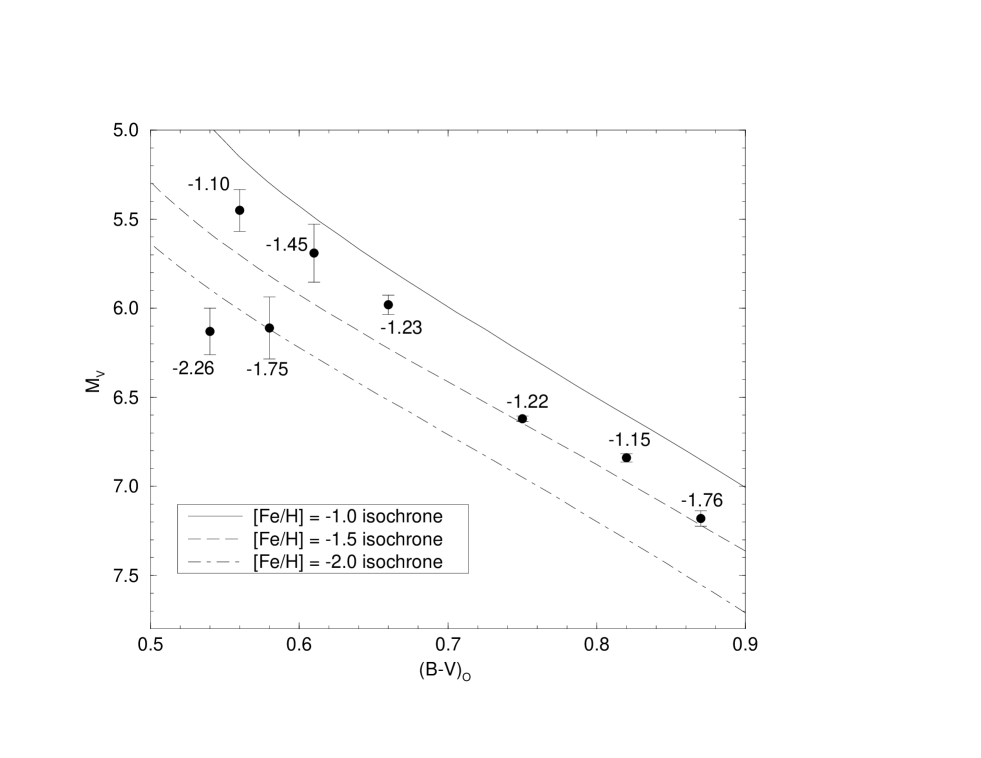
Figure 1 presents the HR diagram for the calibrating subdwarf data, along with a comparison with our standard isochrones. Most of the stars have metallicities in the range to and provide a nice calibration of the ZAMS in this range. The position of HD 25329 () is somewhat surprising, as it lies along the same isochrone as HD 103095 (). Both of these stars have very well determined metallicities and parallaxes. Note that BD+59 2407 () does not lie along the same isochrone as HD 25329. This could be due to an error in the reddening or parallax of BD+59 2407. Alternatively, it suggests that HD 25329 is anomalously bright for its metallicity and color. Clearly more data is needed to differentiate between these hypothesis. Unfortunately, an inspection of the Hipparcos catalogue reveals there are no candidate metal-poor, unevolved single stars with which are likely to have .
Given the values of the calibrating subdwarfs, accurate GC distances using main sequence fitting can be obtained for GC with . To perform main sequence fitting, accurate photometry well below the main sequence turn-off is required. In addition, the cluster value must be well determined. Given these restrictions, accurate main sequence fitting distances can only be determined to three globular clusters M5, M13 and NGC 6752. NGC 288 and 362 are not included, as moderate resolution spectra of a few cluster giants yield values which are considerably different (Carretta & Gratton (1997)) from the Zinn & West (1984) values. Higher dispersion spectra of a number of stars in each cluster are required to determine accurate abundances for these two clusters. Our approach to subdwarf fitting differs significantly from that adopted by Reid (1997), Gratton et al. (1997) and Pont et al. (1997) in that (a) we do not use binary, evolved or chemically peculiar subdwarfs and (2) we do not make theoretical ‘color’ corrections to the subdwarf data to account for metallicity differences between the GC and subdwarfs, but ensure that the mean metallicity of the subdwarf sample is nearly identical to the GC. The subdwarf fitting results for each of the three clusters (NGC 6752, M5, M13) are discussed in turn.
2.3.1 NGC 6752
High resolution spectra of three giants yields (Minniti et al. (1993)), while the six giants studied by Norris & Da Costa (1995) yield . Carretta & Gratton (1997) obtained data for 4 other giants, and re-analyzed the above data to obtain . Averaging these three abundance determinations, we adopt . The reddening is , as discussed in §2.2. Subdwarfs with were used in the weighted, least squares fit. The mean abundance of these subdwarfs (using the same weighted as in the least squares fit to the NGC 6752 fiducial) is , very similar to our adopted abundance of NGC 6752.
The distance to NGC 6752 was determined using a weighted least squares fit to the deep photometry of this cluster as presented by Penny & Dickens (1986). The weights for the fit were the errors in the absolute magnitudes of the subdwarfs (, presented in Table 2). These absolute magnitude errors only include the parallax errors. To allow for errors in the photometry, an error of mag was added in quadrature with the tabulated in Table 2 when performing the fit. The resultant distance modulus is mag, where this error represents the error associated with the weighted least squares fit of the NGC 6752 fiducial to the subdwarf data. To this error, one must add in errors associated with the reddening, and allow for possible metallicity errors. An uncertainty in the reddening of translates into an error in the derived distance modulus of .
Due to the possible systematic uncertainties in the metallicity abundances of the subdwarfs and NGC 6752 we have examined various possibilities, in order to determine how a possible mis-match between the metallicity of NGC 6752 and the calibrating subdwarfs might affect the distance modulus estimates.
-
1.
Adopting the Carretta & Gratton (1997) abundance for NGC 6752 (), and using subdwarfs with . The weight of HD 103095 in the fit was decreased by increasing its error to , ensuring that the mean weighted mean metallicity of the 5 calibrating subdwarfs was . The resultant distance modulus is mag.
-
2.
Adopting the Carretta & Gratton (1997) abundance for NGC 6752 along with the Gratton et al. (1997) and Axer et al. (1994) abundances for the subdwarfs. This was done as the Axer et al. (1994) and Gratton et al. (1997) subdwarf abundances are systematically more metal-rich than other determinations. HD 126681 does not have an abundance determinations by Gratton et al. (1997) or Axer et al. (1994) and was removed from the list. The 3 stars with were used in the fit (HD 103095, 25329 and BD+59 2407). Once again, the weight of HD 103095 in the fit was decreased by increasing its error to , ensuring that the mean weighted mean metallicity of the calibrating subdwarfs was . The resultant distance modulus is mag.
-
3.
Assuming that a systematic zero-point error ( dex) exists between the subdwarf determinations and NGC 6752 implying that NGC 6752 has a metallicity of (in the subdwarf system). This results in the use of 3 stars with , and decreasing the weight of HD 25329 in the fit by increasing its error to mag. The derived distance modulus is mag.
-
4.
Assuming that a systematic zero-point error ( dex) exists between the subdwarf determinations and NGC 6752 implying that NGC 6752 has a metallicity of (in the subdwarf system). The three subdwarfs with with equal weighting (implying a mean ) were used in the fit. The resultant distance modulus is mag.
-
5.
Assuming the anomalous position of HD 25329 in the Figure 1 is due to an incorrect abundance determination, and so removing HD 25329 from the fit. The three subdwarfs with were used in the fit, and the error in HD 120559 was increased to so that the weighted mean subdwarf was . The derived distance modulus is mag.
-
6.
Assuming that the determination of BD+59 2407 is in error, and removing it from the fit. This results in the use of the three subdwarfs with and a distance modulus of mag.
The maximum change in the derived distance modulus is mag, which we take to be the 1- error in the distance modulus due to possible metallicity errors. Adding the metallicity, reddening and fitting errors together in quadrature yields a distance modulus of . As discussed in §2.2, , and so from the subdwarf distance modulus. This subdwarf visual distance modulus corresponds to (with ), which is within 1- of the distance obtained from the white dwarfs (Renzini et al. (1996)).
2.3.2 M5
High dispersion spectroscopic analysis indicates that this cluster has (Sneden et al. (1992)). The reddening is , as summarized by Reid (1997). A deep color magnitude diagram for this cluster has been presented by Sandquist et al. (1996). Subdwarfs with were used in the weighted, least squares fit. The weighted mean abundance of these subdwarfs , very similar to our adopted abundance of NGC 6752. Subdwarf fitting yields a distance modulus of . To this error, one must add in errors associated with the reddening, and allow for possible metallicity errors. An uncertainty in the reddening of translates into an error in the derived distance modulus of .
Due to the possible systematic uncertainties in the metallicity abundances of the subdwarfs and M5, we have once again examined examined the effects that various scenarios for metallicity errors have on the derived distance modulus.
- 1.
-
2.
Assuming that a systematic zero-point error (+0.20 dex) exists between the subdwarf determinations and M5 implying that M5 has a metallicity of (in the subdwarf system). This results in the use of 5 stars with , and decreasing the weight of HD 103095 in the fit by increasing its error to mag. The derived distance modulus is mag.
-
3.
Assuming that the value for HD 103095 is in error, and so removing it from the fit. This results in the use of three subdwarfs ( and mag.
-
4.
Removing HD 193901 from the fit (leaving HD 103095, 120559 and 145417 with a mean metallicity of ). The resultant distance modulus is mag.
-
5.
Removing HD 145417 from the fit, and giving equal weight to the remaining three stars (HD 103095, 120559 and 193901) to ensure a mean . The derived distance modulus is mag.
-
6.
Only using HD 145417 () in the fit, resulting in mag.
The maximum change in the derived distance modulus is mag, which we take to be the 1- error in the distance modulus due to possible metallicity errors. Adding the metallicity, reddening and fitting errors together in quadrature yields a distance modulus of . Utilizing (Reid (1996)), results in .
2.3.3 M13
High dispersion spectroscopic analysis indicates that this cluster has (Kraft et al. (1997)). The reddening is (Zinn & West (1984)). A deep color magnitude diagram and fiducial has been obtained by Richer & Fahlman (1986). This is a somewhat difficult metallicity to deal with, as none of the calibrating subdwarfs has a metallicity near . We have explored a number of possible options for a subdwarf sample selection.
-
1.
Utilizing the subdwarfs with , results in a weighted mean for the subdwarfs and is obtained from a weighted fit to the fiducial.
-
2.
The subdwarf range is restricted to and the stars are equally weighted (resulting in a mean ) then the derived distance modulus is
-
3.
A systematic offset error of dex is assumed between the subdwarfs and M13, implying that M13 has in the subdwarf system. In this case, only the two stars with and are used, resulting in
-
4.
A systematic offset error of dex is assumed between the subdwarfs and M13, implying that M13 has in the subdwarf system. In this case subdwarfs with are used, and the weight of HD 103095 in the fit is decreased by increasing its error to (to ensure a subdwarf mean ). The derived distance modulus is
The derived distance moduli vary from 14.39 – 14.54. We have elected to adopt the mid-point as our best value, and utilize a generous 1- error of , hence . Adding in quadrature the error due to reddening, a total distance modulus error of is adopted. M13 has a very blue HB, so the determination of V(HB) is difficult. We adopt (Chaboyer et al. 1996c ), implying .
2.4 Calibration of via the LMC
Walker (1992) determined the mean magnitudes of a number of RR Lyr stars in several LMC clusters. Adopting a distance modulus to the LMC of , he found . This distance modulus was based upon the traditional calibration of Cepheids. Using Hipparcos based parallaxes, Feast & Catchpole (1997) derived . This distance relied upon a period-color relation, and parallaxes of rather low quality (). An analysis of the Hipparcos Cepheid data by Madore & Freedman (1997) yields who noted that “other effects on the Cepheid PL relation (e.g. reddenning, metallicity, statistical errors) are as significant as this reassessment of its zero point”. The distance to the LMC may be estimated independent of the Cepheid or RR Lyr222Reid (1997) and Gratton et al. (1997) have made an estimate of the LMC distance using his subdwarf fitting based on Hipparcos parallaxes, of and . However, this is based in part on subdwarf fitting to M92 (). All of the subdwarfs are either (a) evolved off the ZAMS, or (b) suspected/known binaries, or (c) have poor determinations. from geometric considerations using the ‘light echo’ times to the ring around SN 1987A (Panagia et al. (1991), Gould (1995)). Using the same data set, but independent analysis, the SN1987A ring distance has been re-calculated by a few groups. Sonneborn et al. (1997) found , while Gould & Uza (1997) determined . Recently, Lundquist & Sonneborn (1997) reported a lower limit of . In light of these contradictory results, we have elected to follow the conclusion of Madore & Freedman (1997) and adopt a distance modulus of mag for the LMC, and assume an uncertainty to fully encompass the range of recently published values. Adopting this distance modulus, along with the photometry of Walker (1992) yields at .
2.5 Theoretical HB models
Continued advances in our understanding in the basic physics which governs stellar evolution have lead to ever more reliable theoretical HB models. Recently, Demarque et al. (1997) have constructed synthetic HB models for various clusters, based upon new evolutionary models for HB stars. Assuming a primordial helium abundance of 0.23, these models predict for M92 () and for M15 (). These two clusters are among the 17 old clusters whose mean age is determined in §4. Taking a simple average of the above two numbers yields at . Also, since the primordial helium value utilized in this analysis was on the low side, we have adjusted this mean value to 0.36 to account for a mean primordial helium value of 0.235. We also adopt an error of 0.10 mag on , to allow for possible errors in the models and in the primordial helium abundance estimate.
2.6 Combining the Distance Estimates
The individual determinations of at the various metallicities are summarized in Table 3. While it is not evident from this table, there is considerable evidence from other observations and theoretical modeling that is a function of :
| (1) |
We have chosen distance calibrations which yield reliable absolute numbers with the minimum possible systematic uncertainties333In contrast to Paper I , we have elected not to include the statistical parallax results of Layden et al. (1996). This technique yields a reliable estimate of for field RR Lyr stars. However, we now recognize that this number may be biased compared to globular cluster RR Lyr stars. Field RR Lyr stars are preferentially found in places where the evolutionary time-scales are long (ie: near the zero-age horizontal branch). No such selection effect exists for cluster RR Lyr stars, so one would suspect that the typical cluster RR Lyr stars would be more evolved, and hence, brighter than the typical field RR Lyr star. Indeed, the statistical parallax results lead to , which is 0.2 mag fainter than what we determine for cluster RR Lyr stars. Hence, they are useful in deriving the value of . However, these determinations do not provide reliable information on the - slope . For this, one needs to utilize techniques which yield reliable relative values as a function of . Theoretical HB models, as well as Baade-Wesselink studies of field RR Lyr stars provide the best estimate of the - relationship444 The synthetic HB models confirm the earlier result of Lee (1991) that Mv(RR) depends both on [Fe/H] and HB morphology, a plausible explanation for the different slopes derived by different authors. For example, if one chooses the same group of globular clusters as Gratton et al. (1997), who derived a slope of by fitting Hipparcos subdwarfs to globular cluster main sequences, the theoretical models yield a slope near 0.25. The theoretical ZAMS slope is 0.20. Note that the models show that the evolutionary correction from the ZAMS used by Carney et al. (1992) should be used with caution, as it clearly does not apply to the more extreme HB morphologies observed in the oldest clusters. The semi-empirical Baade-Wesselink method has been applied by Jones et al. (1992) and Skillen et al. (1993). Reanalysis of these data suggest that (Sarajedini et al. (1997)). The latest theoretical models of blue HB clusters yield slopes of (Demarque et al. (1997)). A weighted mean value of was adopted. The third column in Table 3 lists the various values of implied by the individual determinations of . There is a considerable spread in these values (0.21 to 0.52), reinforcing the notion that the dominant uncertainty remains systematic and that our previous procedure of assigning a Gaussian uncertainty to this quantity was ill-advised. We have thus now chosen to utilize a uniform top-hat uniform distribution which evenly weights all values in the range 0.21 to 0.52. However to give some emphasis to the mean value of the measured data, we have added to this distribution a Gaussian distribution centered on the weighted mean of with an uncertainty of 0.08, doubling the calculated error in the mean to account for the average deviation from the mean. Note that this new mean value is 0.21 mag (more than ) below the value adopted in Paper I . This will lead to a considerably downward revision in our GC age estimates, which we believe will also now have a distribution which is more appropriate to the systematic nature of the existing uncertainties. (We emphasize once again that while the Hipparcos data provided a motivation for re-examining this value, all of the other distance estimators we have examined apear now to be consistent, within the systematic uncertainties quoted, with a much lower value than we previously adopted.)
Spectroscopic studies of blue horizontal-branch (BHB) stars provide further support for the longer GC distance scale adopted here. From both the continuous spectrum and absorption line profiles, it is possible, with the help of model stellar atmospheres, to derive the effective temperature and surface gravities of these stars. This combined information yields the mass-to-light ratio M/L of the star, and if its distance is also known, its mass. This method has in the past yielded masses incompatible with the standard HB evolution theory (masses lower than evolutionary models)(de Boer et al. (1995); Moehler et al. (1995),1997). A recent attempt to rederive the distances of some field BHB stars using Hipparcos parallaxes, could not be given much weight in view of the smallness of the parallaxes (de Boer et al. (1997)). Using Reid’s (1997) reanalysis of the distances to some globular clusters based on larger Hipparcos subdwarf parallaxes, Heber et al. (1997) have reconsidered this problem, and concluded that the higher luminosities for BHB stars now yield masses in better agreement with the evolutionary masses. This important result provides independent support, based on physical modeling, for revising upward the distance scale to globular clusters, as suggested by several lines of reasoning, including the Hipparcos parallax data.
Finally, we should point out that the new distance scale yields a poor fit to calculated isochrones near the cluster turnoff. This suggests that the stellar model radii may need revision (better stellar atmospheres and convection modeling). Improvements in atmosphere models may lead to revisions of the to color transformations, particularly for the most metal poor stars. Since the method is little affected by surface effects, it further justifies our preference for this approach over the approach, and the approach of fitting to the shapes of theoretical isochrone turnoffs, both of which are sensitively affected by atmosphere and outer envelope physics.
3 The Monte Carlo Variables
In order to access the range of error associated with stellar evolution calculations and age determinations, the various inputs into the stellar evolution codes were varied within their uncertainties. In this Monte Carlo analysis, the input parameters were selected randomly from a given distribution. The distributions are based on a careful analysis of the recent literature, as summarized in Paper I . As ages will be derived using most attention was paid to parameters which could effect the age- relationship. Table 4 provides an outline of the various input parameters and their distribution. If the distribution is given as statistical (stat.), then the parameter in question was drawn from a Gaussian with the stated . If the error was determined to be a possible systematic (syst.) one, then the parameter was drawn from a top-hat (uniform) distribution. In total, 1000 independent sets of isochrones were calculated. Each set of isochrones consisted of three different metallicities ( and ) at 15 different ages ( Gyr) (see Paper I for further details).
4 Results
4.1 The Technique
The absolute magnitude of the main sequence turn-off is the favored age determination technique when absolute stellar ages are of interest (see discussion in Paper I ). Turn-off luminosity ages can be determined independent of reddening by using the difference in magnitude between the main sequence turn-off and the HB, . Each set of Monte Carlo isochrones provides an independent calibration of as a function of age. This was combined with the calibration discussed in §2 to determine a grid of predicted values as a function of age and which is then fit to an equation of the form
| (2) |
where is the age in Gyr. The observed values of and , along with their corresponding errors, are input in (2) to determine the age and its error for each GC in our sample.
The age determination for any individual globular cluster has a large uncertainty, due to the large observational errors in (TO). This error is minimized by determining the mean age of a number of globular clusters. However, there is a significant age range among the globular clusters (e.g. Sarajedini & Demarque (1990), VandenBerg et al. (1990),Buonanno et al. 1994b , Chaboyer et al. 1996c ). This problem was avoided by selecting a sample of globular clusters which are well observed, metal-poor (), and which are not known to be young (based on HB morphology and/or the difference in color between the turn-off and giant branch). In the tabulation of Chaboyer et al. 1996c , 17 GCs satisfy the above criteria: NGC 1904, 2298, 5024, 5053, 5466, 5897, 6101, 6205, 6254, 6341, 6397, 6535, 6809, 7078, 7099, 7492, and Terzan 8. The observational data for each cluster was taken from Chaboyer et al. 1996c . The mean (and median) metallicity of this sample is .
4.2 A Likelihood Distribution for the Age of the Oldest Globular Clusters
To derive our best estimate for the age, and uncertainty in the age of the oldest GCs, a mean age and uncertainty in the mean was determined for each set of isochrones, and a given value of . The value of was taken to be a random variable, weighted as described earlier (a top hat distribution between 0.21 and 0.52 superimposed on a Gaussian distribution with mean and uncertainty ), and the sets of isochrones were sampled with replacement 12,000 times. For each sample, we recorded a random age drawn from a Gaussian distribution with the mean age and variance for that isochrone set at that value of .
The age data were sorted and binned, to produce the histogram shown in Figure 2. The median and mean age is 11.5 Gyr, with a standard deviation of 1.3 Gyr. The 1-sided, 95% lower confidence limit is 9.5 Gyr, and is believed to represent a robust lower limit to the age of the GCs, and more properly takes into account the residual systematic uncertainties in , which largely determine the width of the derived age distribution. We are fully aware that due to our revision of the zero-point, these ages are considerably reduced compared to the ages given in Paper I . Indeed, our new mean age is below our previous claimed lower limit which was based on the assumption of Gaussian uncertainty in . In any case, our new results considerably alter the constraints one can derive on cosmological models (see §5).
Even though we have considered four independent distance determinations in addition to the Hipparcos parallaxes, our age estimate is in good agreement with two recent works which relied solely on Hipparcos parallaxes to determine the distances (and hence, ages) to a number of GCs (Reid (1997); Gratton et al. (1997)). Pont et al. (1997) have determined an age of 14 Gyr for M92, which is in disagreement with our work. Pont et al. (1997) made a new fit of the CMD of M92 to theoretical isochrones, based on the Hipparcos subdwarf data. This paper represents a comprehensive analysis of the available data, and attempts the difficult task of correcting for selection effects which are more relevant in this case than the classical Lutz & Kelker (1973) corrections. However, our own analysis suggests that they have overestimated the corrections to the Hipparcos parallaxes due to biases (see Appendix). Their corrections due to the presence of binaries is very uncertain (mag); a fact which was not considered by Pont et al. (1997) in their analysis. A better procedure, which is not to include the suspected binaries in the fit, yields a larger distance modulus for M92. This approach, as pointed out by Pont et al. (1997) yields mag. With this distance modulus, and the photometry of Stetson & Harris (1988) (the same photometry used by Pont et al. (1997)), we calculate that the absolute magnitude of the point on the subgiant branch which is 0.05 mag redder than the turn-off is mag. This point is an excellant diagnostic of the absolute age of M92 (Chaboyer et al. 1996b ), and using our isochrones (as outlined in §4.5) results in an age for M92 of Gyr. This is in good agreement with our estimate for the mean age of the oldest GCs (which includes M92) given above.
In the final analysis, the Pont et al. (1997) paper puts most of the weight of their fit on the agreement between the shapes of the theoretical isochrones and the data near the turnoff. However, this optimistic assessment of the models does not seem warranted in view of the well-known uncertainties associated with the treatment of convection, and the neglect of diffusion in the isochrones used (helioseismoly has taught us that diffusion must be taken into account in the Sun (Basu et al. (1996), Guenther & Demarque (1997)). The need to apply an arbitrary color shift to the VandenBerg et al. (1997) isochrones to reproduce the observed colors of M92, is another indication of the uncertainties involved, and lends further support to the choice of the method in dating globular clusters. We conclude that taking into account the differences in adopted distance moduli, and the neglect of diffusion by VandenBerg et al. (1997), our age estimate for M92, which is Gyr, is in good agreement with the Hipparcos data presented by Pont et al. (1997).
4.3 Effect of on the age estimate
As was emphasized in Paper I (and by other authors), the principal uncertainty in absolute GC age determinations is the distance scale. With the age determination technique, this translates into the uncertainty in . We explicitly display this effect in Figure 3, where the GC ages are plotted as a function of . In order to quantify this uncertainty, median and points were determined as a function of . These were obtained by sorting the data based on , and then binning the ages as a function of . Sixty bins (corresponding to 200 ages per bin) were used, and in each bin the median age, and (68% range) ages were determined. An inspection of these points revealed that a simple linear relationship existed when one used the log of the age. A linear function of the form was fitted to this data, and the coefficients of this fit are given in the figure caption.
The median and fits are extremely useful summaries of our result. For example, at , the median fit yields 11.7 Gyr, identical to that given by the entire distribution (Fig. 2). The fits yield ages of 12.6 and 11.0 Gyr. Thus, if was known to be exactly 0.40, then the error in the age of the oldest GCs would be Gyr, due solely to the residual theoretical uncertainties in the stellar evolution calculations. The median and fits we present here may be used to update our age estimate as further data are obtained. For example, if then from the fits, the median age would be Gyr, with an error of Gyr due to the theoretical uncertainties aside from those associated with . Next, from the median fit, the median age at and may be determined (corresponding to mag) in order to estimate that the uncertainty in age associated with the uncertainty is Gyr. Combining these two error estimates in quadrature ( and ) would result in a best estimate of Gyr for . To verify this result, we have re-run the Monte Carlo analysis with the above choice of and found identical results to those obtained from the median and fits above.
4.4 Effect of the stellar evolution parameters on the age estimate
In order to examine how the individual stellar evolution parameters (given in Table 4) affect the estimated age, the mean age of the 17 GCs was determined for each of the 1000 Monte Carlo isochrones assuming fixed value . In a procedure analogous to that used for the fits, median and fits were determined for each of the 13 continuous variables listed in Table 4. As only 1000 points were available, only 20 bins were used. In addition, it was found that (due to the reduced age range), a linear fit provided as good a description as a log fit. Thus, the median and fits for each parameter , were of the form .
This procedure revealed that several of the input parameters had a negligible effect on the derived ages of the globular clusters. In order of importance, the following parameters were found to impact the GC age estimate: , mixing length, helium abundance, reaction rate, helium diffusion coefficient, and the low temperature opacities. The plots of age as a function of these important parameters are shown in Figures 4 — 9. The figure captions give the coefficients of the median and fits for each of the variables. These fits can be used to update our best estimate for the age of the oldest globular clusters (in a manner analogous to that described for the fits), as improved determinations of the above quantities become available.
In addition to the 13 continuous variables, we considered two binary variables (surface boundary condition, and color table, see Table 4). To examine the effect these parameters have on the derived ages, the ages were divided into 2 groups depending on which surface boundary condition (color table) was used in the stellar evolution codes. Histograms were constructed for each group, and compared. Not surprisingly, we found that the choice of the surface boundary condition had a negligible impact on the derived ages. However, the choice of the color table was important, and the two histograms are plotted in Figure 10. The choice of the color table changes the median age by 0.7 Gyr.
4.5 Calibration of the and age relations
If the distance modulus to some cluster is known, then an accurate absolute age may be determined using or alternatively using (Chaboyer et al. 1996b ). This later point is defined to be the point on the subgiant branch which is 0.05 mag redder (in B—V) than the turn-off. As we have discussed, this point is easy to measure on an observed color magnitude diagram, yet has similar theoretical uncertainties to (Chaboyer et al. 1996b ). As a result, the precision in age estimation for individual clusters is better using . The Monte Carlo isochrones may be used to quantify the error associated with an age determined via either method. To facilitate such error estimates, we have calculated the median and () points as a function of age (in a manner similar to that described in the previous subsection) for four values of : and . For ages between 8 and 17 Gyr, these points were then fit to a function of the form
| (3) |
where was chosen to be either or . The coefficients of the median and fits, for both and are given in Table 5.
The use of these fits for determining ages via is illustrated for NGC 6752. Averaging the white dwarf distance modulus (§2.2) and the subdwarf main sequence fitting modulus (§2.3.1) results in , or . Using the photometry of Penny & Dickens (1986), we find , so that . Recall that (§2.3.1). Using the coefficients of the fits in Table 1, this corresponds to an age of Gyr if and were known exactly. The effects of the and errors may be taken into account by using the median fit, and calculating ages for the values for and . This procedure results in estimated errors of Gyr due to the error (mag) and Gyr due to the error of dex. Adding all three errors together in quadrature yields an age of Gyr for NGC 6752. This intermediate metallicity cluster has an age quite similar to the mean age of the 17 metal-poor clusters (Gyr) determined in §4.2. More important, note that the uncertainty on the age of NGC 6752 determined in this way is comparable to the uncertainty in the mean of the set of 17 old globular clusters, illustrating the potential power of the method based on .
Similarly, for M5, we calculate using the photometry of Sandquist et al. (1996). With (§2.3.2), this results in . Assuming (Sneden et al. (1992)), and using the technique outlined for NGC 6752, an age of Gyr is derived. Finally, for M13 with and (§2.3.3) we find using the photometry555The deep photometry of Richer & Fahlman (1986) used in the main sequence fitting (§2.3.3) contains very few subgiant stars, and so does not lead to a precise V(BTO) value. The photometry of VandenBerg et al. (1990) used here appears to be on the same system as the Richer & Fahlman (1986) photometry. of VandenBerg et al. (1990), resulting in and an age of Gyr. Our results for the distances and ages of these three clusters are summarized in Table 6.
5 Summary
Our new work has two primary results. First, we have updated the absolute age estimate, and quantified the uncertainty in this estimate for the oldest globular cluster mean age. This update is primarily due to a reanalysis of estimates for the quantity which dominates the age uncertainty: (the distance scale to GCs). We have concentrated on exploring in detail different estimates in order to account for the mean value, and the distribution in the uncertainty of this quantity. We find that all the data, not merely the recent Hipparcos parallax measurements, suggests a large systematic shift in of approximately magnitudes compared to earlier estimates. This has the effect of reducing the mean age of the oldest globular clusters by almost 3 Gyr. At the same time, this new data makes it clearer that residual uncertainties are primarily systematic, reminding us that even apparently gaussianly distributed measurements in astrophysics may be subject to large systematic shifts. As a result, we now incorporate a large systematic uncertainty in the claimed mean value of in our estimates.
Next, we provide a formalism which may be used by other researchers to update the estimates given here as new data emerges. In particular, we have presented an explicit discussion of the effect of other input parameter uncertainties from stellar evolution theory on the inferred GC ages estimates. We have displayed these effects in Figures 2-9, and provided analytical fits for both median ages, and uncertainties in age as a function of these parameters, and also as a function of .
We have also explicitly provided the fit for individual globular cluster ages and uncertainties as a function of metallicity and turn-off magnitude, using both the and schemes. This should allow one to derive the age, and uncertainty in age for any GC with . We have illustrated this scheme, for the method for NGC 6752, using the average distance modulus from white dwarf sequence fitting, and subdwarf main sequence fitting, yielding an age of Gyr, illustrating that the method in principle allows an age precision on individual GC age determinations comparable to the method applied to the ensemble of 17 old Globular clusters used in our analysis.
Finally, we briefly comment here on the cosmological implications of our central result that the mean of 17 old, metal-poor GC is Gyr, with a one-sided, 95% confidence level lower bound of 9.5 Gyr (see Krauss (1997) for further details). First and foremost, this results suggests that the long-standing conflict between the Hubble age, and GC age estimates for a flat matter dominated universe is now resolved for a realistic range of Hubble constants. A flat universe has an age which exceeds our lower limit on the GC ages for a Hubble constant , which is well within the range of current measured values. Thus, it now appears that the “age problem” is now no longer the primary motivation for considering a non-zero cosmological constant in the universe (i.e. Krauss and Turner (1995)), and requires an alteration in the arguments associated with the debate between an open, flat matter dominated, and flat cosmological constant cosmologies (Krauss (1997)).
If measurements of the Hubble constant continue to converge on the range , as suggested by the most recent analyses, cosmological concordance, at least as far as age is concerned, will perhaps for the first time be possible in all three scenarios.
Acknowledgements.
We would like to thank Bill van Altena, Sidney van den Bergh and the anonymous referee whose comments have significantly improved the final product as presented here. This research has made use of the SIMBAD database, operated at CDS, Strasbourg, France and data obtained from the ESA Hipparcos Astrometry Satellite. BC was supported for this work by NASA through Hubble Fellowship grant number HF–01080.01–96A awarded by the Space Telescope Science Institute, which is operated by the Association of Universities for Research in Astronomy, Inc., for NASA under contract NAS 5–26555. LMK was supported in part by funds from CERN, CWRU, and a grant from the DOE.Appendix A Potential Biases in the Subdwarf Sample
The parallaxes and absolute magnitudes for the stars listed in Table 2 do not include any statistical correction for possible biases in the sample. There are a few sources of potential biases in the sample. The classical Lutz & Kelker (1973) correction is a statistical correction which takes into account systematic effects due to the fact that (a) stars with parallaxes measured too high have a higher probability of being included in the sample than those with parallaxes measured too low (due to our selection criterion), and (b) more weight is given to stars with parallaxes that are overestimated rather than to stars with underestimated parallaxes (due to our use of a weighted least squares fit). In addition to this, Pont et al. (1997) point out that the since metal-poor stars are far less numerous than more metal-rich stars, there may be an average underestimation of in the sample. The importance of these biases will depend on the selection criterion which are used to select the subdwarfs used in the main sequence fitting. The 3 papers which have used Hipparcos subdwarf parallaxes to determine GC distances have all had different selection criterion, and have determined different bias corrections. In their study, Pont et al. (1997) determined that the unevolved subdwarfs had a mean bias of mag. In contrast, Gratton et al. (1997) determined a bias correction of mag. Reid (1997) whose subdwarf sample consisted of high proper motion stars, elected to use individual Lutz-Kelker corrections, whose magnitude depended on the uncertainty in the parallax. In general, the corrections used by Reid (1997) were small, and in the opposite sense to those employed by Pont et al. (1997).
Our subdwarf study differs from the those of Reid (1997), Gratton et al. (1997) and Pont et al. (1997) in that we have access to the entire Hipparcos catalogue. Stars were selected for inclusion in the Hipparcos input catalogue based on a variety of considerations, and so there is no well defined selection criterion for the entire Hipparcos catalogue. Thus, it is difficult to assess the importance of the various biases a priori. For this reason, we have elected to use a stringent selection criterion which minimizes the importance of the Lutz & Kelker (1973) type bias (Brown et al. (1997)). As it turns out, the final sample only contains stars with , strongly suggesting that the stars whose true parallax are systematically smaller than the observed parallax are not preferentially included in our sample.
To study the possible biases which remain in our subdwarf sample, we have constructed a Monte Carlo simulation to generate synthetic data whose properties are known, and compared to ‘observed’ properties which are calculated in the Monte Carlo. This is similar in spirit to the bias studies of Gratton et al. (1997) and Pont et al. (1997). We have attempted to construct a subdwarf data set whose properties and selection biases closely match those in our actual data set. In particular, our subdwarf sample consists of stars with , , and and these facts are incorporated in the Monte Carlo. The Monte Carlo was constructed in the following steps:
-
1.
An intrinsic value (below ) was drawn from one of two probability functions. The first function is that given by the observed distribution in the Carney et al. (1994) study
(A1) This function was chosen as many of the metal-poor stars in the Hipparcos input catalog are in the Carney et al. (1994) catalogue. The second distribution we considered was that given by Pont et al. (1997)
(A2) and represents their approximation to the observed distribution in their sample.
-
2.
An observed value was determined from the intrinsic value by adding a random value which was taken from gaussian distribution with and .
-
3.
The distance was determined assuming a sphere of uniform density and the true parallax was determined, .
-
4.
The absolute magnitude () was determined assuming an Salpeter initial mass function (, with upper and lower mass limits taken to be and ) and a mass luminosity relation taken from our standard isochrones:
(A3) -
5.
The true apparent magnitude was calculated from the absolute magnitude and true parallax .
-
6.
The observed magnitude was calculated from the apparent magnitude assuming gaussian errors with
-
7.
To reproduce the Hipparcos catalogue completeness characteristics, we assumed the catalogue was complete up to and increasingly incomplete fainter than this, with a probability for inclusion of
(A4) where was chosen to be which is valid for the entire Hipparcos catalogue (Pont et al. (1997)), or which is valid for the metal-poor stars in the Carney et al. (1994) catalogue.
-
8.
The observed parallax () was computed from the true parallax assuming gaussian errors with . The value of was taken from a fit to the parallax errors in the Hipparcos catalogue
(A5) in units of mas. The scatter of the parallax errors about the mean value given by equation (A5) was taken into account by adding a random value to which was taken from gaussian distribution with a varying from 0.54 to 1.14 mas between to 12. This derived parallax error will be refered to as . This procedure accurately reproduces the observed parallax errors as a function of apparent magnitude found in Hipparcos catalogue.
-
9.
The observed absolute magnitude was calculated
(A6) -
10.
The simulated data are accepted if (a) , (b) and (c) was below some value. The cuttoff was allowed to vary, so that some runs required (valid for our sample), and others required , the cutoff used by Pont et al. (1997)
A typical simulation contained simulated input stars, of which were accepted. For the data which was accepted, the mean absolute magnitude and biases were calculated. Both the weighted mean, and unweighted mean bias was calculated. As we use weighted fits in the subdwarf fitting analysis, it is the weighted mean bias which is appropriate for our sample. However, Pont et al. (1997) determined an unweighted mean bias, so this quantity was calculated as well in order to compare our results to Pont et al. (1997). The results are summarized in Table 7 for the various cases given above. In all cases, we found that the weighted mean absolute magnitude bias was small. The largest (in absolute value) absolute magnitude weighted bias was mag. This translates into an age reduction of less than 0.1 Gyr. Given the small value of this correction, we have elected not applied it to our subdwarf fitting. Our results are in good agreement with those of Gratton et al. (1997). The unweighted mean absolute magnitude bias is typically a factor of 10 larger than the weighted mean, but is still relatively small (maximum absolute value of mag). In no case did we find a positive absolute magnitude bias (as was found by Pont et al. (1997)).
The weighted mean bias could be as large as dex for stars selected to have . However, we did not use any stars with in our main sequence fitting analysis. Considering the samples with have a metallicity cut at , the weighted mean bias is likely to lie in the range to dex. We believe case B best represents the true subdwarf distribution; it has a weighted mean bias of dex, which (considering the results presented in §2.3.1 to 2.3.3) could result in an absolute magnitude bias correction up to mag. Given the small value of this correction, and the fact that it acts in the opposite sense to the absolute magnitude bias correction determined above, we have elected not to apply it to our main sequence fitting results. Our main sequence fitting results allow for up to a dex systematic error in the subdwarf metallicity scale.
References
- Axer et al. (1994) Axer, M., Fuhrmann, K. & Gehren, T. 1994, A&A, 291, 895
- Bahcall & Pinsonneault (1992) Bahcall, J.N. & Pinsonneault, M.H. 1992, Rev.Mod.Phys., 64, 885
- Bahcall 1989, table 3. (4) Bahcall, J.N. 1989, Neutrino Astrophysics (Cambridge: Cambridge U.P.)
- Balachandran & Carney (1996) Balachandran, S.C. & Carney, B.W. 1996, AJ, 111, 946
- Basu et al. (1996) Basu, S., Christensen-Dalsgaard, J., Schou, J., Thompson, M.J. & Tomczyk, M. 1996, ApJ, 460, 1064
- Beveridge, & Sneden (1994) Beveridge, C.R. & Sneden, C. 1994, AJ, 108, 285
- Brown et al. (1997) Brown, A.G.A., Arenou, F., van Leeuwen, F., Lindegren, L. & Luri, X. 1997, to appear in the proceedings of the Hipparcos Venice ’97 symposium, ESA SP-402 (astro-ph/9707040
- Buonanno et al. (1989) Buonanno, R., Corsi, C. E. & FusiPecci, F. 1989, A&A, 216, 80
- (9) Buonanno, R., Corsi, C. E., Cacciari, C., Ferraro, F.R. & FusiPecci, F. 1994, A&A, 290, 69
- (10) Buonanno, R., Corsi, C. E., Fusi Pecci, F., Fahlman, G.G. & Richer, H.B. 1994, ApJL, 430, L121
- Burnstein & Heiles (1982) Burnstein, D. & Heiles, C. 1982, AJ, 87, 1165
- Carney (1979) Carney, B.W. 1979, AJ, 84, 515
- Carney et al. (1992) Carney, B.W.,Storm,J & Jones,R.V. 1992,ApJ, 386, 663
- Carney et al. (1994) Carney, B.W., Latham, D.W., Laird, J.B. & Aguilar, L.A. 1994, AJ, 107, 2240
- Carretta & Gratton (1997) Carretta, E. & Gratton, R.G. 1997, A&AS, 121, 95
- Cayrel de Strobel et al. (1997) Cayrel de Strobel, G., Soubiran, C., Friel, E.D., Ralite, N. & Francois, P. 1997, A&AS, 124, 1
- Chaboyer (1995) Chaboyer, B. 1995, ApJ, 444, L9
- (18) Chaboyer, B., Demarque, K., Kernan, P.J. & Krauss, L.M. 1996a, Science, 271, 957
- (19) Chaboyer, B., Demarque, K., Kernan, P.J., Krauss, L.M. & Sarajedini, A. 1996b, MNRAS, 283, 683
- (20) Chaboyer, B., Demarque, P. & Sarajedini, A. 1996c, ApJ, 459, 558
- Chaboyer & Kim (1995) Chaboyer, B. & Kim, Y.-C. 1995, ApJ, 454, 767
- Cudworth (1979) Cudworth, K.M. 1979, AJ, 84, 1212
- de Boer et al. (1995) de Boer,K.S.,Schmidt,J.H.K. & Heber,U. 1995,A&A,303,95
- de Boer et al. (1997) de Boer,K.S.,Tuchloke,H.-J. & Schmidt,J.H.K. 1997,A&A,317,L23
- Demarque et al. (1997) Demarque, P., Lee, Y.-W., Yi, S.Y. & Zinn, R.W. 1997, ApJ in preparation
- Feast & Catchpole (1997) Feast, M.W. & Catchpole, R.W., 1997, MNRAS, 286, L1
- Green et al. (1987) Green, E.M., Demarque, P. & King, C.R. 1987, The Revised Yale Isochrones & Luminosity Functions (New Haven: Yale Univ. Obs.)
- Gould (1995) Gould, A. 1995, ApJ, 452, 189
- Gould & Uza (1997) Gould, A. & Uza, O. 1997, ApJ, submitted, astro-ph/9705051
- Gratton et al. (1997) Gratton, R.G., Fusi Pecci, F., Carretta, E., Clementini, G., Corsi, C.E. & Lattanzi, M. 1997, astro-ph/9704150
- Guenther & Demarque (1997) Guenther, D.B. & Demarque, P. 1997, ApJ,484,937
- Heber et al. (1997) Heber,U.,Moehler,S. & Reid,I.N. 1997, Proc. Hipparcos Symposium, Venice, in press
- Jones et al. (1992) Jones, R.V., Carney, B.W., Storm, J. & Latham, D.W. 1992, ApJ, 386, 646
- King (1997) King, J.R. 1997 AJ, 113, 2302
- Kraft et al. (1992) Kraft, R.P., Sneden, C., Langer, G. E. & Prosser, C.F. 1992, AJ, 104, 645
- Kraft et al. (1997) Kraft, R.P., Sneden, C., Smith, G.H., Shetrone, M.D., Langer, G.E. & Pilachowski, C.A. 1997, AJ, 113, 279
- Krauss and Turner (1995) Krauss, L.M., and Turner, M.S., 1995, J. Genl. Rel. Grav., 27, 1135
- Krauss (1997) Krauss, L.M., to appear.
- Krishna-Swamy (1966) Krishna-Swamy, K.S. 1966, ApJ, 145, 176
- Kurucz (1992) Kurucz, R.L. 1992, in IAU Symp. 149, The Stellar Populations of Galaxies, ed. B. Barbuy, A. Renzini, (Dordrecht: Kluwer), 225
- Layden et al. (1996) Layden, A.C., Hanson, R.B., Hawley, S.L, Klemola, A.R. & Hanley, C.J. 1996, AJ, 112, 2110
- Lee (1991) Lee,Y.-W. 1991 ApJ, 373, L43
- Lindegren & Perryman (1996) Lindegren, L. & Perryman, M.A.C. 1996, A&AS, 116, 579
- Lundquist & Sonneborn (1997) Lundquist, P. & Sonneborn, G. 1997, astro-ph/9707144
- Lutz & Kelker (1973) Lutz, T.E. & Kelker, D.H. 1973, PASP, 85, 573
- Madore & Freedman (1997) Madore, B.F. & Freedman, W.L. 1997, ApJL, in press
- Mazzitelli et al. (1995) Mazzitelli, I., D’Antona, F. & Caloi, V. 1995, A&A, 302, 382
- Minniti et al. (1993) Minniti, D., Geisler, D., Peterson, R.C. & Claria, J.J. 1993, ApJ, 413, 548
- Moehler et al. (1995) Moehler, S., Heber, U. & de Boer, K.S. 1995, A&A, 294, 65
- Moehler et al. (1997) Moehler, S., Heber, U. & Rupprecht,E. 1997, A&A, 319, 109
- Nissen et al. (1994) Nissen, P., Gustafsson, B., Edvardsson, B. & Gilmore, G. 1994, A&A, 285, 440
- Norris & Da Costa (1995) Norris, J.E. & Da Costa, G.S. 1995, ApJ, 447, 680
- Panagia et al. (1991) Panagia, N., Gilmozzi, R., Macchetto, F., Adorf, H.-M. & Kirshner, R.P. 1991, ApJ, 380, L23
- Penny & Dickens (1986) Penny, A.J. & Dickens, R.J. 1986, MNRAS, 220, 845
- Perryman et al. (1997) Perryman, M.A.C. et al, The Hipparcos Catalogue, European Space Agency Publication, esa-SP-1200
- Pont et al. (1997) Pont, F. Mayor, M., Turon, C. & VandenBerg, D.A. 1997, A&A, in press
- Rees (1996) Rees, R.F. 1996, in Formation of the Galactic Halo …. Inside and Out, eds. H. Morrison & A. Sarajedini (San Fransico: ASP), 289
- Reid (1996) Reid, I.N. 1996, MNRAS, 278, 367
- Reid (1997) Reid, I.N. 1997, AJ, in press
- Renzini (1991) Renzini, A. 1991, in Observational Tests of Cosmological Inflation, eds. T. Shanks, et al., (Dordrecht: Kluwer), 131
- Renzini et al. (1996) Renzini, A., Bragaglia, A., Ferraro, F.R., Gilmozzi, R., Ortolani, S., Holberg, J.B., Liebert, J., Wesemael, F. & Bohlin, R.C. 1996, ApJ, 465, L23
- Richer & Fahlman (1986) Richer, H.B. & Fahlman, G.G. 1986, ApJ, 304, 273.
- Salaris et al. (1997) Salaris, M., Degl’Innocenti, S. & Weiss, A. 1997, ApJ, 479, in press
- Sandquist et al. (1996) Sandquist, E.L., Bolte, M., Stetson, P.B. & Hesser, J.E. 1996, ApJ, 470, 910
- Sarajedini et al. (1997) Sarajedini, A., Chaboyer, B. & Demarque, P. 1997, PASP, submitted
- Sarajedini & Demarque (1990) Sarajedini, A. & Demarque, P. 1990, ApJ, 365, 219
- Skillen et al. (1993) Skillen, I., Fernley, J.A., Stobie, R.S. & Jameson, R.F. 1993, MNRAS, 265, 30
- Sneden et al. (1991) Sneden, C., Kraft, R.P., Prosser, C.F. & Langer, G. E. 1991, AJ, 102, 2001
- Sneden et al. (1992) Sneden, C., Kraft, R.P., Prosser, C.F. & Langer, G. E. 1992, AJ, 104, 2121
- Stetson & Harris (1988) Stetson, P.B. & Harris, W.E., 1988, AJ, 96, 909
- Sonneborn et al. (1997) Sonneborn, G., Fransson, C., Lundquist, P., Cassatella, A. Gilmozzi, R., Kirshner, R.P., Panagia, N. & Wamsteker, W. 1997, ApJ, 477, 848
- Tomkin et al. (1992) Tomkin, J., Lemke, M., Lambert, D.L. & Sneden, C. 1992, AJ, 104, 1568
- Unwin, Boden & Shao (1996) Unwin, S., Boden, A. & Shao, M. 1996, BAAS, 189, 1210
- VandenBerg et al. (1990) VandenBerg, D.A., Bolte, M. & Stetson, P.B. 1990, AJ, 100, 445
- VandenBerg et al. (1996) VandenBerg, D.A., Bolte, M. & Stetson, P.B. 1996, ARAA, 34, 461
- VandenBerg et al. (1997) VandenBerg, D.A., Swenson, F.J., Rogers,F.J., Iglesias, C.A. & Alexander, D.R. 1997, in preparation
- Walker (1992) Walker, A.R. 1992, ApJ, 390, L81
- Zinn & West (1984) Zinn, R. & West, M. 1984, ApJS, 55, 45
- Zinn (1985) Zinn, R. 1985, ApJ, 293, 424
| Cluster | V(HB) | reference | |||
|---|---|---|---|---|---|
| M5 | 14.44 | Sneden et al. (1992) | |||
| M4 | 11.18 | Zinn & West (1984) | |||
| M22 | 12.17 | Zinn & West (1984) | |||
| M3aaV(HB) from Buonanno et al. 1994a . Adopted reddening of 0.01 from Zinn (1985). | 14.91 | Kraft et al. (1992) | |||
| M13bbV(HB) from Buonanno et al. (1989) | 14.06 | Kraft et al. (1997) | |||
| M92 | 14.76 | Sneden et al. (1991) |
.
| Name | (mas) | ||||||
|---|---|---|---|---|---|---|---|
| HD 193901 | 8.65 | 0.56 | 0.00 | 22.88 | 0.054 | ||
| HD 145417 | 7.53 | 0.82 | 0.00 | 72.75 | 0.011 | ||
| HD 103095 | 6.43 | 0.75 | 0.00 | 109.21 | 0.007 | ||
| HD 120559 | 7.97 | 0.66 | 0.00 | 40.02 | 0.025 | ||
| HD 126681 | 9.28 | 0.61 | 0.00 | 19.16 | 0.075 | ||
| BD+59 2407 | 10.20 | 0.58 | 0.05 | 15.20 | 0.080 | ||
| HD 25329 | 8.51 | 0.87 | 0.00 | 54.14 | 0.020 | ||
| CPD-80 349 | 10.05 | 0.54 | 0.02 | 16.46 | 0.060 |
| at | |||
|---|---|---|---|
| Method | |||
| Astrometric | |||
| White dwarf fitting to N6752 | |||
| Subdwarf fitting to N6752 | |||
| Subdwarf fitting to M5 | |||
| Subdwarf fitting to M13 | |||
| LMC RR Lyr | |||
| Theoretical models |
| Parameter | Distribution | Comment |
|---|---|---|
| mixing length | (stat.) | fits GC observations |
| helium diffusion coefficients | 0.3 – 1.2 (syst.) | possible systematic error dominate |
| high temperature opacities | (stat.) | comparison of OPAL |
| & LAOL opacities | ||
| low temperature opacities | (syst.) | comparison of different tables |
| primordial 4He abundance | (syst.) | possible systematic error dominate |
| oxygen abundance, [O/Fe] | (stat.) | mean from Nissen et al. (1994) |
| (syst.) | ||
| surface boundary condition | grey or Krishna-Swamy (1966) | |
| colour table | Green et al. (1987) or Kurucz (1992) | |
| Nuclear Reaction Rates: | ||
| (stat.) | see Paper I | |
| (syst.) | ||
| (stat.) | Bahcall & Pinsonneault (1992) | |
| (stat.) | Bahcall & Pinsonneault (1992) | |
| (stat.) | Bahcall 1989, table 3. (4) | |
| (stat.) | Bahcall 1989, table 3. (4) | |
| (stat.) | Bahcall 1989, table 3. (4) | |
| (stat.) | Bahcall 1989, table 3. (4) | |
| median | |||||
| median | |||||
| Name | Age (Gyr) | |||
|---|---|---|---|---|
| NGC 6752 | ||||
| M5 | ||||
| M13 |
| weighted mean bias | unweighted mean bias | |||||||
|---|---|---|---|---|---|---|---|---|
| Case | distribution | cut | (mag) | (dex) | (mag) | (dex) | ||
| A | Carney et al. (1994) | 0.10 | 0.15 | |||||
| B | Carney et al. (1994) | 0.15 | 0.15 | |||||
| C | Carney et al. (1994) | 0.20 | 0.15 | |||||
| D | Carney et al. (1994) | 0.10 | 0.60 | |||||
| E | Carney et al. (1994) | 0.20 | 0.60 | |||||
| F | Pont et al. (1997) | 0.15 | 0.15 | |||||
| G | Pont et al. (1997) | 0.20 | 0.15 | |||||
| H | Pont et al. (1997) | 0.20 | 0.60 | |||||
| I | Pont et al. (1997) | 0.15 | 0.60 | |||||
| J | Pont et al. (1997) | 0.20 | 0.60 | |||||