03(11.14.1; 11.19.1; 13.21.1; 13.25.2)
Pedro M. Rodríguez–Pascual 11institutetext: ESA - IUE Observatory, P.O. Box 50727, 28080 Madrid, Spain 22institutetext: LAEFF–INTA, P.O. Box 50727, 28080 Madrid, Spain
The Broad Line Region of Narrow–line Seyfert 1 galaxies
Abstract
We have analyzed new and archival IUE observations of narrow-line Seyfert 1 galaxies (NLS1) in order to revise the ultraviolet (UV) properties of this sub-group of Active Galactic Nuclei (AGN). We have found broad wings in the strongest UV emission lines, ruling out the hypothesis that there is no broad line emission region in this type of objects. Since the similarities in spectral energy distributions from the far-infrared (FIR) to the soft X rays in both narrow-line and broad-line Seyfert 1 galaxies do not suggest that the nuclei of NLS1 are hidden from a direct view, we discuss the possibility that the line emitting material in NLS1 is optically thin.
keywords:
Galaxies: Seyfert – Galaxies: nuclei – Ultraviolet: galaxies – X-rays: galaxies1 Introduction
The class of narrow–line Seyfert 1 (NLS1) galaxies is characterized by the properties of their optical emission lines (Osterbrock & Pogge 1985; Goodrich 1989): the permitted lines are narrower (1 000 km s-1full width at half-maximum, FWHM) than in typical Seyfert 1 galaxies (5 000 km s-1, FWHM), though still slightly broader than the forbidden lines; the [OIII]/H ratio is much smaller than in Seyfert 2; narrow lines of highly ionized atoms are detected; the optical FeII emission is among the strongest detected in active galactic nuclei (AGN).
The radio properties of NLS1 galaxies (Ulvestad, Antonucci & Goodrich 1995) are similar to those found in other Seyfert galaxies. The only exception refers to the orientation of the radio axes with respect to the optical polarization: Mrk 766 and Mrk 1126 are the only two known Seyfert galaxies where the radio axis is perpendicular to the polarization. Spectropolarimetric observations of a sample of 17 NLS1 galaxies (Goodrich 1989) revealed that 6 of them show significant intrinsic polarization.
It has been claimed (Boller et al. 1996 and references therein) that in the ROSAT band, NLS1 show both steeper spectra and stronger variability than typical broad line Seyfert 1 galaxies. Moreover, the soft X-ray variability time scales found in some NLS1 are among the fastest of Seyfert galaxies: the doubling times are shorter than 15000 seconds for 4 out of 30 NLS1. In spite of the different spectral shapes, the soft X–ray luminosities of NLS1 are similar to those of typical broad line Seyfert 1s. At higher energies, only three objects have been reported to be observed so far: IRAS 13224-3809 shows a hard ( 1.3) power law from 2 to 10 keV while below 2 keV the spectrum is dominated by a soft excess (Otani 1995); in contrast, RE 1034+39 shows a very steep spectrum ( 2.6) in the range 2–10 keV (Pounds, Done & Osborne 1995); finally, Leighly et al. (1996) find rapid variations (doubling time scale 1 000 seconds) in the ASCA data (0.4–10.5keV) of Mrk 766. These authors model the combined ROSAT-ASCA spectra of Mrk 766 with a power law, warm absorber and soft excess. With this model, the spectral variability observed can be attributed to changes in the spectral index of the power law and in the ionization degree of the warm absorber.
The narrowness of the optical permitted lines has been interpreted as an orientation effect of a disc shaped BLR (Osterbrock & Pogge 1985; Goodrich 1989; Stephens 1989; Puchnariewitz et al. 1992). If the clouds are confined to move in a plane, the emission lines will be much narrower when viewed from a line of sight nearly perpendicular to the plane. In this pole–on model, the rapid X-ray variability might be understood in terms of relativistic beaming effects if we were looking down an outflow from the central engine. If such beaming effects are not present, a rapid intrinsic variability can only result from a very compact emitting region.
Another possibility, that does not consider orientation effects as playing a major role, is based on the steep spectrum generally observed in the soft X–rays. If it is the high energy tail of the emission from an accretion disc, such “hot” spectrum will be produced when the central black hole has a relatively small mass compared to those in normal Seyfert 1’s (Ross & Fabian 1993). In this scenario, the rapid variability observed in the X–rays would be naturally explained by the smaller dimension of the emitting region. Moreover, if the gravitational force from the central black hole dominates the BLR kinematics, smaller black holes would result in lower cloud velocities, assuming these clouds are kept at distances similar to those in normal Seyfert 1’s. This situation may occur if the larger ionization parameter (the ratio of the density of ionizing photons to hydrogen atoms), implied by the harder accretion disc spectrum, hinders the formation of BLR clouds close to the central source.
It is remarkable that all these hypotheses about the nature of NLS1 are based on the narrowness of the optical permitted lines. However, it is known that the emission lines that better trace the innermost regions of the BLR lie in the UV domain (Peterson 1994, and references therein). Crenshaw et al. (1991) have reported IUE observations of three NLS1 and found that the line ratios are similar to those found in normal Seyfert 1 galaxies, but nothing is mentioned about the line widths.
In the very last years, IUE has observed a number of NLS1 galaxies, increasing noticeably the sample discussed by Crenshaw et al. (1991). Moreover, most of the results on the X-ray properties of NLS1 have come out also in the current decade. Our aim is then to revise the UV properties of NLS1, based on a larger sample than in previous works, and link these properties to those in other spectral ranges in order to constrain the models currently proposed for this sub-class of AGN.
In Sect. 2 we describe the analyzed sample as well as its UV properties. In this section we also combine the continuum measurements with far-infrared (FIR) fluxes and soft X-ray properties from the literature to study the spectral energy distribution of NLS1. The implications of the emission lines analysis on the emitting-gas conditions are discussed in Sect 3 and the main results are finally summarized in Sect. 4.
| Object | Image | Obs. date | Exp. Time |
|---|---|---|---|
| Min. | |||
| MRK 1044 | SWP56260 | 01/12/95 | 568 |
| MRK1044 | SWP56319 | 20/12/95 | 225 |
| KUG 1031+398 | SWP52918 | 27/11/94 | 280 |
| KUG 1031+398 | SWP53041 | 11/12/94 | 310 |
| IRAS13224-3809 | SWP46830 | 27/01/93 | 345 |
| IRAS13224-3809 | SWP46914 | 11/02/93 | 340 |
| IRAS13224-3809 | SWP47720 | 24/05/93 | 395 |
| IRAS13224-3809 | SWP51149 | 21/06/94 | 400 |
| IRAS13224-3809 | SWP54161 | 17/03/95 | 384 |
| IRAS13224-3809 | SWP54216 | 24/03/95 | 369 |
| IRAS13224-3809 | SWP55026 | 17/06/95 | 380 |
| IRAS13224-3809 | SWP56586 | 17/01/96 | 360 |
| IRAS13224-3809 | SWP56631 | 23/01/96 | 357 |
| IRAS13224-3809 | SWP56646 | 29/01/96 | 330 |
| IRAS13224-3809 | SWP56792 | 11/02/96 | 330 |
| Object | Redshift | (100m) | (60m) | (25m) | (12m) | (1450Å) | F(0.1-2.4keV) | |
|---|---|---|---|---|---|---|---|---|
| 10-11 erg cm-2 s-1 | ||||||||
| MRK957 | 0.075 | 9.62 0.96 | 10.47 0.84 | 2.94 0.38 | 4.70 | 0.42 0.10 | 0.36 | 3.00.2 |
| IZW1 | 0.060 | 7.90 0.79 | 11.22 0.90 | 14.53 1.45 | 12.80 1.15 | 3.21 0.19 | 2.51 | 3.00.1 |
| MRK359 | 0.017 | 5.22 0.68 | 5.66 0.40 | 5.25 1.16 | 2.98 0.89 | 2.54 0.12 | 2.95 | 2.40.1 |
| MRK1044 | 0.016 | 2.64 0.45 | 2.15 0.22 | 2.58 0.39 | 2.51 0.63 | 3.84 0.10 | 5.67 | 3.00.1 |
| MRK1239 | 0.019 | 7.24 | 6.68 0.53 | 13.69 0.96 | 16.25 1.79 | 0.24 0.16 | 0.27 | 3.90.3 |
| KUG1031+398 | 0.042 | 1.97 0.41 | 1.74 0.21 | 2.10 | 3.35 0.80 | 0.37 0.10 | 5.16 | 4.40.1 |
| MRK42 | 0.024 | 2.73 | 1.59 0.21 | 1.67 | 2.47 | 0.36 0.09 | 0.52 | 2.70.2 |
| MRK766 | 0.013 | 13.97 0.84 | 20.13 1.41 | 15.54 1.09 | 9.64 0.87 | 0.63 0.08 | 13.25 | 2.70.3 |
| IC3599 | 0.019 | 0.07 | 0.05 | 5.21.5 | ||||
| IRAS1322-380 | 0.067 | 6.08 0.73 | 7.80 0.55 | 3.11 0.50 | 2.88 | 1.35 0.12 | 1.40 | 4.40.2 |
| MRK478 | 0.079 | 2.77 0.33 | 2.85 0.20 | 2.24 0.27 | 3.03 0.73 | 4.15 0.23 | 2.29 | 3.60.1 |
| MRK493 | 0.032 | 3.88 0.47 | 3.47 0.21 | 2.30 0.28 | 2.20 0.46 | 1.56 0.11 | 0.78 | 2.70.2 |
| 1652+396 | 0.069 | 0.10 | 0.37 | 2.70.3 | ||||
| AKN564 | 0.024 | 3.41 0.82 | 4.13 0.37 | 6.78 0.47 | 7.47 | 2.77 0.17 | 9.17 | 3.40.1 |
2 The ultraviolet spectrum of NLS1
2.1 The data
We have cross–correlated the NLS1 sample discussed by Boller et al. (1996) against the IUE database and found that 11 out of 30 NLS1 for which ROSAT data are available, had been observed with the short wavelength spectrograph on IUE. This subsample was increased by our own observations of three more NLS1: IRAS 13224-3809, KUG 1031+398 and Mrk 1044. The log of our IUE observations is shown in Table 1. The whole sample is described in Table 2, where we list the most common object names, the redshifts (from Boller et al. 1996) and some continuum properties as explained below.
The sample discussed hereafter is in no way statistically complete; it includes those galaxies that at some stage have been considered interesting by the scientific community and the IUE time allocation committees.
All the IUE spectra were re-extracted using the Final Archive processing software (Nichols et al. 1993). Foreground galactic reddening has been corrected from the HI column densities map in Dickey & Lockman (1990), converted to according to the relation: . All the spectra have been redshift corrected to get the wavelength and fluxes in the objects rest frames. In order to increase the signal-to-noise ratio, all the spectra of every single object have been averaged together (see Sect. 2.2 for a discussion of their variability properties).
The UV continuum has been measured in a 40 Å band centered at 1450 Å, which is apparently free of absorption and/or emission features. Two (IC3599 and 1652+396) out of the 14 objects were not detected; the signal-to-noise ratio (S/N) is smaller than 10 in the average spectrum of 5 objects. The average fluxes are given in Table 2. In this table we also list the fluxes in the four IRAS bands from the NED database as well as the ROSAT fluxes and spectral slopes reported by Boller et al. (1996).
2.2 Variability
One of the most general properties among normal Seyfert 1 galaxies is the variability in the UV continuum and broad emission lines. The observed UV continuum variations are a few percent on time scales of a day or less and tens of percent on time scales of several days. However, there is not very much information in the literature about optical and/or UV variability in NLS1, although they are probably the AGN’s which show the fastest variations in the soft X rays. Only very recently, a sample of 12 NLS1 has been systematically monitored in order to search for optical variability (Giannuzzo & Stirpe 1996). Ten of these NLS1 showed significant variations in the optical continuum and permitted lines over a time interval of one year.
We have found significant changes in the continuum flux in 2 (Mrk 1044 and IRAS13224-3809) out of the 11 detected objects for which more than one spectrum is available. Mrk 1044 was observed with IUE on December 1 and 20, 1995. Between these two dates, the continuum increased by 38%. Unfortunately, in the first SWP spectrum the peaks of the strongest emission lines (Ly, CIV) were saturated. Nevertheless, neither the weaker lines (SiIV, HeII) nor the wings of Ly and CIV show evidences of variability. For Mrk 1044, Giannuzzo & Stirpe (1996) find variations in the H and H fluxes of –14% and –24% , respectively, between October 1993 and September 1994. They do not report on the continuum variability.
There are 11 SWP spectra of IRAS13224-3809 from January 1993 to February 1996. The variability of the continuum flux during this time is 24% (r.m.s.), with a ratio of the maximum to the minimum flux close to 2. The analysis of the spectra taken during 1993 showed changes in the profile of Ly that could be attributed to a variable narrow absorption (Mas–Hesse et al. 1994). A detailed analysis of the whole data set for this object is deferred to a later paper.
The number of IUE observations for the other NLS1 in the sample is rather small, so that it is not possible to study their variability properties.
In summary, the available data suggest that, in the UV, NLS1 can vary at least as fast as normal Seyfert 1 galaxies on time scales of several days. With the existing IUE data it has not been possible to check whether this class of objects varies faster than normal Seyfert 1s as in the soft X rays.
2.3 The continuum spectral energy distribution: Comparison with normal Seyfert 1 galaxies
| Parameter | NLS1 samplea | Seyfert 1 sampleb | Significancec | |||||||
|---|---|---|---|---|---|---|---|---|---|---|
| N | Mean | S.D. | P(Norm.) | N | Mean | S.D. | P(Norm.) | |||
| L100μm | 10 | 44.41 | 0.65 | 0.381 | 21 | 44.36 | 0.79 | 0.032 | 0.787 | |
| L60μm | 12 | 44.34 | 0.68 | 0.178 | 30 | 44.31 | 0.89 | 0.044 | 0.902 | |
| L25μm | 10 | 44.37 | 0.56 | 0.896 | 26 | 44.45 | 0.89 | 0.814 | 0.248 | |
| L12μm | 8 | 44.24 | 0.65 | 0.716 | 23 | 44.32 | 0.74 | 0.178 | 0.798 | |
| LUV | 12 | 43.74 | 0.77 | 0.839 | 47 | 44.52 | 1.07 | 0.077 | 0.019 | |
| LROSAT | 12 | 43.95 | 0.66 | 0.553 | 53 | 44.42 | 0.93 | 0.188 | 0.106 | |
| (L100μm/L60μm) | 10 | -0.04 | 0.09 | 0.599 | 21 | 0.01 | 0.16 | 0.191 | 0.335 | |
| (L25μm/L60μm) | 10 | -0.07 | 0.26 | 0.858 | 26 | 0.08 | 0.30 | 0.531 | 0.202 | |
| (L12μm/L60μm) | 8 | 0.00 | 0.26 | 0.547 | 23 | 0.14 | 0.33 | 0.670 | 0.312 | |
| (LUV/L60μm ) | 12 | -0.62 | 0.59 | 0.336 | 27 | -0.07 | 0.73 | 0.260 | 0.028 | |
| (LROSAT/L60μm) | 12 | -0.39 | 0.64 | 0.441 | 30 | -0.10 | 0.61 | 0.004 | 0.130 | |
| (LUV/LROSAT) | 12 | -0.23 | 0.52 | 0.013 | 47 | 0.11 | 0.35 | 0.219 | 0.028 | |
| 12 | 3.27 | 0.68 | 0.132 | 53 | 2.44 | 0.47 | 0.690 | 0.001 | ||
a Boller et al. (1996) sample plus our data,(Sect. 2.1)
b Walter & Fink (1993)
c Significance of the Mann-Whitney rank sum test on the hypothesis that the two samples come from the same parent population (Sect. 2.3)

The spectral energy distribution (SED) of normal broad line Seyfert 1 galaxies is dominated by the “big blue” bump (Sanders et al. 1989), extending from 4 000 Å to beyond the shortest observable wavelengths in the UV region ( 1000 Å). How far this bump extends into the extreme ultraviolet (EUV) is not known because of the difficulty of observing extragalactic objects in this spectral region. In this respect, the “soft X-ray excess” found in many AGN is sometimes interpreted as the high energy end of the bump. It is generally thought that the big blue bump is due to the emission of an accretion disk around a super-massive black hole, although there are other alternatives proposed (like free-free emission from optically thin gas clouds or the non-standard model of emission from a powerful starburst). In all these models, the UV emission region would be illuminated by the hard X-ray continuum, as required by the observed properties of the X-ray and the UV spectra, together with their correlated fluctuations.
Many AGN emit similar amounts of energy in the UV-optical and FIR regions. There is growing evidence that the nuclear FIR emission in AGN is due to thermal radiation by dust, although this is still controversial. Moreover, for some objects it has been argued that the FIR emission is not directly related to the active nucleus, but to circumnuclear star forming regions (e.g. Mas–Hesse et al. 1995). The spectral index between 25 and 60 m is a good indicator of the relative contribution of star formation processes to the FIR emission in AGN (Mas–Hesse et al. 1995); steep FIR spectra are typical of star forming regions, while flat FIR spectra indicate the nuclear emission (independently of its nature) dominates.
We have compared the SED of NLS1 with that of normal broad emission line Seyfert 1 galaxies in order to investigate whether the continuum emission is originated by the same mechanisms in both types of objects. The SED (from the far IR, 100 m, to the soft X-rays, 2.4 keV) of our sample of NLS1 galaxies is listed in Table 2. For comparison we have selected the sample from the Walter & Fink (1993) study. These authors analyzed the ROSAT All Sky Survey data of 58 Seyfert 1 galaxies for which IUE spectra are available. To compare the X-ray fluxes in both samples it has been necessary to translate the Boller et al. (1996) 2 keV monochromatic fluxes to integrated fluxes in the 0.1–2.4 keV band, as given by Walter & Fink (1993). The translation has been performed using the soft X-ray spectral indexes given by Boller et al. (1996).
Five out of the 58 Walter & Fink objects are indeed NLS1, also included in the Boller et al. (1996) sample. Prior to the comparison of both samples, we have used the reported properties of the common objects to check the consistency of the two studies. We have found differences in the reported soft X-ray spectral indexes of the five NLS1 of up to 25% , but within the 3 error. Similarly, the fluxes derived by Walter & Fink (1993) are always larger than those inferred from the Boller et al. (1996) data. Nonetheless, in any case the differences are smaller than 3, according to the errors given by Walter & Fink (1993). Therefore, we can be confindent that the results of both studies are consistent within their errors bars. The 5 NLS1 in Walter & Fink (1993) have been excluded of their sample, leaving a set of 53 normal broad line Seyfert 1 galaxies. We also recall here that the Boller et al. (1996) sample of NLS1 galaxies has been enlarged with three more objects observed by us with IUE (Sect. 2.1).
In Table 3 we give the mean and standard deviation (S.D.) of some parameters in both samples, as well as the number of objects for which each parameter is available and the probability that the parameter is normally distributed. The luminosities in the IRAS bands, in the UV (1450 Å) and in the ROSAT band, as well as the ratios between some of them are given. The last column in the table is the significance of the hypothesis that both samples come from the same parent population according to the Mann-Whitney rank sum test.
The smallest significance (i.e., the highest probability that the two samples come from different parent distributions) is found for the spectral index in the ROSAT band (). However, it should be noted that the S.D. of is larger in the sample from Boller et al. (1996); many NLS1 have well within the typical values found for normal broad emission lines Seyfert 1, but there are some NLS1 that show much steeper soft X-ray spectra. Therefore, a very steep soft X-ray spectrum is not a characteristic of all NLS1, although the steepest spectra among Seyfert 1 galaxies are found in NLS1. In spite of this difference in spectral slopes, there is no statistically significant (significance 0.10) difference in the total ROSAT luminosity between NLS1 and normal Seyfert 1 galaxies.
The other parameters that are different in the two samples (at the 0.05 significance level) are the UV luminosity and the ratios in which this luminosity is involved. The NLS1 are, on average, 6 times fainter in the UV than normal broad emission lines Seyfert 1, although the total range spanned by the NLS1 ( erg s-1) is well within the total range for normal Seyfert 1 galaxies ( erg s-1). The average / and / ratios are correspondingly smaller in NLS1 than in normal Seyfert 1; furthermore, the smallest absolute values of these ratios correspond to NLS1. It is also worth noting that the “normal” Seyfert 1 with / and / closer to the extreme values found for NLS1 are NGC 4051 and NGC 1566. Winkler (1992) gives a FWHM for the H line in NGC 1566 of 1800 km/s and Filippenko & Sargent (1985) describe the Balmer lines of NGC 4051 as “not very broad compared with those in most Seyfert 1 galaxies”.
From Table 3, it is remarkable the high degree of similarity in the FIR properties between NLS1 and normal broad emission lines Seyfert 1. This result is consistent with the Halpern & Oke (1987) results. The spectral index between 25 and 60 m () of the five NLS1 discussed by Halpern & Oke (1987) spans the whole range found for normal Seyfert 1 galaxies (Miley et al. 1985, Mas–Hesse et al. 1995). For our sample, we find that only two out of ten NLS1 detected at 25 and 60 m have steeper than –1.5, typical of star forming regions. Although our sample is rather small, it is still worthy to note that the fraction of steep FIR spectrum NLS1 is roughly consistent with that found among normal Seyfert 1 by Mas–Hesse et al. (1995).
We have compared the luminosity in all the IRAS, UV and ROSAT bands versus and . We find a statistically significant correlation among the luminosities in all IRAS, UV and ROSAT bands. Moreover, there is no statistical evidence for the NLS1 and Seyfert 1 galaxies to show different slopes in the linear regression fits. However, the positive correlations found in all continuum bands are not held when the fluxes, instead of luminosties, are considered (Fig. 1). When the distance effect is removed, the correlations between low energy (IRAS) and high energy (UV, ROSAT) bands disappear, leaving only the correlation among IRAS bands on one side and between the UV and ROSAT bands on the other side. These results suggest that the mechanisms producing the UV and soft X-ray photons are strongly related, but the connection between the production of FIR radiation and UV – soft X-rays is not straightforward.
The conclusion that emerges from the comparison of the luminosity in the FIR, UV and soft X rays continuum bands is that the SED of NLS1 and normal broad emission lines Seyfert 1 galaxies are very similar, except in that some, but not all, NLS1 have steeper soft X-ray spectra and that NLS1 tend to be somewhat underluminous in the UV region.
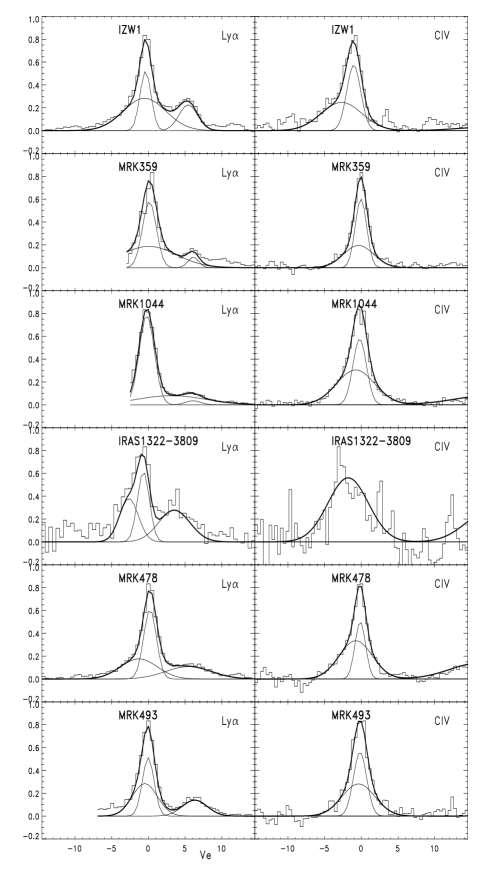
2.4 Line Profiles
A first look to the line profiles suggests the presence of broad wings in the strongest emission lines (Fig. 2). In order to test it, we have fitted the Ly, C1550 and He1640 line profiles with first only one and then two gaussian components (for the Ly profile an additional gaussian has been included to account for N1240). The best fit parameters for the case that results in a smaller reduced chi-square111We have used the minimization package MINUIT from the CERN Library, James (1994) (= /, where is number of degrees of freedom) are shown in Table 4. For the seven objects where the signal-to-noise ratio (S/N) in the continuum is larger than 10, we note that the multi-component fit is preferred in at least one of the emission lines. Moreover, when the line profile is better fitted by two gaussians, we find that one is slightly broader than the IUE Point Spread Function (FWHM1500 km/s) and the other has a FWHM similar to those found in normal Seyfert 1 galaxies (FWHM 5000 km/s). For the rest of the objects, the multi-component fit does not improve with respect to the fit with a single gaussian. However, we point out that the spectra of these objects are those which have the lowest S/N making it difficult to detect broad line wings. In any case, the line widths for the single-component fits tend to be larger than the width of the narrow component in the multigaussian fits. We want to stress that it is not our aim to identify each gaussian component in the fits with physically different regions. The purpose of the fits is to confirm or reject the presence of broad wings in the emission line profiles.
Our results strongly suggest the presence of high velocity line emitting gas in the nuclei of NLS1 and that the profiles are qualitatively similar to those found in normal Seyfert 1, in the sense that they can be roughly characterized by a narrow plus a broad component.
As mentioned above, NLS1 as a class are characterized by optical hydrogen emission lines broader than their neighbour forbidden lines, but narrower than the Balmer lines found in normal Seyfert 1 galaxies (Osterbrock & Pogge, 1985). Nevertheless, after finding evidence of broad wings (FW0I10,000 km/s and FWHM5,000 km/s ) in the permitted UV lines of some NLS1, we have specifically searched for such broad wings in the hydrogen optical lines. In their variability analysis of NLS1 galaxies, Giannuzzo & Stirpe (1996) present H and H spectra of three NLS1 objects for which we find broad wings in the UV lines (Mrk 359, Mrk 1044 and Akn 564). To check the presence of broad wings, we have done a multi-gaussian fit (similar to that performed with the UV lines) to these spectra, kindly provided by Giannuzzo & Stirpe. The fits require, first, three narrow gaussian lines whose width is determined by the spectral resolution: one gaussian for the Balmer line (H or H) in the range and two additional ones to account for either the O4959,5007 or the N6548,6584 doublet. In the H range, two more gaussians, slightly broader (i.e. 1000 km/s), are included in the fits to account for the FeII emission in Akn 564 and Mrk 1044. In addition to that, both H and H in the three objects require at least two more, broader, gaussian components to account for the total profile. The first of them is of intermediate width, km/s, and the second has an FWHM less than 3000 km/s, narrower than the broadest UV component in the same objects. In order to check the existence of broader wings, we have tried another fit in which the width of the broadest line is fixed to 5000 km/s. The result is clearly worse as the r.m.s of the residuals is much larger. Therefore, we can only put upper limits to the flux of a putative optical component of 5000 km/s FWHM, as it is certainly not detected in the available spectra. These estimates can then be used to infer the upper limit of the broad Ly/H ratio. From the residuals of the multigaussian fits we obtain that, for the three NLS1 studied, the broad Ly/H ratio is larger than 100. This lower limit is also confirmed when directly estimated from the S/N in the wings of the lines.
| Object | Ly | CIV | HeII | |||
|---|---|---|---|---|---|---|
| Narrow | Broad | Narrow | Broad | Narrow | Broad | |
| Fluxa | Fluxa | Fluxa | Fluxa | Fluxa | Fluxa | |
| Widthb | Widthb | Widthb | Widthb | Widthb | Widthb | |
| MRK957 | ||||||
| IZW1 | 11428 | 23982 | 4216 | 5352 | 4.54.3 | 9.56.2 |
| 1760240 | 68001200 | 2200430 | 66003400 | 1020510 | 91003500 | |
| MRK359 | 7528 | 100150 | 5313 | 4525 | 12.04.2 | |
| 2220410 | 89008400 | 1830210 | 4820860 | 1840330 | ||
| MRK1044 | 30841 | 14349 | 6915 | 10435 | 9.63.9 | 5216 |
| 2410150 | 109002400 | 2150250 | 6130750 | 2000390 | 108002000 | |
| MRK1239 | 41.514.8 | 2211 | 11.58.1 | |||
| 2960570 | 3310880 | 1960800 | ||||
| KUG1031+398 | 12.24.2 | 1512 | ||||
| 1590310 | 74003000 | |||||
| MRK42 | 23.86.0 | 19.66.1 | 6.07.3 | 3.82.8 | ||
| 3050410 | 2320430 | 31002400 | 1360520 | |||
| MRK766 | 16.43.9 | 15.34.6 | 9.84.5 | |||
| 1740220 | 2910440 | 3400870 | ||||
| IC3599 | ||||||
| IRAS1322-3809 | 1326 | 1226 | 16.79.1 | 9.57.3 | ||
| 19001400 | 30003800 | 65002000 | 72003400 | |||
| MRK478 | 14929 | 12562 | 3015 | 6434 | 4617 | |
| 2030210 | 59001200 | 1680460 | 53001100 | 89002000 | ||
| MRK493 | 4428 | 5353 | 2413 | 3027 | 4.94.3 | |
| 1850460 | 40001300 | 2110510 | 53001500 | 22001100 | ||
| 1652+396 | ||||||
| AKN564 | 12015 | 2811 | 16.95.3 | 3117 | ||
| 2490160 | 3840770 | 1460240 | 98502750 | |||
Notes:
a: erg cm-2 s-1
b: FWHM (km/s)
3 Discussion
Independently of the details on how the photoionizing radiation is produced, the intensity of the emission lines and their response to variations in the continuum strongly argues in favour of the hypothesis that there is photoionized gas in the nuclei of active galaxies. In the standard model of AGN, such a gas is distributed in a large number of relatively small clouds surrounding an accretion disk around a supermassive black hole, whose emitted radiation heats and ionizes the gas clouds. The intensities and profiles of the emission lines are driven by the photoionization continuum and the physical conditions, distribution and kinematics of the gas. As mentioned in Sect. 1, the lack of broad wings in the optical permitted lines in NLS1 has been attributed to either the absence of high velocity gas clouds or an orientation effect that makes that these clouds have a negligible velocity component along the line of sight. However, the detection of broad wings in the permitted UV lines proves the presence of high velocity gas clouds, with a large velocity component along the line of sight. Therefore, it is necessary to conceive a scenario where a central continuum similar to that of the normal Seyfert 1 ionizes high velocity gas which emits broad UV lines that can be seen from the Earth, whereas the broad optical emission lines can not be detected.
A possibility is that both UV and broad optical lines are in fact emitted in the BLR, but hidden by the thick molecular dusty torus proposed in the unification models for AGN. The broad UV lines then will show up after reflection in a scatterer material above the torus. In this context, a natural way to show up the UV but not the optical lines is scattering by dust, which is much more efficient in the UV than in the optical (as opposed to scattering by electrons, which is essentially wavelength independent). If this picture is true and the BLR is hidden from direct view, we would expect the continuum to be hidden as well, unless the system has a very unlikely geometry. However, the SED of NLS1 discussed in previous section does not support the picture of hidden AGN. In fact, the NLS1 SED is closer to that of normal Seyfert 1 galaxies than to that of Seyfert 2 (up to now the best candidates to hidden AGN). In particular, the Seyfert 2 SED is much more strongly peaked in the FIR range than that found in NLS1. Moreover, another observational result in conflict with the hypothesis of a hidden AGN is the absence of significant cold absorption of the X-rays (Boller et al. 1996).
There is another possibility that does not consider a hidden nucleus, but a scenario in which the nuclear gas simply does not emit optical lines. The strongest permitted lines in the optical range are H, H and the rest of the lines from the Balmer series of hydrogen. These lines are predominantly formed in regions where the hydrogen is only partially ionized (HPI), while the strongest UV lines (C1550 and He1640) form where the hydrogen is fully ionized (HFI) (H-Ly may form in both fully or partially ionized regions). Therefore, the absence of broad H-Balmer lines in the optical region would be naturally explained if there is no HPI zone in the high velocity gas in the nuclei of NLS1. The presence within the BLR of hydrogen fully ionized clouds (and, hence, optically thin to Lyman continuum photons), has already been suggested by Shields et al. (1995) (see also references therein). As they show, thin clouds can contribute significantly to the emission of the broad high ionization lines in AGN without producing significant low ionization species. Shields et al. (1995) also discuss on the possibility that these thin clouds are responsible of the observed UV and soft X-ray absorption features in the AGN spectra (when crossing our line of sight to the central source).
In order to explore the physical conditions of a gas to emit the observed NLS1 line spectrum, we have made use of the photoionization code CLOUDY (Ferland 1991). We have assumed a solar abundance gas which is illuminated by an ionizing continuum similar to that derived by Mathews & Ferland (1987). The free parameters (the gas physical conditions) are selected automatically by the code to find an optimal solution fitting the observed average line spectrum: Ly/CIV2, Ly/H 100, He1640/CIV0.10. The code derives an optimal model for a region where the total hydrogen column density is , the hydrogen number density is and the ionization parameter . Under these conditions, the emitting gas is fully ionized in hydrogen, and, thus, optically thin to the Lyman continuum. We note that the detailed physical conditions would be different if, for instance, the ionizing continuum is harder than that of Mathews & Ferland (1987). However, we want to stress that, independtly of the actual numbers obtained from CLOUDY, a high ionization parameter and a relatively low column density are required to roughly reproduce the observed line ratios. A detailed model of the BLR in NLS1 is out of the scope of this paper, since higher quality data over a wider spectral range would be needed for every single object, but the CLOUDY computations give sufficiently general results for this dicussion.
The equivalent width of the Ly line emitted in optically thin clouds is much smaller (100 times) than in the optically thick case, but the observed equivalent width of the broad Ly in NLS1 (as derived from Tables 2 and 4) is only 3 times smaller than in normal Seyfert 1 galaxies ( Å). If the BLR in NLS1 emits indeed in an optically thin regime, the covering factor ( fraction of the sky covered by clouds, as seen by the central continuum source) has to be much larger () than in normal Seyfert 1 () to keep the difference in equivalent widths not too big. As a side effect, a large value of implies that the probability of finding a cloud right in the observer’s line of sight is very high. However, the effect of an optically thin intervening cloud in the observed spectrum will not be very strong, except in the soft X-ray domain, which is very sensitive to relatively small amounts of neutral hydrogen and where absorption edges can be found due to some highly ionized atoms (e.g., OVI-VIII). As we noted above, this fact was already pointed by Shields et al. (1995) who discuss under which conditions the thin BLR clouds can also produce soft X-ray absorption edges. In this respect, we note that the crossing time of one of these optically thin clouds would be of the order of hours, similar to the variability time scales found in the soft X rays of most NLS1. If the variations detected in the soft X-rays are due to the passage of individual clouds across the observer’s line of sight, no change in the emission lines would be expected, since their flux comes from the integration over a very large number of clouds, whose ionizing radiation has not changed.
Another implication of optically thin clouds is that the response of the emission lines to continuum variations is much weaker than in the case of thick clouds. A line fluctuation would only be detected if the change in the continuum is sufficiently large to produce a significant change in the ionization structure of the clouds. This could explain why the wings of the UV lines in the spectra of Mrk 1044 and IRAS13224-3809 remained constant while the continuum and the line cores varied (Sect. 2.2).
In their study of optically thin broad-line clouds in AGN, Shields et al. (1995) suggest that the importance of thin clouds relative to the thick clouds should be larger in low luminosity objects than in high luminosity ones. To account for this effect, they claim for outflows of the thin clouds that would proceed more efficiently in intrinsically brighter sources. This could explain the observed anti-correlation between UV emission-line equivalent width and continuum luminosity (the Baldwin effect). In this context, the tendency for the NLS1 galaxies to have lower UV luminosities than “normal” Seyfert 1 also supports the presence of optically thin broad-line clouds in NLS1.
We have finally compared the “typical” parameters that characterize normal BLR (), with those found to represent the BLR in NLS1 ((). From the definition of ,
| (1) |
where corresponds to 13.6 keV, and taking into account the average differences in and given in Table 3, the distance of the BLR to the ionizing source should be very similar in NLS1 (within a factor of 2) and normal Seyfert 1 galaxies.
4 Summary
We have analyzed the UV properties of a sample of the 14 NLS1 galaxies observed with the IUE satellite. This sample comprises some unpublished observations of our own together with archival data. When the available number of spectra and their S/N allowed for it, we have studied the UV variability properties of the objects. Two objects (Mrk 1044 and IRAS13224-3809) have been found to experience significant variations in the continuum while the emission line wings remain constant.
We have studied the continuum SED of the NLS1 sample, from the FIR to the soft X-rays, comparing it with the SED of a sample of “normal” Seyfert 1 galaxies from Walter & Fink (1993). The FIR properties of NLS1 are not different from the FIR properties of “normal” Seyfert 1 galaxies with broad optical permitted lines. Only the UV luminosities tend to be smaller in NLS1, and the soft X rays spectra tend to be steeper, although a number of NLS1 are found to have spectral indexes very similar to those found in “normal” Seyfert 1 galaxies.
The analysis of the UV emission line spectra of the sample, has revealed that all NLS1 galaxies detected with IUE at sufficiently high S/N show broad wings in their emission lines (Ly, CIV and HeII). The positive detection of these broad wings demonstrates the existence of gas with a large velocity component in our line of sight, ruling out the hypotheses that (a) there is no BLR in NLS1, or (b) there is a BLR, but we cannot see it due to orientation effects. It is also difficult to accept that the broad wings we see in the UV emission lines result from a scattering process, since the optical counterparts are not detected even in polarized light and since the NLS1 continuum SED does not suggest a hidden AGN as in Seyfert 2 galaxies.
We have discussed how the absence of broad optical lines can be explained if the partially ionized zone in the high velocity line emitting gas is missing. The BLR would be made of fully ionized hydrogen gas in optically thin clouds similar to those proposed by Shields et al. (1995). In this way only the high ionization lines would be produced. Some of the implications of a BLR formed by highly ionized gas are discussed. In particular, the covering factor needed to account for the observed equivalent width of the emission lines should be very large.
Acknowledgements.
We are grateful to G. Stirpe and E. Gianuzzo for providing their optical spectra of three NLS1. We also want to thank T. Boller for his help in the selection of the targets list. This work has been partially supported by Spanish CICYT grant PB-ESP95-0389-C02-02.References
- [1996] Boller, Th., Brandt, W. N., & Fink, H. 1996, A&A, 305, 53
- [1991] Crenshaw M.D., Peterson B.M., Korista K.T., Wagner R.M., Aufdenberg J.P., 1991, AJ , 101, 1202
- [1990] Dickey, J. M., and Lockman, F. J. 1990, ARA&A , 28, 215-261.
- [1991] Ferland, G.J., 1991, HAZY, OSU Astronomy Dept., Internal Report 91-01, August 4, 1991.
- [1985] Filippenko A.V., Sargent W.L.W., 1985, ApJS, 57, 503
- [1996] Giannuzzo, M.E., & Stirpe, M.G., 1996, A&A, 314, 419
- [1989] Goodrich, R. W., 1989, ApJ, 342, 224
- [1987] Halpern, J. P., & Oke, J.B., 1987, ApJ, 312, 91
- [1996] James, F., 1994, MINUIT Reference Manual, Version 94.1, CERN Geneva, Switzerland.
- [1996] Leighly, K. M., Mushotzky, R.F., Yaqoob, T., Kunieda, H., Edelson, R., 1996, ApJ, 469, L147
- [1994] Mas–Hesse, J.M., Rodríguez–Pascual, P.M., Sanz Ferández de Córdoba, L., Boller Th., 1994, A&A , 283, L9
- [1995] Mas–Hesse, J.M., Rodríguez–Pascual, P.M., Sanz Ferández de Córdoba, L., Mirabel, I.F., Wamsteker, W., Makino, F., Otani, C., 1995, A&A, 298, 22
- [1987] Mathews, W.G. & Ferland, G.J., 1987, ApJ, 323,456
- [1985] Miley, G.K., Neugebauer, G., and Soifer, B.T., 1985, ApJ, 293, L11
- [1993] Nichols, J. S., Garhart M.P., De la Peña, M.D., Levay, K.L., 1993, NEWSIPS Information Manual: Low Dispersion Data V1.0, CSC/SD-93/6062
- [1985] Osterbrock, D. E., & Pogge, R. W., 1985, ApJ, 297, 166
- [1995] Otani, C. 1995, PhD thesis, Tokyo University
- [1994] Peterson, B.M., 1994, Reverberation Mapping of the Broad-Line Region in Active Galactic Nuclei, ed. Gondhalekar, P.M., Horne, K., Peterson, B.M., Astronomical Society of the Pacific Conference Series, Vol. 69., p.1
- [1995] Pounds, K.A., Done, C., & Osborne, J.P., 1995, MNRAS, 277, 5P
- [1992] Puchnarewicz, E.M., Mason K.O., Córdova F.A., Kartjie J., Branduardi–Raymont G., Mittaz J.P.D., Murdin P.G., Allington–Smith J., 1992, MNRAS , 256, 589
- [1993] Ross, R. R., & Fabian, A. C., 1993, MNRAS, 261, 74
- [1989] anders, B., Phinney, E. S., Neugebauer, G., Soifer, B. T., Matthews, K., 1989, ApJ , 347, 29
- [1995] Shields, J.C., Ferland, G.J., Peterson, B.M., 1995, ApJ, 441, 507
- [1989] Stephens, A.J., 1989, AJ , 97 10
- [1995] Ulvestad J.S., Antonucci, R.J. & Goodrich, R.W., 1995, AJ, 109, 81
- [1993] Walter, R. & Fink, N.H., 1993, A&A , 274, 105
- [1992] Winkler, H., 1992, MNRAS, 257, 677