A Deep Look at the Emission-Line Nebula in Abell 2597
Abstract
The close correlation between cooling flows and emission-line nebulae in clusters of galaxies has been recognized for over a decade and a half, but the physical reason for this connection remains unclear. Here we present deep optical spectra of the nebula in Abell 2597, one of the nearest strong cooling-flow clusters. These spectra reveal the density, temperature, and metal abundances of the line-emitting gas. The abundances are roughly half-solar, and dust produces an extinction of at least a magnitude in . The absence of [O III] 4363 emission rules out shocks as a major ionizing mechanism, and the weakness of He II 4686 rules out a hard ionizing source, such as an AGN or cooling intracluster gas. Hot stars are therefore the best candidate for producing the ionization. However, even the hottest O-stars cannot power a nebula as hot as the one we see. Some other non-ionizing source of heat appears to contribute a comparable amount of power. We show that the energy flux from a confining medium can become important when the ionization level of a nebula drops to the low levels seen in cooling-flow nebulae. We suggest that this kind of phenomenon, in which energy fluxes from the surrounding medium augment photoelectric heating, might be the common feature underlying the diverse group of objects classified as LINERS.
1 Introduction
A magnificent ionization nebula fills the central 20 kpc of Abell 2597, a relatively nearby cluster of galaxies at . The H+[N II] luminosity of this nebula, uncorrected for reddening, is (Heckman et al. 1989). This intracluster emission-line display is not unique. Such nebulae are common among clusters whose central cooling times are shorter than a Hubble time but are absent in clusters with longer central cooling times (Hu, Cowie, & Wang 1985; Heckman et al. 1989). The strong correlation between central cooling time and optical nebulosity suggests that the cooling of the intracluster medium somehow excites the line emission. Yet, despite this tantalizing hint, the true source of the ionizing energy in these clusters has remained mysterious.
The puzzle is not new. Over 65 years ago Hubble & Humason (1931) had already noted the unusual appearance of NGC 1275, the central galaxy of the Perseus cluster. It is quite blue for an elliptical galaxy, and its spectrum bristles with strong emission lines. Two decades later, Baade & Minkowski (1954) identified NGC 1275 with the radio source Perseus A, and Minkowski (1957) discovered that its extended emission-line system separated into two subsystems differing by 3000 km s-1 in radial velocity. Minkowski suggested that the two velocity subsystems arose from a galaxy-galaxy collision. Soon thereafter, the Burbidges speculated that NGC 1275 might be an exploding galaxy (Burbidge, Burbidge, & Sandage 1963; Burbidge & Burbidge 1965), an interpretation given impetus by the the spectacular H image of Lynds (1970) showing a complex of filaments extending up to 100 kpc from the galaxy’s center.
X-ray astronomers came upon the mystery of emission lines in clusters from a different direction. Once X-ray telescopes began to resolve the hot intracluster medium (ICM) in the nearest clusters, it became apparent that the central cooling times in clusters were frequently shorter than a Hubble time. The brevity of these cooling times meant that, if there were no heat source to replenish the radiative losses, the ICM at the cores of such clusters must be cooling and settling towards the center in a “cooling flow” (see Fabian 1994 for a review). Significantly, many of the earliest known cooling-flow clusters also displayed emission-line systems, and advocates of the cooling-flow hypothesis suggested that condensing intracluster gas somehow emitted the optical lines as it cooled from several times K down through K (Fabian & Nulsen 1977; Mathews & Bregman 1978).
Quantitative followup of cooling-flow clusters revealed that the connection between ICM cooling and line emission was complicated. The H luminosity of a hot homogenous gas cooling through H-emitting temperatures is , where is the mass cooling rate in units of 100 solar masses per year. The H luminosities of intracluster nebulae, if they arose from simple cooling, would require rates up to , tens to hundreds of times higher than the X-ray derived cooling rates.
Even the more modest cooling rates inferred from X-ray observations, typically , face a crisis which continues: we have not yet figured out where the cold gas goes. Normal star formation in cooling-flow clusters progresses at only 1-10% of (e.g. McNamara & O’Connell 1989, 1992; O’Connell & McNamara 1989). Enigmatic soft X-ray absorption in many clusters seems to indicate a large mass of cold intracluster gas (White et al. 1991; Allen et al. 1993; Ferland, Fabian, & Johnstone 1994), but this presumably molecular gas has not yet been detected in any other waveband (McNamara, Bregman, & O’Connell 1990; O’Dea et al. 1994; Braine et al. 1995; Voit & Donahue 1995).
While these difficulties with the cooling-flow hypothesis leave ample room for skepticism, intracluster nebulosity and a short central cooling time are clearly connected. All clusters known to have extended H emission at their centers also have central cooling times shorter than a Hubble time (Hu, Cowie, & Wang 1985; Heckman et al. 1989; Baum 1992; Donahue 1997). Moreover, the majority of clusters with short central cooling times contain such nebulae, and their line luminosities correlate with .
In hopes of nailing down this crucial piece of the cooling-flow puzzle, astronomers have invented a variety of schemes to link line emission to the cooling ICM. The models proposed have included repressurizing shocks (Cowie, Fabian, & Nulsen 1980; David, Bregman, & Seab 1987), high-velocity shocks (Binette, Dopita, & Tuohy 1985), self-irradiated cooling condensations (Voit & Donahue 1990; Donahue & Voit 1991), and turbulent mixing layers (Begelman & Fabian 1990; Crawford & Fabian 1992). None have been entirely successful. Recent searches for [Fe X] 6374 Å emission from cooling-flow clusters now seem to rule out any mechanism that relies on the ionizing photons from cooling of hot gas (Donahue & Stocke 1994; Yan & Cohen 1996). Photoionization by a central source also appears unlikely because the ionization level in cooling-flow nebulae remains constant while the pressure drops like (Johnstone & Fabian 1988; Heckman et al. 1989).
Johnstone, Fabian, & Nulsen (1987), motivated by the anticorrelation they found between the strength of the 4000 Å break and the H luminosities of cooling flows, proposed that hot stars forming at the centers of cooling flows might photoionize cooling flow nebulae. Initially, this idea did not look promising because the emission-line spectra of cooling-flow nebulae look very different from H II region spectra. However, some recent work has strengthened the link between emission lines and star formation in cooling-flow clusters. Unpolarized excess blue continuum emission correlates with both the spatial distributions aand luminosities of cooling-flow nebulae (Allen 1995; Cardiel, Gorgas, & Aragon-Salamanca 1995, 1997; McNamara et al. 1996a,b).
In the meantime, we have obtained deep optical spectra of cooling flow clusters that also implicate hot stars as the main stimuli of intracluster H. Here we present our analysis of the emission lines from Abell 2597. Section 2 describes the observations, and § 3 discusses them. Because we can detect a large number of important optical lines, we can determine the density, temperature, and metallicity at the center of the emission-line nebula without resorting to model-dependent assumptions. Our analysis rules out both shocks and photoionization by a hard continuum, leaving hot stars as the most plausible option. However, hot stars have difficulty accounting for the elevated temperatures we measure. Section 4 discusses why an additional source of heating might be necessary and suggests that some sort of energy transfer from the confining hot gas might well supply it. Section 5 summarizes our results.
2 Observations
We observed Abell 2597 on August 12, 1993, in nearly photometric conditions with the 5m Hale Telescope at the Palomar Observatory. Using the Double Spectrograph, we gathered both blue and red spectra simultaneously. In these observations, a dichroic split the spectrum at approximately 5500 Å, directing the blue light (3770-5500Å) onto a grating with 300 lines/mm, a dispersion of 2.15 Å/pixel, and an effective resolution of Å, and the red light (5550Å- 7980Å) onto a grating with 316 lines/mm, a wavelength scale of 3.06 Å/pixel, and an effective resolution of Å. Our three 3 exposures of Abell 2597 totalled 1.5 hours, and in each exposure a 2″ slit was placed on the central galaxy of Abell 2597 at a position angle of 30∘. The position angle remained within 30∘ of the parallactic angle throughout the observation.
The data were processed in a standard way, using IRAF, in December 1993. We removed pixel-to-pixel variations with a normalized dome flat. Our calibration of the wavelength scale, using arc lamps of HC (blue) and NeAr (red) and some sky lines, yielded wavelength solutions with 0.5Å RMS (red) and 1.2Å RMS (blue). Several exposures of a star at different positions along the slit were used to remove curvature along the dispersion axis. The IRAF task fitcoords in the noao.twodspec.longslit package was used to correct the data and the task background was used to select the source-free regions along the slit and to subtract the sky contribution. The spectra were corrected for atmospheric extinction and were flux corrected with standard star exposures of Feige 110 and BD33+2642, taken directly before the observations of Abell 2597. Galactic extinction is predicted to be only 0.08 () magnitudes, so we did not deredden the spectrum. Any reddening we measure thus includes the effects of Galactic dust.
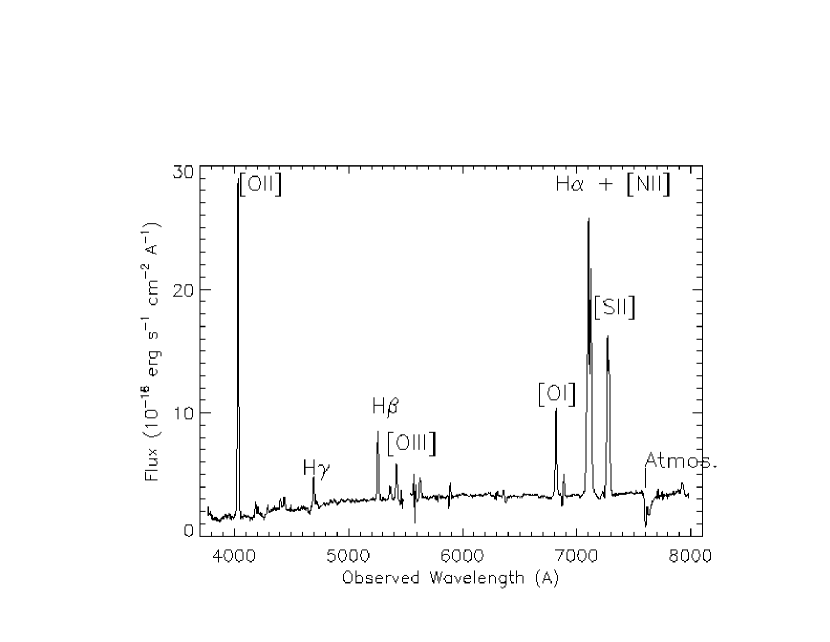
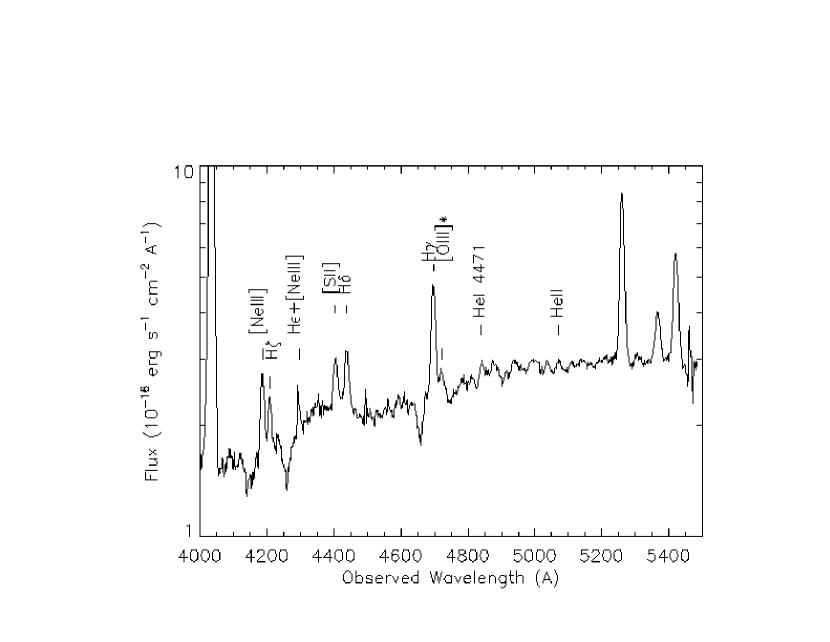
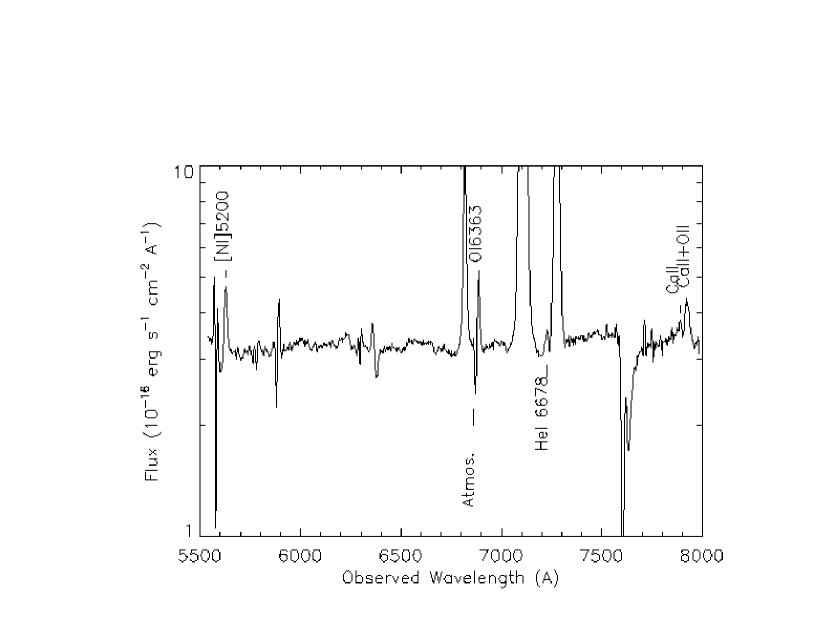
We extracted a single spectrum, along 8 arcseconds of the slit centered on the nucleus, from each CCD (Figure 1). The signal-to-noise ratio of this spectrum exceeded 100 in the continuum and proved suitable for studying the faint emission lines of interest (Figures 2 and 3). The emission line fluxes, measured using the splot task, are listed in Table 1. Errors in the fluxes of the red emission lines were assessed automatically by splot, which generates Monte Carlo simulations of the data and computes a 1 (68.3%) confidence range. The quoted errors in the red lines thus include uncertainties in the background subtraction and Poissonian noise.
The complexity of the stellar continuum underlying the blue lines in our spectrum necessitated a more detailed line-measuring procedure. To measure the blue lines, we constructed a template spectrum of nearby dwarf elliptical galaxies without emission lines. These spectra were acquired during the same night with the same instrumental setup. The absorption features in the template spectrum match the absorption features in the A2597 spectrum quite well. We fitted the ratio of the A2597 spectrum to the template spectrum with a low-order polynomial, used this polynomial to scale the template spectrum, and subtracted the scaled template from the A2597 spectrum. Template subtraction proved to be very important. The A2597 emission line + stellar continuum spectrum showed a possible feature at the expected position of [O III] 4363, but this feature vanished upon subtraction of the stellar continuum because it was an artifact of the stellar absorption lines (Figure 4). Measuring the He II 4686Å recombination line also depends critically on template subtraction (Figure 5).
In general, most of the error in the blue line measurements stems from uncertainties in the subtraction of the background continuum. To gauge this uncertainty, we measured the lines manually many times, evaluating how different methods of background removal changed the total line fluxes. Line flux estimates generally stayed within 5% from measurement to measurement. For the weakest lines, this variation sometimes approached 10%. Our line-flux uncertainties reflect this variation. Upper limits for the undetected lines were evaluated by measuring the residual RMS variation after subtraction of the stellar continuum template. For a FWHM=10Å, the upper limit is . HeI 4471 was detected just barely above the 3 limit of , and we will treat this flux as an upper limit.
The lines all had a FWHM consistent with a velocity dispersion () of 270 km/sec (FWHM). The best-fit redshift is . No correction for the LSR was required because , smaller than our resolution.
3 Emission-Line Analysis
Most emission-line studies of cooling-flow nebulae have relied on accurate measurements of the strongest lines. The relative fluxes of features like H, H, [N II] 6584, and [O III] 5007 are generally handy for broad classification of extragalactic nebulae, but by themselves they are not quite so useful for measuring physical quantities such as electron temperature and metallicity. With information on only a small set of lines, we are usually left having to fit underconstrained photoionization models to the data.
This dataset on Abell 2597 enables us to do much more. The extensive set of line fluxes in Table 1 can be used to measure the reddening of the emission-line spectrum, the density and temperature of the nebular gas, and the nebula’s approximate metallicity, all without recourse to underconstrained photoionization models. We can also put strong limits on the shock-excited [O III] line at 4363 Å and the He II recombination line at 4686 Å, measurements that rule out shocks as a major ionizing mechanism and point towards hot stars as the primary ionizing agent in the intracluster nebula.
3.1 Oxygen Lines & Shocks
One of our primary motivations in obtaining a deep blue spectrum of Abell 2597 was to measure the 4363 Å emission line of [O III]. Shocks radiate this line much more efficiently than photoionized gas, making it an effective diagnostic for distinguishing between these ionization processes. Most shock models predict
| (3-1) |
for the ratio between the [O III] 4363 Å line and the sum of the 4959 Å and 5007 Å lines. Photoionization models predict smaller values because the [O III] emitting gas is cooler. At a temperature of 10,000 K, in low-density gas. We find that at the center of Abell 2597, , strongly indicating that shocks are not the dominant ionization process there.
Figure 6 shows predictions for shocks of various velocities from the models of Shull & McKee (1979; SM79), Binette et al. (1985; BDT85), Hartigan, Raymond, & Hartmann (1987; HRH87), and Dopita & Sutherland (DS95). Figure 7 gives the corresponding ratios of [O III] to H. As the shock velocity rises through , the shock begins moving fast enough to collisionally ionize O+ to O++, so the [O III] fluxes rise rapidly. In the cooling postshock gas, the mean temperature of the [O III] emitting gas does not vary much with shock velocity, and the ratio remains close to 0.05 up to shock velocities of a couple hundred km s-1.
At higher shock velocities most of the [O III] flux comes from photoionized gas either upstream or downstream from the shock. Ultraviolet radiation from the cooling gas behind the shock propagates in both directions, ionizing whatever it encounters. In the DS95 (s) and BDT95 models, which consider photoionization of only the downstream gas, almost drops below the observed limits, but the [Fe X] limits rule out shocks this fast (Yan & Cohen 1995). The DS95 (sp) model also includes the photoionizing effects of postshock radiation on the lower-density upstream gas. The photoionizing precursor creates a more highly ionized region that can radiate strongly in [O III]. Such a shock satisfies the observed limits on but produces an [O III]/H ratio far larger than observed.
In a very narrow range of shock velocities near 80 km s-1 shock models come close to satisfying the observed constraints on and [O III]/H but fail for other reasons. These shocks require extremely unlikely fine tuning and do not reproduce the other forbidden-line ratios. At 80 km s-1, the SM79 models predict [N II] 6584/H and [S II] 6717/H, whereas our data show [N II] 6584/H and [S II] 6717/H. The disagreement of shock models with the observed [O III] lines leaves photoionization as the most likely mechanism for generating the emission lines in Abell 2597.
3.2 Balmer Lines & Reddening
Our spectrum of Abell 2597 contains hydrogen Balmer recombination lines ranging from H to H. Assuming Case B recombination applies, we can use the Balmer series to measure the reddening of the visible spectrum. The Balmer-line ratios decline systematically from red to blue, relative to Case B expectations at a density of and a temperature of 10,000 K, indicating that significant amounts of dust obscure our view of the nebula. The Galactic H I column towards Abell 2597 is a modest , so the large majority of the obscuring dust must reside in the cluster.
Figure 8 illustrates how the inferred amount of dust depends on the geometry of the dusty gas. To convert reddening to extinction, we assume a Galactic reddening law (Fitzpatrick 1986). If the dust forms a screen interposed between us and the nebula, the optical depth of the screen is at the wavelength of H (), corresponding to for a Galactic dust-to-gas ratio (Draine & Lee 1984). The observed reddening of the Balmer lines turns out to be quite consistent with the properties of Galactic dust. Alternatively, the grains could be intermixed with the line-emitting gas. This scenario requires a significantly larger dust column, one we cannot limit from above. The expected reddening in the large limit is essentially indistinguishable from that in the screen model.
3.3 Density & Ionization Parameter
The [S II] line ratio straightforwardly gives the electron density, , at the center of the nebula. Figure 9 shows that , with a best value of . Such a density is typical of the inner regions of cooling-flow nebulae (e.g. Heckman et al. 1989).
We can combine this density measurement with the H surface brightness to estimate the ionization level and column density of the nebula. The H brightness at the center of the nebula is , implying an emission measure of . At an electron density of , the inferred column density of ionized gas is then . Because the 21 cm absorption line in Abell 2597 indicates a much higher column density of H I, the ionized layers are likely to be thin skins on the surfaces of thick neutral clouds (O’Dea, Gallimore, & Baum 1994). The ionization parameter of a photoionized nebula is defined to be the ionizing photon density divided by the number density of hydrogen nuclei. A thick photoionized slab of hydrogen gas illuminated from one side has an ionized column , so the observed H II column implies , if the nebulae are ionization-bounded and only a few distinct photoionized surfaces lie along a given line of sight through the nebula. This value of is similar to that indicated by the [O III]/H ratio (Voit, Donahue, & Slavin 1994).
3.4 Temperature
Our spectra contain temperature sensitive line sets from both [O II] (3726 Å, 3729 Å, 7320 Å, 7330 Å) and [S II] (4068 Å, 4076 Å, 6717 Å, 6731 Å). The two ratios of interest are
| (3-2) |
and
| (3-3) |
To determine , we need to remove the contribution of [Ca II] 7324 to the red [O II] line blend by subtracting 0.68 times the [Ca II] 7291 flux. Thus, and .
To measure accurate temperatures, we need to correct these line ratios for reddening. Luckily, reddening affects the temperatures derived from these line ratios in opposite ways. In the temperature-reddening plane, the true temperature should lie at the intersection of the loci defined by and . Figure 10 illustrates how the temperatures inferred from these ratios in Abell 2597 change as the dust optical depth at H () increases, given an electron density of 200 cm-3 and a screen model for the obscuring dust. We also include the locus defined in this same plane by the H/H ratio. Within the observational errors, these three loci all intersect in a region where .
Note that these temperature limits do not depend significantly on the reddening model. The red [S II] lines are near H and the blue [S II] lines are near H, so the necessary Balmer-line correction gives the [S II] reddening correction directly. The exact correction for the [O II] lines should differ only slightly from the [S II] correction. Note also that the 9,500 K lower limit on the electron temperature does not depend on .
3.5 Metallicity
Because we know both the temperature and density of the ionized gas, the ratio of each forbidden-line flux to the hydrogen Balmer lines tells us the abundance of each line-emitting species. To derive elemental abundances from these lines, we would also need to know the ionization level in the plasma. Given the small ionization parameter (§ 3.2), the ionization levels are likely to be low, with most species predominantly singly ionized.
Figure 11 shows how the derived abundance of N+ varies with electron temperature for the [N II] 6584/H line ratio of 0.83 observed in Abell 2597. If the electron temperature is K, the N+/H+ ratio is about half of the solar N/H ratio. At the upper end of the allowed temperature range, near 12,000 K, the derived N+/H+ ratio drops to about 1/4 of the solar N/H.
The story for S+ is similar to that for N+. Figure 12 shows the derived range of S+/H+, which runs from half-solar at 9,500 K to 1/4 solar at 12,000 K. Sulphur is somewhat more likely to be doubly ionized than nitrogen, as the ionization potential for S+ is 23.3 eV, compared to 29.6 eV for N+. Nevertheless, the close correspondence between the relative abundances of N+ and S+ suggests that sulphur is mostly singly-ionized.
Our determination of the oxygen abundance benefits from lines radiated by three different ionization states. Figure 13 shows the relative abundances of O+ and O∘, with respect to H+. As with N and S, their sum corresponds to half of the solar O/H ratio at 9,500 K and to 1/4 the solar value at 12,000 K. The relatively modest [O III] lines indicate that O++ is a minority species; both O+ and O∘ are more common. The consistency of these abundances with those for nitrogen and sulphur is comforting; however, some of the [O I] flux could be coming from X-ray heated neutral gas behind the ionized region, so the derived O∘/H+ is really an upper limit for the ionized gas.
3.6 Helium Recombination Lines
The forbidden lines in cooling-flow nebulae are generally quite strong, relative to the Balmer recombination lines, indicating a large amount of heat input per photoionization. One possible way to supply the requisite heating is with a hard photoionizing continuum that remains strong into the soft X-ray band. Models that have used such an ionizing spectrum to reproduce some of the major line ratios include fast-shock models (Binette et al. 1985), self-irradiation models (Voit & Donahue 1990, Donahue & Voit 1991), and mixing-layer models (Crawford & Fabian 1992).
The helium recombination lines provide a model-independent way to check the hardness of the incident continuum. Our spectrum of Abell 2597 includes the He II recombination line at 4686 Å and the He I recombination lines at 6678 Å, 5876 Å, and 4471 Å. Broad Na I absorption, possibly associated with the dusty H I gas, contaminates the 5876 Å line, reducing its usefulness. The story told by the 4471 Å line is also unclear because the underlying continuum is so noisy. We barely detect this line at a level of , whereas we would expect if all the helium were singly ionized. The 6678 Å line, located in a cleaner part of the spectrum, is probably the most reliable. At the center of the cluster, , as expected in a nebula where singly-ionized helium predominates. In contrast, , implying very little He++.
The lack of He II recombination-line flux from Abell 2597 indicates that the photoionizing continuum cannot be especially hard. If the incident spectrum follows a power law from 13.6 eV into the soft X-ray band, then for . This kind of spectrum is too soft to supply the necessary heating per ionization. The He II/H I line ratio argues against AGN irradiation, fast shocks, and cooling gas as sources of the photoionizing continuum, leaving hot stars as the only plausible possibility.111We note, however, that a significant minority of quasars do have He II 4686/H ratios this small (e.g. Boroson & Green 1992). The ionizing continuua of these objects must be far weaker than the standard AGN continuum at the He II edge and cannot sustain the high nebular temperatures we observe.
4 Energetics
The line-ratio analysis of the previous section eliminated many of the most frequently mentioned energy sources for cooling-flow nebulae. Hot stars were not ruled out by these model-independent diagnostics, but can we construct a hot-star photoionization model that actually works? In this section, we attempt to do so, but we find that standard hot-star photoionization fails to provide the requisite heating by a factor of about two. We speculate that some kind of energy transfer from the hot surrounding medium might supply the other half of the heating.
4.1 Stellar Photoionization: Insufficient
To investigate whether hot stars alone can produce the emission lines observed in Abell 2597, we constructed numerous models with the photoionization code CLOUDY, version 84 (Ferland 1993). The code includes a grid of Kurucz model atmospheres up to effective temperatures of 50,000 K, as well as blackbody spectra at any temperature. We tested stellar models with K and blackbody models with K incident upon a gas with 0.5 solar metallicity, Galactic depletions, and . Figure 14 compares the temperatures derived from the [S II] and [O II] lines in these models with the temperature ranges derived from the observed lines, assuming . Only in the very hottest blackbody models do the electron temperatures approach the observed values. Thus, the continuua of hot stars are not hard enough to produce temperatures exceeding 9,500 K in gas with half-solar metallicity. If stars are responsible for photoionizing the nebula in Abell 2597, some other energy source must be providing additional heating comparable in magnitude to the photoelectric heating.
Figure 15 shows a specific example of stellar insufficiency. In these models, a hot stellar continuum with K irradiates a gas with half-solar metallicity. When the illuminating star is this hot, the O III/H ratio constrains the ionization parameter to be , in agreement with our estimate from the H surface brightness (§ 3.3). Refractory elements are depleted into dust grains, as in our own interstellar medium, and photoelectric heating from dust contributes energy to the nebula. Both depletion of coolants and dust heating raise the expected equilibrium temperature. Even so, the equilibrium temperatures set by photoelectric heating barely rise above 8000 K.
The extra heating required to boost above 9,500 K is comparable to the photoelectric heating itself. In equilibrium at these higher temperatures the sum of photoelectric heating and some other supplementary form of heating must balance line cooling. To achieve temperatures in the observed range, the total heating must be roughly twice the photoelectric heating. Even when the “extra heating” is several times the photoelectric input, Ly cooling keeps the equilibrium temperatures below 12,000 K.
Lowering the metallicity does not fix the mismatch between photoelectric heating and line cooling. In § 3.5 we showed that metallicities around 1/4 solar are possible if K. Figure 16 illustrates that stellar photoionization indeed generates higher equilibrium temperatures in lower metallicity gas, but the extra heating needed to boost all the way up to 12,000 K is still times the photoelectric heating. Models with half-solar metallicities actually require smaller proportions of additional heating.
4.2 Extra Heating
The failure of stellar photoionization to account fully for the heating of the nebula might be surprising, given the convincing evidence in favor of stellar photoionization as the primary ionizing mechanism. On the other hand, another ample source of heat energy, namely the pervasive hot intracluster gas, lies close at hand and presumably confines the ionized surfaces of the nebula. Several authors have pointed out that the energy fluxes necessary to power the most luminous cooling-flow nebulae are similar to the product of the pressure and the sound speed in the surrounding medium (Heckman et al. 1989; Donahue & Voit 1991; Crawford & Fabian 1992). Here we argue that this property of cooling-flow nebulae may not be entirely coincidental.
Energy can conceivably flow from the hot ICM into the cooler nebula in numerous ways. A few specific examples are electron thermal conduction (e.g. Sparks 1992), acoustic wave heating (e.g. Pringle 1989), and MHD wave heating (e.g. Friaca et al. 1997). All of these heat fluxes saturate at a rate .
Assume for the moment that thermal energy passes from the hot medium into the photoionized surfaces of the nebula at the saturated flux
| (4-1) |
where is a parameter of order unity. Meanwhile, the flux of photoelectric heat energy into the nebula is
| (4-2) |
where is the mean energy per ionizing photon. The ratio of these energy fluxes is
| (4-3) |
Note that in normal H II regions, with , the photoelectric heat flux overwhelms any mechanism operating at the rate . Such processes become energetically significant only where is low, in nebulae with dilute radiation fields or high pressures. At the low ionization parameters observed in Abell 2597 and other cooling-flow nebulae, a saturated mechanical energy flux could easily be comparable to the photon energy flux.
While these alternative mechanisms for supplying “extra heating” appear promising, and maybe even inevitable, on the broad level of the energy budget, further work is required to see if they will dissipate and distribute their energy throughout the nebula. For instance, saturated electron thermal conduction can transfer energy at a maximum flux of
| (4-4) |
(Cowie & McKee 1977), but the penetration depths of hot electrons into the nebula depend strongly on their velocities. An electron of energy passing into a fully ionized K plasma of density will stop after traversing a column density
| (4-5) |
(Voit 1991). Comparing to the typical thickness of a low-ionization H II layer, , shows that the distribution of conductive heating in the nebula will depend sensitively on the exterior temperature. However, electrons at the expected energies of several keV are clearly energetic enough to penetrate most of the ionized layer, as long as the magnetic field geometry is favorable. A coupled photoionization/conduction code will be needed to solve for the actual temperature structure and line emission from such a cloud.
4.3 LINERs in General
Classifiers of extragalactic nebulae place cooling-flow nebulae among the LINERs, a heterogeneous class of objects whose [O II] 3727 lines are stronger than their [O III] 5007 lines and whose [O I] 6300 lines are greater than 1/3 of [O III] 5007 (see Filippenko 1996 for a recent review). Generally, LINERs also have [N II] 6584 / H 0.6, unusually high for extragalactic H II regions (e.g. Ho 1996). These large forbidden-line fluxes, relative to H and H , imply high electron temperatures difficult to attain with normal O-star photoionization. While photoionization by an AGN-like nuclear X-ray source might explain the line ratios in compact LINERs, the line emission in a significant fraction of LINERs extends over a few kiloparsecs and appears to be powered by local processes (Filippenko 1996). Furthermore, the He II 4686/H ratios in LINERs are frequently lower than AGN-like models would predict (Netzer 1990).
Quite possibly, supplementary heating of the kind proposed here for cooling-flow nebulae could account for the strong forbidden lines of LINERs in general, regardless of the ionizing source. Mechanical and conductive forms of heating probably operate constantly at some level in all kinds of photoionized nebulae. Usually, the photon fluxes incident on these nebulae overwhelm any other energy source. However, when the ambient pressure rises or the photon flux decreases, the ionization parameter drops, reducing the dominance of photoelectric heating. If mechanical or conductive processes transfer heat from a hot confining medium to photoionized clouds at the saturation rate (), then we would expect their contributions to become significant when , the ionization range characteristic of LINERs. A variety of physical processes, differing from one astrophysical environment to another, could conspire to produce this characteristic combination of low ionization and supplementary heating in many different situations. The spectral signatures of these objects would all look LINER-like, even though the underlying phenomena differ. Their only shared property would be a value of low enough for other forms of heating to augment photoelectric heating.
5 Summary
Our deep spectra of the cooling-flow nebula in Abell 2597 strongly constrain the possible ionizing mechanisms. The lack of [O III] 4363 emission and the modest [O III] 5007 ratio rule out shocks. The Balmer sequence indicates substantial reddening. After we correct for reddening, we find that the [O II] and [S II] temperatures agree, placing the nebula between 9,500 K and 12,000 K. Temperatures like this in low-ionization nebulae usually signify a hard photoionizing source that extends into the X-ray band, but the small He II 4686 / H ratio we observe shows that the role of photons eV must be very minor. Hot stars are the only plausible ionizing sources that remain.
Our finding that hot stars are the most likely ionizing source agrees with observations of excess blue light and dilution of stellar absorption features in cooling-flow nebulae. However, the hottest O stars are still too cool to generate the high temperatures and strong forbidden lines we observe. In a pure photoionization model, the observed line ratios require a blackbody-like spectrum exceeding 100,000 K with a luminosity of a few times . The photoelectric heating provided by O stars with effective temperatures of 50,000 K supplies only about half the necessary heating.
Conduction or some other mechanical form of heating might supplement photoelectric heating in cooling-flow nebulae and other LINERs. At the characteristic ionization parameter , the maximum heat flux from the confining medium is similar to the photoionizing energy flux. Heat sources like this might always be present in photoionized nebulae, at levels too low to make a difference. However, in low-ionization nebulae their contributions can grow significant, boosting the forbidden-line output, especially if the temperature of the surrounding medium exceeds K, as in cooling flows or the hot galactic winds expected from starbursts and AGNs.
M. D. thanks the Carnegie Observatories for the Carnegie Fellowship that enabled her to gather these data. The authors would also like to acknowldge Daniela Calzetti for donating her reddening-curve software, Ari Laor for an enlightening Christmas Eve message, and Michaela Voit for her continuing inspiration and enthusiasm.
References
- Allen (1995)
- (2) llen, S. 1995, MNRAS, 276, 947.
- Allen et al. (1993)
- (4) llen, S. W., Fabian, A. C., Johnstone, R. M., White, D. A., Daines, S. J., Edge, A. C., & Stewart, G. C. 1993, MNRAS, 262, 901
- Baade & Minkowski (1954)
- (6) aade, W., & Minkowski, R. 1954, ApJ, 119, 215.
- Baum (1992)
- (8) aum, S. A. 1992, in Clusters and Superclusters of Galaxies, ed. A. C. Fabian (Dordrecht: Kluwer), p. 171
- Begelman & Fabian (1990)
- (10) egelman, M. C., & Fabian, A. C. 1990, MNRAS, 244, 26P
- Binette et al. (1985)
- (12) inette, L., Dopita, M. A., & Tuohy, I. R. 1985, ApJ, 297, 476
- Boroson & Green (1992)
- (14) oroson, T. A., & Green, R. F. 1992, ApJS, 80, 109
- Braine et al. (1995)
- (16) raine, J., Wyrowski, F., Radford, S. J. E., Henkel, C., Lesch, H. 1995, A&A, 293, 315
- Burbidge & Burbidge (1965)
- (18) urbidge, M., & Burbidge, G. 1965, ApJ, 142, 1351.
- Burbidge et al. (1963)
- (20) urbidge, M., Burbidge, G., & Sandage, A. 1963, Rev. Mod. Phys., 35, 947.
- Cardiel et al. (1995)
- (22) ardiel, N., Gorgas, J., & Aragon-Salamanca, A. 1995, MNRAS, 277, 502.
- Cardiel et al. (1997)
- (24) ardiel, N., Gorgas, J., & Aragon-Salamanca, A. 1997, in Physical Processes in Cooling Flows, ed. N. Soker (San Francisco: Ast. Soc. Pac.), in press
- Cowie et al. (1980)
- (26) owie, L. L., Fabian, A. C., & Nulsen, P. E. J. 1980, MNRAS, 191, 399
- Cowie & McKee (1977)
- (28) owie, L. L., & McKee, C. F. 1977, ApJ, 211, 135
- Crawford & Fabian (1992)
- (30) rawford, C., & Fabian, A. C. 1992, MNRAS, 259, 265
- David et al. (1988)
- (32) avid, L. P., Bregman, J. N., & Seab, C. G. 1988, ApJ, 329, 66
- Donahue & Stocke (1994)
- (34) onahue, M. & Stocke, J. T. 1994, ApJ, 422, 459
- Donahue & Voit (1991)
- (36) onahue, M., & Voit, G. M. 1991, ApJ, 381, 361
- Donahue (1997)
- (38) onahue, M. 1997, in preparation
- Dopita & Sutherland (1995)
- (40) opita, M. A. & Sutherland, R. S. 1995, ApJS, 102, 161.
- Draine & Lee (1984)
- (42) raine, B. T., & Lee, H. M. 1984, ApJ, 285, 89
- Fabian (1994)
- (44) abian, A. C. 1994, ARA&A, 32, 277
- Fabian, Johnstone, & Daines (1994)
- (46) abian, A. C., Johnstone, R. M., & Daines, S. J. 1994, MNRAS, 271, 737
- Fabian & Nulsen (1977)
- (48) abian, A. C., & Nulsen, P. E. J. 1977, MNRAS, 180, 479
- Ferland (1993)
- (50) erland, G. J. 1993, University of Kentucky Department of Physics and Astronomy Internal Report
- Ferland, Fabian, & Johnstone (1994)
- (52) erland, G. J., Fabian, A. C., & Johnstone, R. M. 1994, MNRAS, 266, 399
- Filippenko (1996)
- (54) ilippenko, A. V. 1996, in The Physics of Liners in View of Recent Observations, ed. M. Eracleous, A. Koratkar, C. Leitherer, & L. Ho (San Francisco: Ast. Soc. Pac.), p. 17
- Fitzpatrick (1986)
- (56) itzpatrick, E. L. 1986, AJ, 92, 1068
- Friaca et al. (1997)
- (58) riaca, A. C. S., Goncalves, D. R., Jafelice, L. C., Jatenco-Pereira, V., & Opher, R. 1997, A&A, in press
- Hartigan et al. (1987)
- (60) artigan, P., Raymond, J., & Hartmann, L. 1987, ApJ, 316, 323
- Heckman et al. (1989)
- (62) eckman, T. M., Baum, S. A., van Breugel, W. J. M., & McCarthy, P. J. 1989, ApJ, 338, 48
- Ho (1996)
- (64) o, L. 1996, in The Physics of Liners in View of Recent Observations, ed. M. Eracleous, A. Koratkar, C. Leitherer, & L. Ho (San Francisco: Ast. Soc. Pac.), p. 103 in Clusters and Galaxies, ed. A. C. Fabian (Dordrecht: Kluwer), p. 73
- Hu et al. (1985)
- (66) u, E. M., Cowie, L. L., & Wang, Z. 1985, ApJS, 59, 447
- Hubble & Humason (1931)
- (68) ubble, E. & Humason, M. L. 1931, ApJ, 74, 43.
- Johnstone & Fabian (1988)
- (70) ohnstone, R. M. & Fabian, A. C. 1988, MNRAS, 233, 581.
- Johnstone et al. (1987)
- (72) ohnstone, R. M., Fabian, A. C., & Nulsen, P. E. J. 1987, MNRAS, 224, 75
- Lynds (1970)
- (74) ynds, R. 1970, ApJ, 159, L151.
- Mathews & Bregman (1978)
- (76) athews, W. G., & Bregman, J. N. 1978, ApJ, 224, 308
- McNamara, Bregman, & O’Connell (1990)
- (78) cNamara, B. R., Bregman, J. N., & O’Connell, R. W. 1990, ApJ, 360, 20
- (79)
- (80) cNamara, B. R., Jannuzi, B. T., Elston, R., Sarazin, C. L., & Wise, M. 1996a, ApJ, 469, 66
- McNamara & O’Connell (1989)
- (82) cNamara, B. R., & O’Connell, R. W. 1989, AJ, 98, 2018
- McNamara & O’Connell (1992)
- (84) cNamara, B. R., & O’Connell, R. W. 1992, ApJ, 393, 579
- (85)
- (86) cNamara, B. R., Wise, M., Sarazin, C. L., Jannuzi, B. T., & Elston, R. 1996b, ApJ, 466, L9 Nebulae, IAU Symp. 103, ed. D. R. Flower (Dordrecht: Reidel), p. 143
- Minkowski (1957)
- (88) inkowski, R. 1957, Radio Astronomy, IAU Symposium, ed. H. C. van der Hulst (Cambridge: Cambridge University Press), p. 107.
- Netzer (1990)
- (90) etzer, H. 1990, in Active Galactic Nuclei, ed. T. J.-L. Courvoisier and M. Mayor (Berlin: Springer-Verlag), p. 57
- O’Connell & McNamara (1989)
- (92) ’Connell, R. W. & McNamara, B. R. 1989, AJ, 98, 180
- O’Dea et al. (1994)
- (94) ’Dea, C. P., Baum, S. A., Maloney, P. R., Tacconi, L. S., & Sparks, W. B. 1994, ApJ, 422, 467
- O’Dea et al. (1994)
- (96) ’Dea, C. P., Baum, S. A., & Gallimore, J. 1994, ApJ, 436, 669 Astrophysics of Gaseous Nebulae and Active Galactic Nuclei (Mill Valley, CA: University Science Books)
- Pringle (1989)
- (98) ringle, J. E. 1989, MNRAS, 239, 479
- Shull & McKee (1979)
- (100) hull, J. M., & McKee, C. 1979, ApJ, 227, 131.
- Sparks (1992)
- (102) parks, W. 1992, ApJ, 399, 66.
- Voit (1991)
- (104) oit, G. M. 1991, ApJ, 377, 158
- Voit & Donahue (1990)
- (106) oit, G. M., & Donahue, M. 1990, ApJ, 360, L15.
- Voit, Donahue, & Slavin (1994)
- (108) oit, G. M., Donahue, M., & Slavin, J. D. 1994, ApJS, 95, 87
- White et al. (1991)
- (110) hite, D. A., Fabian, A. C., Johnstone, R. M., Mushotzky, R. F., & Arnuad, K. A. 1991, MNRAS, 252, 72
- Yan & Cohen (1995)
- (112) an, L., & Cohen, J. 1995, ApJ, 454, 54
| Observed | Line Flux & | ||
|---|---|---|---|
| Line ID | Wavelength | 1 Error | FWHM |
| (Å) | (10-15 erg s-1 cm-2) | (Å) | |
| OII 3727 | 4033.65 | 37. 1.0 | 13.1 |
| NeIII 3869 | 4186.3 | 1.4 0.10 | 11.5 |
| H 3888.1 | 4208.6 | 0.6 0.10 | 11.5 |
| H+NeIII 3966 | 4292.1 | 1.95 0.20 | 13.5 |
| SII 4069 | 4405.0 | 1.5 0.15 | 13.9 |
| H 4101 | 4437.8 | 1.7 0.15 | 13.9 |
| H 4340 | 4696.7 | 2.9 0.3 | 11.3 |
| OIII 4363 | |||
| HeII 4686 | 5073. | 0.26 0.04 | |
| OIII 4969 | 5367.0 | 1.4 0.2 | 14.0 |
| H 4861 | 5260.4 | 8.4 0.2 | 14.0 |
| OIII 5007 | 5420.8 | 4.8 0.3 | 14.0 |
| NI 5200 | 5628.5 | 2.7 0.14 | 14.8 |
| OI 6300 | 6817.8 | 10.9 0.1 | 14.7 |
| OI 6363bbAtmospheric absorption ate into the [OI] 6363 feature. | 6886.9 | 2.37 0.07 | 14.7 |
| NII 6548 | 7086. | 10.6 0.09 | 15.5 |
| H 6563 | 7102.35 | 35.4 0.12 | 15.5 |
| NII 6584 | 7124.48 | 29.5 0.12 | 15.5 |
| HeI 6678 | 7226. | 0.4 0.1 | 16.2 |
| SII 6717 | 7268.2 | 20.0 0.1 | 16.2 |
| SII 6731 | 7284.3 | 16.0 0.11 | 16.2 |
| CaII 7290 | 7887.0 | 0.7 0.1 | 20.0 |
| OII+CaII 7320 | 7924.5 | 2.0 0.2 | 20.0 |