Advances in the Theory of Brown Dwarfs and Extrasolar Giant Planets
Abstract
We have developed a new non–gray theory of the evolution, spectra, and colors of extrasolar giant planets (EGPs) and brown dwarfs that reveals their exotic nature and uniqueness. We have discovered that the fluxes of such objects for Teffs from 1300 K to 100 K can be spectacularly higher in the near infrared bands than black body values and that their infrared colors are quite blue. As a consequence, EGPs and brown dwarfs reside in hitherto unoccupied realms of the H–R diagram and may be more easily found with current and planned telescopes than previously imagined.
keywords:
extrasolar planets, brown dwarfs, colors, spectra1 Introduction
Doppler spectroscopy has now revealed about 20 objects in the giant planet/brown dwarf regime, including companions to Boo, 51 Peg, And, 55 Cnc, CrB, 70 Vir, 16 Cyg, and 47 UMa (Butler et al. 1997; Cochran et al. 1997; Marcy & Butler 1996; Butler & Marcy 1996; Mayor & Queloz 1995; Latham et al. 1989). Furthermore, the brown dwarf, Gl229B, has been discovered (Oppenheimer et al. 1995; Nakajima et al. 1995; Matthews et al. 1996; Geballe et al. 1996). Gl229B is a milestone because it displays methane spectral features and low surface fluxes that are unique to objects with effective temperatures (in this case, Teff950 K) below the solar–metallicity main sequence edge. In 1995 and 1996, we published a gray theory of the evolution of extrasolar giant planets (EGPs) with masses from 0.3 to 15 , where denotes a Jupiter mass (0.001 ) (Burrows et al. 1995; Saumon et al. 1996; Guillot et al. 1996).
We (Burrows et al. 1997) have now developed a non–gray theory that encompasses the EGP/brown dwarf domains from 0.3 to 70 , in aid of the direct searches for substellar objects, be they “planets” or brown dwarfs, being planned (TOPS and ExNPS reports; Leger et al. 1993). We have limited themselves to solar–metallicity objects in isolation and ignored the effects of stellar insolation (Guillot et al. 1996). In this communication, we summarize some of the results of this extensive new study, to which we refer the reader for details.
2 Modeling Technique
The opacities we employed are from extensions of the HITRAN database (Rothman et al. 1992, 1997), the GEISA database (Husson et al. 1997), and theoretical calculations (Tyuterev et al. 1994; Goorvitch 1994; Tipping 1990; Wattson & Rothman 1992; L. R. Brown, private communication). For water, we used the new Partridge & Schwenke H2O database. Our line list includes lines for CH4 and CH3D, lines for CO, lines for NH3, lines for PH3, and lines for H2S. Modeled continuum opacity sources include and opacity and collision–induced absorption (CIA) of H2 and helium (Borysow & Frommhold 1990; Zheng & Borysow 1995). The latter is a direct function of pressure and a major process in EGP/brown dwarf atmospheres.
To calculate atmosphere profiles and spectra, we used the k–coefficient method (Goody et al. 1989; Lacis & Oinas 1991), widely used in planetary atmosphere modeling (see M. Marley, this volume). This is not the ODF technique (Saxner & Gustafsson 1984) and gives excellent agreement with full line–by–line computations of atmospheric transmission (Grossman & Grant 1992,1994a,1994b).
Chemical equilibrium calculations were performed with the ATLAS code and data from Kurucz (1970). The Kurucz reaction constants are inaccurate at low temperatures, but the NH3 N2 and CH4 CO conversions that occur in EGPs and brown dwarfs do so in regions of space for which the Kurucz reaction constants are accurate. Condensation of NH3, H2O, Fe, and MgSiO3 was included using data from various sources, including Eisenberg & Kauzmann (1969), the Handbook of Chemistry and Physics (1993), and Lange’s Handbook of Chemistry (1979). Following Fegley & Lodders (1994, 1996), we assumed that Al, Ca, Ti and V were removed either by condensation or were dissolved in silicate grains at about the MgSiO3 condensation temperature.
3 Evolutionary Models
In Burrows et al. (1995) and Saumon et al. (1996), we published cooling curves for EGPs and small brown dwarfs that were based upon our then–current atmosphere models. In Burrows et al. (1997), we have updated the H2 CIA, H2O, and CH4 opacities and the radiative transfer algorithm, as well as the chemical equilibrium calculations. Consequently, the evolutionary tracks have changed, but generally by no more than 10% in luminosity at any given time, for any given mass.
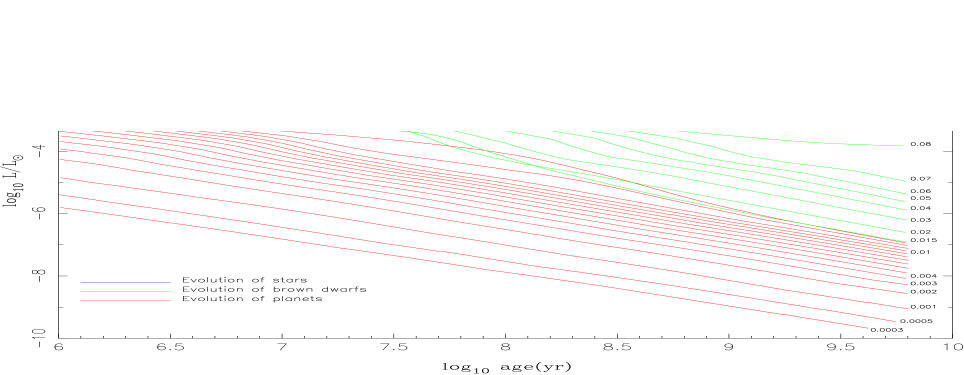
Figure 1 depicts the updated luminosity versus time plots for objects from Saturn’s mass (0.3 ) to 0.2 . It covers three orders of magnitude in mass and encapsulates the characteristics of the entire family of substellar objects and the transition to stars.
Tables 1–3 summarize the evolution of various structural parameters versus time for EGP masses of 4 , 15 , and 20 .
| (Gyr) | (K) | ( cm) | (K) | (g cm | ||
|---|---|---|---|---|---|---|
| \tableline | ||||||
| (Gyr) | (K) | ( cm) | (K) | (g cm | ||
|---|---|---|---|---|---|---|
| \tableline | ||||||
| (Gyr) | (K) | ( cm) | (K) | (g cm | ||
|---|---|---|---|---|---|---|
| \tableline | ||||||
The early plateaux in Figure 1 between 106 years and 108 years are due to deuterium burning, where the initial deuterium mass fraction was taken to be 210-5. Deuterium burning occurs earlier, is quicker, and is at higher luminosity for the more massive models, but can take as long as 108 years for a 15 object. The mass below which less than 50% of the “primordial” deuterium is burnt is 13 (Burrows et al. 1995). On this figure, we have arbitrarily classed as “planets” those objects that do not burn deuterium and as “brown dwarfs” those that do burn deuterium, but not light hydrogen. While this distinction is physically motivated, we do not advocate abandoning the definition based on origin. Nevertheless, the separation into M dwarfs, “brown dwarfs”, and giant “planets” is useful for parsing by eye the information in the figure.
In Figure 1, the bumps between 10-4 and 10-3 and between 108 and 109 years, seen on the cooling curves of objects from 0.03 to 0.08 , are due to silicate and iron grain formation. These effects, first pointed out by Lunine et al. (1989), occur for Teffs between 2500 K and 1300 K. Since grain and cloud models are problematic, there still remains much to learn concerning their role and how to model them (see F. Allard, this volume).
Bolometric luminosity and age can be used to yield mass and radius. Effective temperature and mass can provide age and luminosity. Fits to the UKIRT spectrum of Gl229B (Marley et al. 1996; Allard et al. 1996; Tsuji et al. 1996) give Teff900–1000 K and g105±0.5 cm s-2. One obtains a mass between 15 and 60 , with a best value near 35 , and an age between 108.5 and 109.5 years. The wide range in inferred Gl229B parameters is a direct consequence of the weakness of our current constraints on gravity.
3.1 Metallicity Dependence
Recently, we have completed a set of evolutionary models that explore the characteristics of the edge of the main sequence as a function of metallicity and atmosphere model (Saumon et al. 1997, in preparation). As a part of this effort, we generated 1010–year isochrones for models with metallicities of solar, 0.1solar, 0.01solar, 0.001solar, and zero (Saumon et al. 1994), employing atmosphere models of our own manufacture, as well as those from Alexander (1996) and Allard & Hauschildt (1995). Figure 2 depicts the nature of the transition from brown dwarfs to M dwarfs for this range of metallicities.
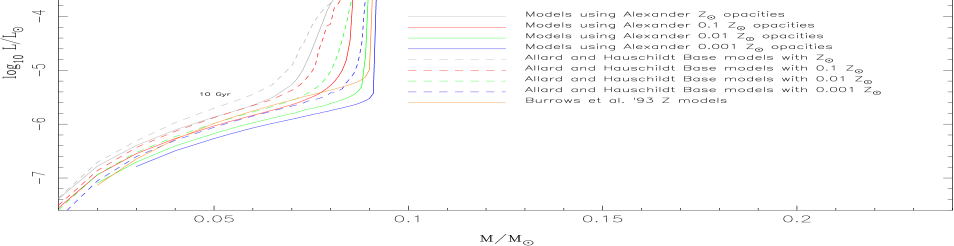
We display these numerical data to caution the reader that the metallicity dependence is systematic and non–trivial. Figure 2 demonstrates clearly that the mass/luminosity slope at the boundary is a strong function of log10Z. In particular, the metallicity dependence will be a factor in the proper conversion of luminosity functions into mass functions for objects in the field, in open clusters, and in globular clusters.
4 EGP and Brown Dwarf Spectra
There are a few major aspects of EGP/brown dwarf atmospheres that bear listing and that uniquely characterize them. Below Teffs of 1200 K, the dominant equilibrium carbon molecule is CH4, not CO, and below 600 K the dominant nitrogen molecule is NH3, not N2. The major opacity sources are H2, H2O, CH4, and NH3. For Teffs below 400 K, water clouds form at or above the photosphere and for Teffs below 200 K, ammonia clouds form (viz., Jupiter). Collision–induced absorption of H2 partially suppresses emissions longward of 10 m. The holes in the opacity spectrum of H2O that define the classic telluric IR bands also regulate much of the emission from EGP/brown dwarfs in the near infrared. Importantly, the windows in H2O and the suppression by H2 conspire to force flux to the blue for a given Teff. The upshot is an exotic spectrum enhanced relative to the black body value in the and bands (1.2 m and 1.6 m, respectively) by as much as two to ten orders of magnitude, depending upon Teff. In addition, as Teff decreases below 1000 K, the flux in the band (5 m) is progressively enhanced relative to the black body value. While at 1000 K there is no enhancement, at 200 K it is near 105. Hence, the , , and bands are the premier bands in which to search for cold substellar objects. Eventhough band (2.2 m) fluxes are generally higher than black body values, H2 and CH4 absorption features in the band decrease its importance relative to and . As a consequence of the increase of atmospheric pressure with decreasing Teff, the anomalously blue and colors get bluer, not redder.
Note that the presence or absence of clouds strongly affects the reflection albedos of EGPs and brown dwarfs. In particular, when there are clouds at or above the photosphere, the albedo in the optical is high. Conversely, when clouds are absent, the albedo in the mostly absorbing atmosphere is low. Recall, however, that in Burrows et al. (1997) we ignored reflection effects.
Figure 3 depicts the object’s surface flux versus wavelength for representative Teffs from 130 K to 1000 K at a gravity of cm s-2.
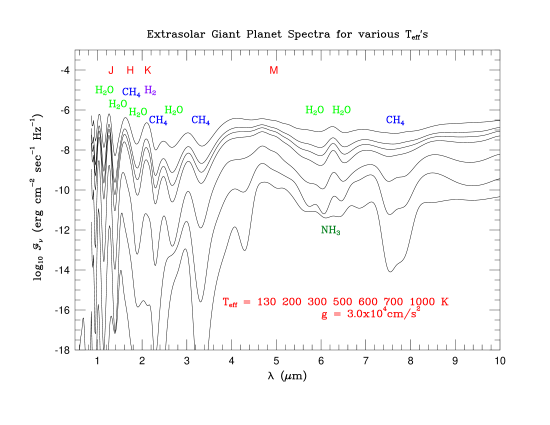
The corresponding masses range from 13 to 16 and the corresponding ages range from 0.25 Gyrs to 7 Gyrs. Superposed on Figure 3 are the positions of various prominent molecular bands and the , , , and bands. As is clear from the figure, H2O defines much of the spectrum, but CH4 and H2 modify it in useful ways. CH4 absorption features near 1.65 m, 2.2 m, and 3.3 m are particularly relevant, the latter two decreasing the and (3.5 m) band fluxes, respectively. NH3 near 6 m becomes important below 250 K and the CH4 feature around 7.8 m deepens with decreasing Teff. However, it should be noted that in Jupiter the 7.8 m absorption feature is inverted into a stratospheric emission feature. Since a stratosphere requires UV flux from the primary or another energy deposition mechanism, our models do not address this possibility. In addition, we find that H2O and NH3 features near 6 m make the band from 5.5 to 7 m less useful for searching for brown dwarfs and EGPs.
Figure 4 depicts spectra between 1 m and 40 m at a detector 10 parsecs away from objects with age 1 Gyr and masses from 1 through 40 . Superposed are the corresponding black body curves and the putative sensitivities for the three NICMOS cameras (Thompson 1992), ISO (Benvenuti et al. 1994), SIRTF (Erickson & Werner 1992), and Gemini/SOFIA (Mountain et al. 1992; Erickson 1992). Figure 4 demonstrates how unlike a black body an EGP spectrum is. Note on Figure 4 the H2–induced suppression at long wavelengths and the enhancement at shorter wavelengths. For example, the enhancement at 5 m for a 1 Gyr old, 1 extrasolar planet is by four o rders of magnitude.
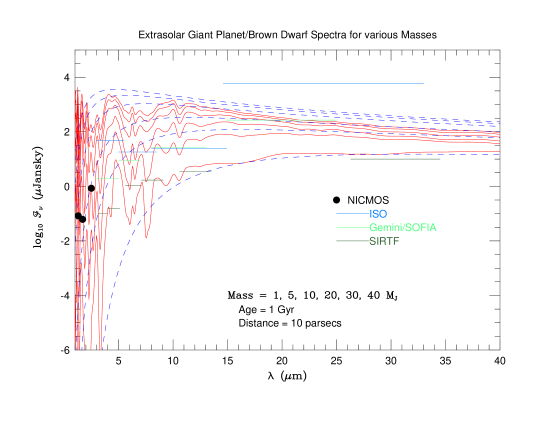
Comparison with the sensitivities reveals that the range for detection by SIRTF at 5 m of a 1 Gyr old, 1 object in isolation is near 100 parsecs. The range for NICMOS in for a 1 Gyr old, 5 object is approximately 300 parsecs, while for a coeval 40 object it is near 1000 parsecs. These are dramatic numbers that serve to illustrate both the promise of the new detectors and the enhancements we theoretically predict.
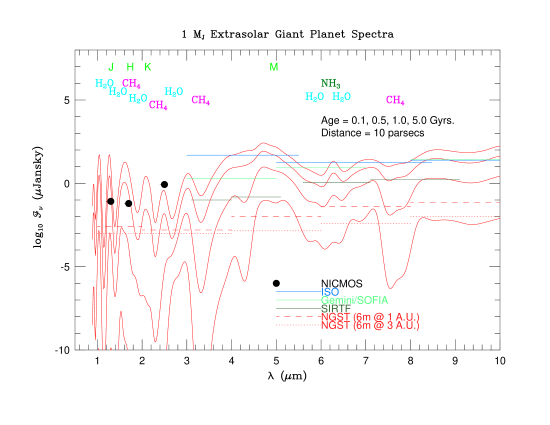
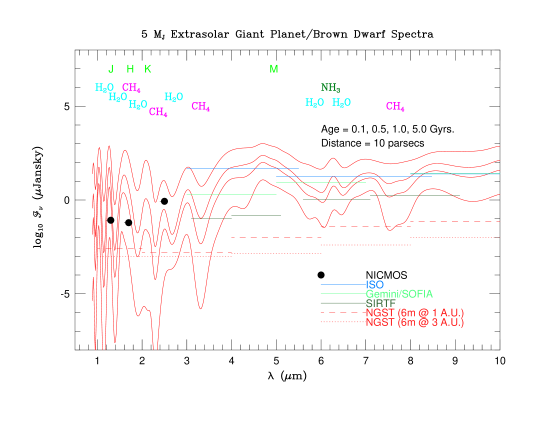
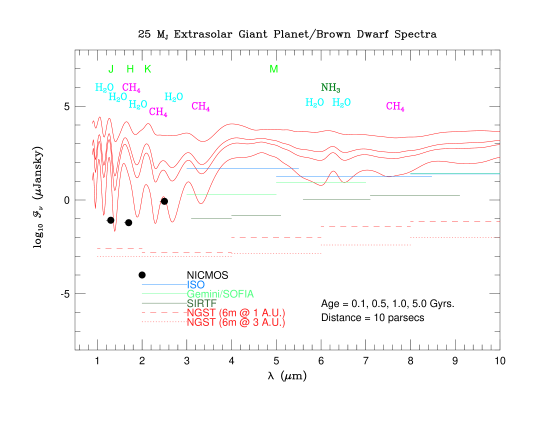
Figures 5–7 portray the evolution from 0.1 Gyr to 5 Gyr of the spectra from 1 m to 10 m of objects with masses of 1, 5, and 25 . The higher curves are for the younger ages. These cooling curves summarize EGP/brown dwarf spectra and their evolution. Figure 7 suggests that SIRTF will be able to see at 5 m a 5 Gyr old, 25 object in isolation out to 500 parsecs and that NICMOS will be able to see at or a 0.1 Gyr old object with the same mass out to 3000 parsecs. Note that the and flux enhancements over black body values for the 1 model after 0.1 Gyr are at least ten orders of magnitude. However, it must be remembered that these models do not include a reflected light component from a primary.
5 Infrared Colors
To calculate IR colors, we employed the transmission curves of Bessell & Brett (1988) and Bessell (1990) to define the photometric bandpasses and the model of Vega by Dreiling & Bell (1980) for the calibration of the magnitude scale. Figure 8 is a representative color–magnitude diagram for objects with masses from 3 to 40 , for ages of 0.5, 1.0, and 5.0 Gyr. Figure 9 is a color–color diagram for the same models. Tables 4 & 5 depict the infrared magnitudes and colors for various combinations of mass and age. As Table 4 and Figure 8 suggest, the brightnesses in the near IR are quite respectable.


For comparison, included in these figures are the corresponding black body curves, hot, young brown dwarf or extremely late M dwarf candidates such as LHS2924, GD 165B, Calar 3, and Teide 1 (Kirkpatrick, Henry, & Simons 1994,1995; Zapatero-Osorio, Rebolo, & Martin 1997), and a sample of M dwarfs from Leggett (1992). These figures collectively illustrate the unique color realms occupied by extrasolar giant planets and brown dwarfs.
Figure 8 portrays the fact that the versus infrared H–R diagram loops back to the blue below the edge of the main sequence and is not a continuation of the M dwarf sequence into the red. For versus , the difference between the black body curves and the model curves is between 3 and 10 magnitudes. Gl229B fits nicely on these theoretical isochrones. The suppression of by H2 and CH4 features is largely responsible for this anomalous blueward trend with decreasing mass and Teff. The fit to Gl229B in is not as good. This is also true of the fit to . Since both and have significant CH4 features in them, we surmise that incompleteness or errors in the CH4 opacity database is the cause. actually reddens with decreasing Teff, but only marginally and is still 1.5 to 4 magnitudes bluer than the corresponding black body. That the and colors of EGPs and brown dwarfs are many magnitudes blueward of black bodies is a firm result.
| Mass () | Age (Gyr) | ||||||
|---|---|---|---|---|---|---|---|
| \tableline | |||||||
| 40 | 0.5 | 13.83 | 13.64 | 13.80 | 12.17 | 11.86 | 11.32 |
| 1.0 | 14.97 | 14.67 | 15.17 | 13.06 | 12.41 | 12.25 | |
| 5.0 | 17.46 | 16.98 | 18.59 | 14.82 | 13.71 | 13.96 | |
| 30 | 0.5 | 14.85 | 14.52 | 14.98 | 12.94 | 12.25 | 12.09 |
| 1.0 | 15.75 | 15.35 | 16.13 | 13.62 | 12.73 | 12.77 | |
| 5.0 | 18.39 | 17.85 | 20.03 | 15.54 | 14.18 | 14.46 | |
| 20 | 0.5 | 15.88 | 15.42 | 16.24 | 13.71 | 12.69 | 12.78 |
| 1.0 | 16.95 | 16.43 | 17.71 | 14.51 | 13.28 | 13.51 | |
| 5.0 | 20.28 | 19.55 | 22.90 | 16.81 | 14.95 | 15.09 | |
| 10 | 0.5 | 17.95 | 17.37 | 19.08 | 15.31 | 13.71 | 13.97 |
| 1.0 | 19.27 | 18.70 | 21.19 | 16.27 | 14.41 | 14.59 | |
| 5.0 | 23.76 | 22.88 | 28.33 | 19.22 | 16.38 | 15.91 | |
| 5 | 0.5 | 20.61 | 20.08 | 23.12 | 17.26 | 14.95 | 14.95 |
| 1.0 | 23.21 | 22.43 | 27.09 | 18.86 | 15.94 | 15.62 | |
| 5.0 | 29.69 | 28.21 | 37.20 | 22.83 | 18.39 | 16.80 | |
| 3 | 0.5 | 22.79 | 22.14 | 26.25 | 18.64 | 15.76 | 15.47 |
| 1.0 | 24.82 | 24.02 | 29.40 | 19.92 | 16.58 | 15.93 | |
| 5.0 | 34.63 | 32.10 | 45.21 | 25.43 | 19.48 | 17.50 |
†We employed the transmission curves of Bessel & Brett (1988) and Bessel (1990) to define the photometric bandpass and the model of Vega by Dreiling & Bell (1980) for the calibration of the magnitude scale.
| Mass () | Age (Gyr) | |||||
|---|---|---|---|---|---|---|
| \tableline | ||||||
| 40 | 0.5 | 0.19 | 0.03 | -0.16 | 1.63 | 0.54 |
| 1.0 | 0.30 | -0.20 | -0.50 | 2.11 | 0.16 | |
| 5.0 | 0.49 | -1.13 | -1.62 | 3.78 | -0.25 | |
| 30 | 0.5 | 0.34 | -0.12 | -0.46 | 2.04 | 0.17 |
| 1.0 | 0.40 | -0.38 | -0.78 | 2.50 | -0.04 | |
| 5.0 | 0.54 | -1.64 | -2.18 | 4.49 | -0.28 | |
| 20 | 0.5 | 0.46 | -0.36 | -0.82 | 2.54 | -0.08 |
| 1.0 | 0.52 | -0.76 | -1.28 | 3.20 | -0.22 | |
| 5.0 | 0.73 | -2.62 | -3.35 | 6.09 | -0.14 | |
| 10 | 0.5 | 0.58 | -1.13 | -1.71 | 3.77 | -0.26 |
| 1.0 | 0.57 | -1.93 | -2.50 | 4.93 | -0.18 | |
| 5.0 | 0.88 | -4.57 | -5.45 | 9.12 | 0.47 | |
| 5 | 0.5 | 0.54 | -2.50 | -3.04 | 5.86 | 0.00 |
| 1.0 | 0.77 | -3.89 | -4.66 | 8.24 | 0.32 | |
| 5.0 | 1.48 | -7.51 | -8.99 | 14.38 | 1.59 | |
| 3 | 0.5 | 0.65 | -3.46 | -4.11 | 7.61 | 0.30 |
| 1.0 | 0.79 | -4.58 | -5.37 | 9.47 | 0.65 | |
| 5.0 | 2.53 | -10.58 | -13.11 | 19.78 | 1.98 |
†We employed the transmission curves of Bessel & Brett (1988) and Bessel (1990) to define the photometric bandpass and the model of Vega by Dreiling & Bell (1980) for the calibration of the magnitude scale.
6 Conclusions and Future Work
Soon, planet and brown dwarf searches will be conducted by NICMOS, SIRTF, Gemini/SOFIA, ISO, NGST, LBT (Angel 1994), the MMT (Angel 1994), the VLT, Keck I & II, COROT (transits), DENIS, 2MASS, UKIRT, and IRTF, among other platforms. For close companions, advances in adaptive optics, interferometry, and coronagraphs will be necessary. The models we have generated of the colors and spectra of EGPs and brown dwarfs are in aid of this quest. We have created a general non–gray theory of objects from 0.3 to 70 below 1300 K, but the opacity of CH4 and a proper treatment of silicate/iron, H2O, and NH3 clouds are future challenges that must be met before the theory is complete. Since the near IR signature of nearby substellar companions will be significantly altered by a reflected component, a theory of albedos in the optical and in the near IR must be developed. In particular, it will be useful in the future to predict the signatures of specific systems with known orbital characteristics, primaries, and ages, such as Boo, 51 Peg, And, 55 Cnc, CrB, 70 Vir, 16 Cyg, and 47 UMa.
It is rare that Nature conspires to make the objects of astronomical study easier to detect than simple estimates first imply. However, our calculations indicate that, whether they exist in profusion, or are merely a minority constituent of the solar neighborhood, EGPs and brown dwarfs might be detected and characterized with a bit more ease than originally feared.
Acknowledgements.
We thank F. Allard, I. Baraffe, G. Chabrier, S. Kulkarni, J. Liebert, A. Nelson, B. Oppenheimer, and N. Woolf for a variety of useful contributions. This work was supported under NSF grants AST-9318970 and AST-9624878 and under NASA grants NAG5-2817, NAGW-2250, and NAG2-6007.References
- [1]
- [2] llard, F., & Hauschildt, P.H. 1995, ApJ, 445, 433
- [3] llard, F., Hauschildt, P.H., Baraffe, I., & Chabrier, G. 1996, ApJ, 465, L123
- [4] llard, F., Hauschildt, P. H., Alexander, D. R. & Starrfield, S. 1997, ARA&A, 35, 137
- [5] lexander, D. 1996, private communication
- [6] ngel, J.R.P. 1994, Nature, 368, 203
- [7] envenuti, P. et al. 1994, in ESA’s Report to the 30th COSPAR Meeting, ESA SP-1169, Paris, p. 75 (ISO)
- [8] orysow, A. & Frommhold, L. 1990, ApJ, 348, L41
- [9] urrows, A., Hubbard, W.B., Saumon, D., & Lunine, J.I. 1993, ApJ, 406, 158
- [10] urrows, A., Saumon, D., Guillot, T., Hubbard, W.B., & Lunine, J.I. 1995, Nature, 375, 299
- [11] urrows, A., Marley, M., Hubbard, W.B., Lunine, J.I., Guillot, T., Saumon, D., Freedman, R., Sudarsky, D., & Sharp, C. 1997, submitted to Ap. J.
- [12] essell, M.S. 1990, PASP, 102, 1181
- [13] essell, M.S., & Brett, J.M. 1988, PASP, 100, 1134
- [14] utler, R. P. & Marcy, G. W. 1996, ApJ, 464, L153
- [15] utler, R. P., Marcy, G. W., Williams, E., Hauser, H., & Shirts, P. 1997, ApJ, 474, L115
- [16] ochran, W.D., Hatzes, A.P., Butler, R.P., & Marcy, G. 1997, Science, in press
- [17] reiling, L.A. & Bell, R.A. 1980, ApJ, 241, 736
- [18] isenberg, D. & Kauzmann, W. 1969, The Structure and Properties of Water (New York: Oxford University Press)
- [19] rickson, E. F. 1992, Space Science Reviews, 61, 61 (SOFIA)
- [20] rickson, E. F. & Werner, M. W. 1992, Space Science Reviews, 61, 95 (SIRTF)
- [21] xNPS: A Road Map for the Exploration of Neighboring Planetary Systems, JPL Publication 96–22, August 1996
- [22] egley, B. & Lodders, K. 1994, Icarus, 110, 117
- [23] egley, B. & Lodders, K. 1996, ApJ, 472, L37
- [24] eballe, T. R., Kulkarni, S. R., Woodward, C. E., & Sloan, G. C. 1996, ApJ, 467, L101
- [25] oody, R., West, R., Chen, L., & Crisp, D. 1989, J. Quant. Spectr. Rad. Transfer, 42, 539
- [26] oorvitch, D. 1994, ApJS, 95, 535
- [27] rossman, A.S. & Grant, K. 1992, LLNL Rept. UCRL-ID-111805
- [28] rossman, A.S. & Grant, K. 1994a, LLNL Rept. UCRL-ID-116533
- [29] rossman, A.S. & Grant, K. 1994b Eighth Conference on Atmospheric Radiation, 97, American Meterological Society.
- [30] uillot, T., Burrows, A., Hubbard, W.B., Lunine, J.I., & Saumon, D. 1996, ApJ, 459, L35
- [31] andbook of Chemistry and Physics, 74th Edition, 1993, ed. D.R. Lide, CRC Press Inc.
- [32] usson, N., Bonnet, B., Scott, N.A., & Chedin, A. 1994, J. Quant. Spect. Rad. Transfer, 48, 509
- [33] SO Observer’s Manual Version 2.0, 31 March 1994, prepared by the ISO Science Operations Team, p6
- [34] irkpatrick, J.D., Henry, T.J., & Simons, D.A. 1994, AJ, 108, 1437
- [35] irkpatrick, J.D., Henry, T.J., & Simons, D.A. 1995, AJ, 109, 797
- [36] urucz, R.L., 1970, Smithsonian Obs. Spec. Rep., 309, 1-291
- [37] acis, A.A. & Oinas, V. 1991, J. Geophys. Res., 96, 9027
- [38] ange’s Handbook of Chemistry, 1979, ed. J.A. Dean, McGraw-Hill Book Company, New-York
- [39] atham, D. W., Mazeh, T., Stefanik, R.P., Mayor, M., & Burki G. 1989, Nature, 339, 38
- [40] eger, A., et al. 1993, Darwin Mission Concept, proposal to ESA
- [41] eggett, S.K. 1992, ApJS, 82, 351
- [42] arcy, G. W. & Butler, R. P. 1996, ApJ, 464, L147
- [43] arley, M., Saumon, D., Guillot, T., Freedman, R.S., Hubbard, W.B., Burrows, A., & Lunine, J.I. 1996, Science, 272, 1919
- [44] atthews, K., Nakajima, T., Kulkarni, S.R., & Oppenheimer, B.R. 1996, AJ, 112, 1678
- [45] ayor, M. & Queloz, D. 1995, Nature, 378, 355
- [46] ountain, M., R. Kurz, R., & Oschmann, J. 1994, in The Gemini 8-m Telescope Projects, S.P.I.E. Proceedings on Advanced Technology Optical Telescopes V, 2199, p. 41 (Gemini)
- [47] akajima, T., Oppenheimer, B.R., Kulkarni, S.R., Golimowski, D.A., Matthews, K., & Durrance, S.T. 1995, Nature, 378, 463
- [48] ppenheimer, B.R., Kulkarni, S.R., Matthews, K., & Nakajima, T. 1995, Science, 270, 1478
- [49] artridge, H. & Schwenke, D.W. 1997, J. Chem. Phys., 106, 4618
- [50] othman, L.S., Gamache, R.R., Tipping, R.H., Rinsland, C.P., Smith, M.A.H., Benner, D.C., Malathy Devi, V., Flaud, J.-M., Camy-Peyret, C., Perrin, A., Goldman, A., Massie, S.T., Brown, L.R., & Toth, R.A. 1992, J. Quant. Spect. Rad. Transfer, 48, 469.
- [51] othman, L.S., Wattson, R.B., Gamache, R.R., Goorvitch, D., Hawkins, R.L., Selby, J.E.A., Cambry-Peyret, C., Flaud, J.-M., Schroeder, J., & McCann, A. 1997, J. Quant. Spect. Rad. Transfer, submitted
- [52] aumon, D., Bergeron, P., Lunine, J.I., Hubbard, W.B. & Burrows, A. 1994, ApJ, 424, 333
- [53] aumon, D., Hubbard, W.B., Burrows, A., Guillot, T., Lunine, J.I., & Chabrier, G. 1996, ApJ, 460, 993
- [54] axner, M. & Gustafsson, B. 1984, A&A, 140, 334
- [55] hompson, R. 1992, Space Science Reviews, 61, 69 (NICMOS)
- [56] ipping, R. 1990, Report on Calculation of Spectroscopic Parameters for Diatomic Molecules of Atmospheric Interest, Univ. of Alabama Report, Dept. of Physics and Astronomy
- [57] OPS: Toward Other Planetary Systems, NASA Solar System Exploration Division, Washington, D.C., 1992
- [58] suji, T., Ohnaka, W., Aoki, W., & Nakajima, T. 1996, A&A, 308, L29
- [59] yuterev, Vl.G., Babikov, Yu.L., Tashkun, S.A., Perevalov, V.I., Nikitin, A., Champion, J.-P., Wegner, Ch., Pierre, C., Pierre, G., Hilico, J.-C., & Loete, M. 1994, J. Quant. Spect. Rad. Transfer, 52, 459
- [60] attson, R.B., and Rothman L.S. 1992, J. Quant. Spectr. Rad. Transfer, 48, 763
- [61] apatero-Osorio, M.R., Rebolo, R., & Martin, E.L. 1997, A&A, 317, 164
- [62] heng, C. & Borysow, A. 1995, Icarus, 113, 84
- [63]