OG 4.1.8
THE DETECTION OF TEV GAMMA RAYS
FROM CRAB USING
THE TELESCOPE ARRAY PROTOTYPE
(The Telescope Array Collaboration)
S.Aiso3, M.Chikawa9, Y.Hayashi1, N.Hayashida, K.Hibino4, H.Hirasawa, K.Honda5,
N.Hotta14, N.Inoue3, F.Ishikawa, N.Ito1, S.Kabe10, F.Kajino2, T.Kashiwagi4,
S.Kawakami1, Y.Kawasaki1, N.Kawasumi5, H.Kitamura8, K.Kuramochi17, K.Kurata2,
E.Kusano3, H.Lafoux, E.C.Loh6, Y.Matsubara12, T.Matsuyama1, Y.Mizumoto11,
K.Mizutani3, M.Nagano, D.Nishikawa, J.Nishimura4, M.Nishizawa16, T.Ouchi, H.Ohoka,
M.Ohnishi, To.Saito15, N.Sakaki, M.Sakata2, K.Sakumoto18 M.Sasaki, M.Sasano1,
H.Shimodaira, A.Shiomi3, P.Sokolsky6, T.Sugiyama2, T.Takahashi1, S.Taylor6, M.Teshima,
I.Tsushima5, Y.Uchihori7, T.Yamamoto, Y.Yamamoto2, S.Yoshida, H.Yoshii13, and T.Yuda
Institute for Cosmic Ray Research, University of Tokyo, Tokyo 188, Japan.
1Department of Physics, Osaka City University, Osaka 558, Japan.
2Department of Physics, Konan University, Kobe 658, Japan.
3Department of Physics, Saitama University, Urawa 338, Japan.
4Department of Engineering, Kanawaga University, Yokohama 221, Japan.
5Faculty of Education, Yamanashi University, Kofu 400, Japan
6Department of Physics, University of Utah, USA
7The 3rd Research Group, National Institute of Radiological Sciences, Chiba 263, Japan
8Department of Physics, Kobe University, Kobe 657, Japan
9Research Institute for Science and Technology, Kinki University, Osaka 577, Japan
10National Laboratory of High Energy Physics, Tsukuba 305 ,Japan
11National Astronomical Observatory, Tokyo 181, Japan
12Solar-Terrestrial Environment Laboratory, Nagoya University, Nagoya 464-1, Japan
13Faculty of General Education, Ehime University, Ehime 790, Japan
14Faculty of Education, Utsunomiya University, Utsunomiya 321, Japan
15Tokyo Metropolitan Colleage of Aeronautical Engineering, Tokyo 116, Japan
16National Center for Science Information System, Tokyo 112, Japan
17Informational Communication, KOKUSAI Junior College, Tokyo 165, Japan
18Faculty of Science and Technology, Meisei University, Tokyo 191, Japan
ABSTRACT
The Telescope Array prototype detectors were installed at Akeno Observatory and at the Utah Fly’s Eye site. Using these detectors, we have observed the Crab Nebula and AGN’s since the end of 1995. The successful detections of TeV gamma rays from Crab Nebula and Mkn501 are reported.
1.INTRODUCTION
The physics objectives of the Telescope Array are the studies of Ultra High Energy Cosmic Rays and Very High Energy Gamma Rays (Teshima et al. 1992). The development work is going on at Akeno and at the Fly’s Eye site in Utah, where the prototype detectors have been installed. The seven telescopes array is under construction at Utah, and three are in operation. With these prototype detectors, we have carried out the observations of the Crab nebula and AGN’s in the TeV gamma ray mode. We will report the Crab observation results from Akeno and Utah, and Mkn501 flares observed at Utah site during March, April and May in 1997.
2.EXPERIMENT
The seven telescope array, telescope array prototype, is under construction at the Fly’s Eye site at Cedar Mountain in Utah. The altitude is 1,600 m above sea level, and the geographical position is N and W. Seven telescopes will be arranged at the grid of a regular hexagon with a separation of 70m. Three telescopes are already in operation. The array will be in full operation in this autumn.
Telescopes are protected in the daytime by shelters in order to avoid dust, rain and light. Telescopes and shelters can be controlled from the counting room located near the center of the array. Each telescope has a 3 m diameter dish which consists of nineteen hexagonal segment mirrors. The effective mirror area in each telescope is 6 and the reflectivity is about 90 % at 400 nm. The 256 channel cameras with 0.25 degree pixels are mounted on the focal plane of the telescopes. We employed multi anode photomultipliers (MAPMT) having 4 pixels(22). In each MAPMT, a 4 mm thick BG3 filter is attached on the PMT window. The filter is used as a light guide as well as an optical filter. The filter has a transmission of 90 % for the wavelength from 300 to 450 nm.

The signals from the PMT are amplified just behind the PMT camera and then are fed to the data acquisition system mounted on the telescope driving system. The pulse height and the pulse timing of the signals from PMT are measured in each event. The rise time of signals is about 10nsec and the TDC values are digitized with 1 nsec accuracy. With the TDC information, the background photon noise can be efficiently eliminated in the image processing. The threshold level of discriminators corresponds to four photo-electrons and the single PMT tube rate is 5KHz. We require four hit channels for triggering the events. The resultant cosmic ray event rate in each telescope becomes about 4 5 Hz. With the simulation analysis, the energy threshold for the detectable gamma rays is found to be 600 GeV. The new data acquisition system based on C-MOS FADC is under development, and will be installed this winter. With this new system, the inter telescope triggers can be made and a lower threshold energy will be achieved.
Alt-azimuth mounts are employed for the driving system of the telescope. The mount is controlled by the network local computer VxWorks. The rotation angles are read by the encoder with an accuracy of 0.001 degrees every 0.1 second. The local computer calculates the target position and the velocity, and then these values are compared with the actual telescope’s position and velocity. The difference between them are minimized by a feed back loop in the computer software. The typical tracking accuracy is , however, for small zenith angle regions, the velocity of the azimuth axis increases rapidly and the tracking error in the azimuth axis becomes larger. We therefore defined the dead space of the zenith angle less than for the tracking.
The new star tracking method called raster scan is employed in our experiment. During a raster scan the center of the field of view scans the square region of in right ascension and declination coordinate centered on the target. One raster scan cycle is 48 minutes. The advantages of this tracking method are as follows: 1) obtain the larger FOV than the actual FOV, 2) reduce the systematics due to the non-uniformities of PMT’s gains and due to the star light, 3) more efficient observations because the target is always inside the FOV, and 4) calibration of the absolute direction of the telescope is possible using bright stars.
3.ANALYSIS
The pedestal of ADC is measured by an artificial trigger every 10 seconds during the observations. The pedestal values as a function of time for each channel are used in the analysis. The image processing from the raw data is required to reject the night sky background photons. The images which show the concentration in the geometry and in the time are selected using the timing information (the software time window is ). After these image processing, the usual imaging analysis (Weekes et al. 1989) is carried out. The selection of the events with the image parameters is used to enrich the gamma showers with the following conditions; , and . These selection parameters were determined to maximize the by a monte carlo simulation that includes every experimental condition: the telescope optics, the geometry of mirrors, the shade of the PMT clusters, the PMT alignment, and the effect of the raster scan. With this selection, gamma rays are selected with an efficiency of 50%.
3.1 CRAB NEBULA
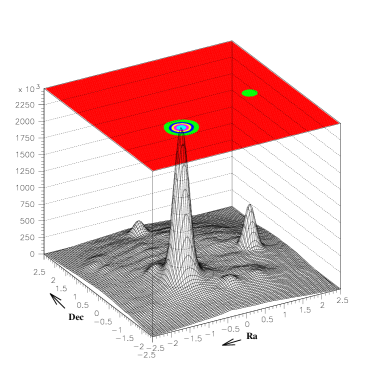
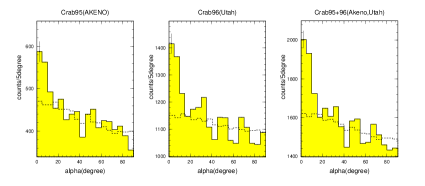
We have analysed Crab Nebula data taken at Akeno from Oct. 1995 to Dec. 1995 and at Utah from Nov. 1996 to Feb. 1997. We have used only clear sky night data for analysis. The observation times amount to 40 hours and 60 hours at Akeno and at Utah respectively. The numbers of total events are about 311,000 and 1,070,000 after the firt stage analysis which selects cerenkov events and determines the orientation and image parameters. Figure 2 shows the alpha plot after the image parameter cut. The total significance exceeds 10 . From the analysis using Monte Carlo simulation, the effective area after the image selection is calculated as 12,000 . The flux of gamma rays from Crab Nebula is estimated to be 0.93[//sec] at 1 TeV using the data taken at Utah site.
3.2 MKN501
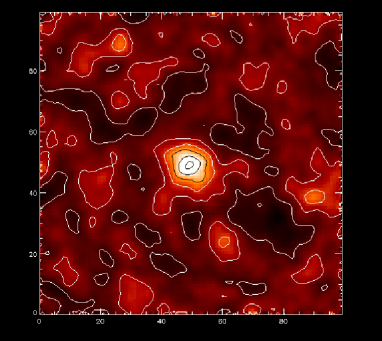
During March, April and May 1997, we have observed strong flares from Mkn501. The gamma ray intensities during these period exceed the Crab flux and sometimes became stronger than the Crab by a factor of 2 - 4. The significance map and daily intensities are shown in figure 3. The intensities have changed with the time scale of a few days. We have tried to find very short time variation within one day data, however, we could not find any such burst.
 ,
, 
4.CONCLUSION
The seven telescopes array is under construction at Utah Fly’s Eye site. The construction will be completed in this summer. At present, three telescopes are in operation. The gamma rays from Crab Nebula and from Mkn501 were successfully detected with high statistics. Gamma ray flares from Mkn501 have been detected, and the time profiles are under the investigation. We have seen the variation of intensities within a scale of a few days but failed to see any short bursts. The flares of Mkn501 are still continuing while we are writing this manuscript. Further details of our results will be reported in the conference or elsewhere.
ACKNOWLEDGEMENTS
This work is supported in part by the Grants-in-Aid for Scientific Research (Grants #07247102 and #08041096) from the Ministry of Education, Science and Culture. The authors would like to thank Mrs.B.Jones, Mr.R.Smith, Mr.S.Thomas and Mr.A.Larsen for their technical supports, and the people at Dugway for the help of observations.
REFERENCE
T.C.Weekes et al. 1989, Ap.J. 342 p379.
M.Teshima et al. 1992, Proceedings of Towards a Major Atmospheric Cerenkov Detector for TeV astro/particle Physics, edited by P.Fleury and G.Vacanti, p255.