06. (08.14.1; 08.16.7; 03.20.4; 03.20.1)
11institutetext: 1Astro Space Center of the Russian Academy of Sciences, 117810, Moscow,
Russia; vkurt@dpc.asc.rssi.ru
2Special Astrophysical Observatory of RAS,
Karachai-Cherkessia, Nizhnij Arkhyz, 357147 Russia; sokolov@sao.ru
3The Pennsylvania State University,
Dept. of Astronomy & Astrophysics, 535 Davey Lab,
University Park, PA 16802; pavlov@astro.psu.edu
BVRI observations of PSR B0656+14 with the 6-meter telescope.
Abstract
We observed the middle-aged radio pulsar B0656+14 with a CCD detector at the 6-m telescope. Broadband BVRI images show the following magnitudes of the pulsar counterpart: . We fitted the UV-optical (space + ground-based) data with a two-component model which combines a power law (non-thermal component) with a thermal spectrum emitted by the neutron star surface. The power law component, with the energy power-law index , dominates in the observed range. Constraints on the thermal component correspond to the Rayleigh-Jeans parameter , where K is the brightness temperature, km is the neutron star radius as seen by a distant observer, and pc is the distance. The shape of the optical-UV spectrum of PSR B0656+14 differs considerably from those observed from other pulsars: the middle-aged Geminga and young Crab, Vela.
keywords:
stars: neutron – pulsars: individual: PSR B0656+14 – techniques: photometric – techniques: image processing1 Introduction
Optical radiation has been detected from only of radio pulsars (see Bignami & Caraveo 1996 for a recent review). Optical counterparts were reported for pulsars of quite different ages, from the very young PSR B0531+21 (Crab pulsar — see [Percival et al. 1993]) to old PSR B1929+10 and B0950+08 (Pavlov, Stringfellow & Cordova 1996a). Of special interest among these objects are the middle-aged ( yr), soft X-ray pulsars PSR B0656+14, J0633+1746 (Geminga) and B1055–52 studied extensively with the X-ray observatories and . Their thermal-like X-ray radiation is believed to be emitted by surface layers of the neutron stars (e. g., Ögelman 1995), so that studying this radiation enables one to estimate surface temperatures of neutron stars (NSs) of different ages, to compare them with the current models for the NS cooling, and to constrain properties of the superdense matter in the NS interiors (e. g., Pavlov et al. 1995). Since the surface temperature, as well as other parameters of radiating layers, can be measured much more accurately if the surface radiation is also observed in the optical–UV range (Pavlov et al. 1996b), investigation of the optical–UV radiation of these objects is potentially very important.
In this paper we report multi-color CCD observations of the middle-aged PSR B0656+14 ( yr) with the 6-meter telescope (BTA) at the Special Astrophysical Observatory of the Russian Academy of Sciences (SAO RAS). The optical counterpart of this pulsar was first detected with the ESO NTT and 3.6-meter telescopes in the band () by Caraveo et al. (1994a) at a 3 level. Pavlov et al. (1996a) observed the pulsar with the Faint Object Camera (FOC) onboard the Hubble Space Telescope () in a longpass filter F130LP ( Å). They confirmed the optical detection at a very high confidence level () and concluded that the observed radiation is mainly of a nonthermal (most likely, magnetospheric) origin, although a contribution of a thermal (Rayleigh–Jeans) component emitted by the NS surface cannot be excluded. In order to separate the thermal component, and to understand the nature of the nonthermal radiation, the flux of the object should be measured in several spectral bands covering as broad spectral range as possible. Mignani, Caraveo & Bignami (1997) observed PSR B0656+14 with the Planetary Camera (PC) in the F555W filter and determined its magnitude more accurately: . Obviously, observations with other filters are needed to find the shape of the spectral flux of the optical counterpart. Thus, we included such observations in our general program of deep broad-band CCD photometry of nearby pulsars of the northern sky with the 6-meter telescope.
| time | exp. | exposure | seeing | backgr. | |
|---|---|---|---|---|---|
| UT | ID | (mag/ | |||
| (sec) | (arcsec) | (deg) | arcsec2) | ||
| 22:37 | B 1 | 600 | 1.64 | 40.63 | 22.41 |
| 22:49 | V 1 | 600 | 1.56 | 39.00 | 21.60 |
| 23:01 | R 1 | 600 | 1.42 | 37.43 | 20.70 |
| 23:11 | I 1 | 300 | 1.31 | 35.95 | 19.39 |
| 23:18 | I 2 | 300 | 1.36 | 35.17 | 19.34 |
| 23:25 | B 2 | 600 | 1.69 | 34.42 | 22.39 |
| 23:36 | V 2 | 600 | 1.42 | 33.21 | 21.61 |
| 23:47 | R 2 | 600 | 1.31 | 32.13 | 20.80 |
| 23:59 | I 3 | 300 | 1.42 | 31.22 | 19.52 |
| 00:06 | I 4 | 300 | 1.33 | 30.76 | 19.47 |
| 00:12 | I 5 | 300 | 1.26 | 30.39 | 19.45 |
| 00:19 | B 3 | 600 | 1.67 | 30.06 | 22.34 |
| 00:30 | V 3 | 600 | 1.31 | 29.65 | 21.52 |
| 00:42 | R 3 | 600 | 1.45 | 29.43 | 20.64 |
| 01:13 | R*4 | 600 | 1.45 | 29.88 | 20.64 |
| 01:25 | I 6 | 300 | 1.37 | 30.42 | 19.29 |
| 01:31 | I 7 | 300 | 1.40 | 30.50 | 19.32 |
| 01:41 | I 8 | 300 | 1.30 | 31.57 | 19.41 |
| 01:48 | B 4 | 600 | 1.75 | 32.10 | 22.27 |
| 01:59 | V 4 | 600 | 1.61 | 33.18 | 21.41 |
| 02:11 | R 5 | 600 | 1.51 | 34.39 | 20.57 |
| 02:22 | R 6 | 600 | 1.53 | 35.74 | 20.53 |
| 02:34 | I 9 | 300 | 1.51 | 37.20 | 19.22 |
| 02:41 | I 10 | 300 | 1.53 | 38.05 | 19.05 |
| 02:47 | I 11 | 300 | 1.51 | 38.95 | 18.75 |
In our first BTA observations of PSR B0656+14 (January 1996) in the B, V and R filters (Kurt et al. 1997a) we obtained estimates of its brightness in the and, for the first time, B and bands and confirmed the nonthermal nature of its optical spectrum. However, because of poor weather conditions during those observations, the fluxes were determined with substantial uncertainties. Subsequent observations of the same object (November 1996) were more successful (Kurt et al. 1997b). We describe these observations and their reduction in Section 2 and discuss the properties and origin of the optical spectrum of PSR B0656+14 in Section 3.
2 Observations and data analysis
2.1 Observations
Photometric observations of PSR B0656+14 were carried out with the 6-meter telescope at SAO RAS on 11/12 November, 1996 with a CCD photometer installed at the Primary Focus. We used the “Electron ISD017A” CCD; its format of pixels corresponds to the field of view . The CCD photometer was employed in the binning mode, so that each of the zoomed pixels (referred to as ‘pixels’ hereafter) has the angular size of . We used the gain of per DN (Data Number) pixel. The shutter timing accuracy is better than 0.1 sec.
The observations were carried out with filters
close to the B, V, R and filters of the
Cousins system. Table 1 gives basic parameters of observational
conditions: starting time of each exposure, filter and exposure
number,
duration of exposure, seeing, zenith distance ,
and sky background in stellar magnitudes
per arcsec2.
| No. | relative | distance | ||
|---|---|---|---|---|
| coordinates | from PSR | |||
| (arcsec) | (arcsec) | |||
| 1 | 06:57:00.97 | 14:18:51.5 | ||
| 2 | 06:56:57.62 | 14:19:05.1 | ||
| 3 | 06:56:55.63 | 14:17:43.6 | ||
| 4 | 06:57:00.02 | 14:17:36.6 | ||
| 5 | 06:57:01.51 | 14:18:24.1 | ||
| 6 | 06:56:56.63 | 14:18:31.3 | ||
| o1,PSR | 06:56:57.84 | 14:18:34.2 | 206.5; 203.0 | 0.0 |
| o2 | 06:56:57.75 | 14:18:36.2 | 207.5; 204.3 | 1.7 |
| o3 | 06:56:57.87 | 14:18:37.4 | 206.1; 207.1 | 4.1 |
| o4 | 06:56:57.47 | 14:18:34.7 | 212.0; 204.0 | 5.1 |
| o5 | 06:56:57.58 | 14:18:34.7 | 209.5; 204.0 | 3.1 |
2.2 Data reduction
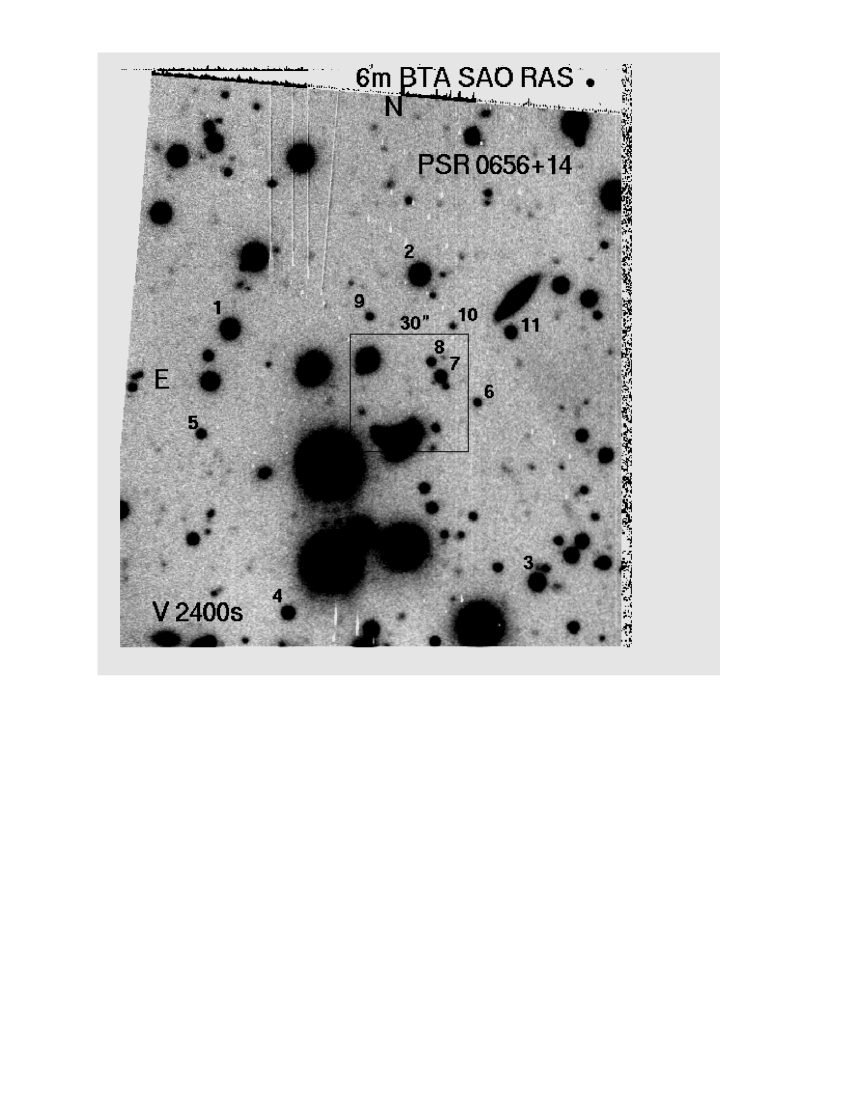
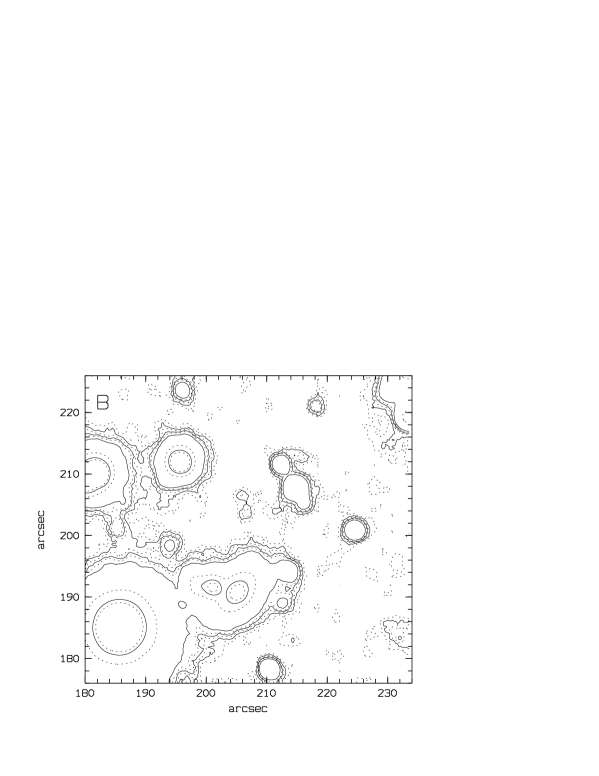
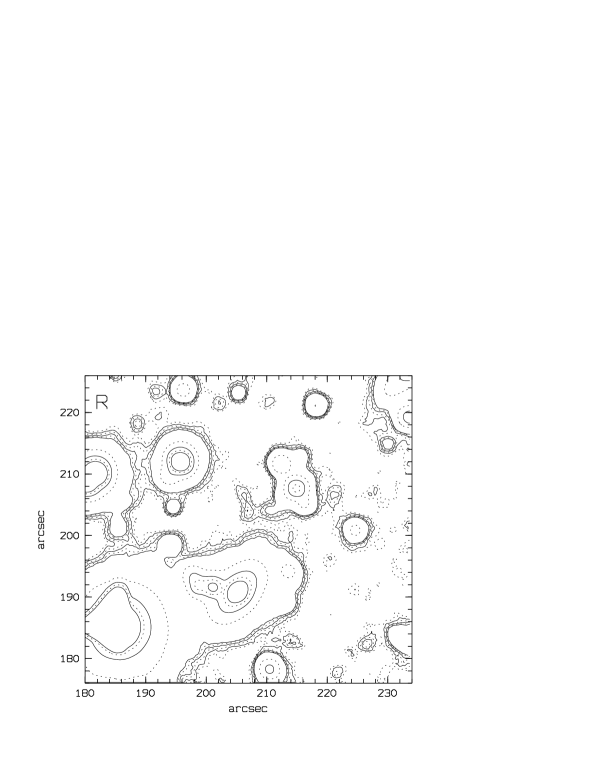
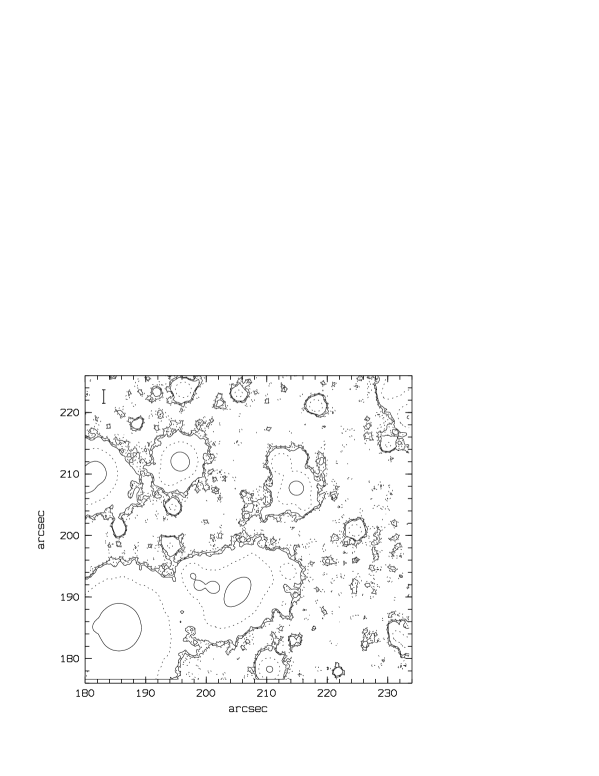
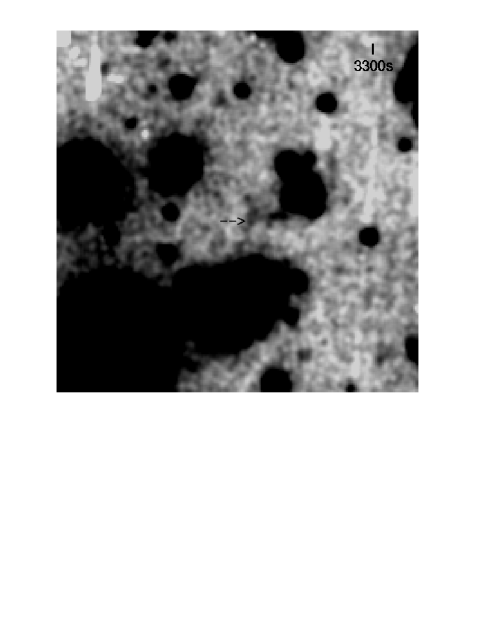
Standard data reduction includes subtraction of the “bias”, — an additional component of the CCD signal, flat-fielding (correction for non-uniform sensibility of the detector elements), and removing of space particle traces. The data were processed with the use of the MIDAS software. Processing involved all the obtained images except for R*4 where the space particle trace was in the immediate vicinity of the pulsar position. Figure 1 shows the field around the pulsar (sum of 4 exposures in the filter).
2.3 Astrometrical referencing
According to Thompson and Cordova (1994), the VLA position of the pulsar is = ; (epoch 1992.98); the formal uncertainties of the radio position ( and for and , respectively) do not include possible systematic errors which may be as large as (cf. Pavlov et al. 1996a). With allowance for the proper motion of the pulsar, and milliarcsec yr-1 (Pavlov et al. 1996a), the expected position of the pulsar at the epoch of our observations (1996.86) is = , .
The position of the candidate optical counterpart relative to nearest bright stars found with the use of the Guige Star Catalog (GSC) has been presented by Caraveo et. al. (1994b). The astrometric referencing of our data is based on coordinates taken for the field stars around the pulsar from the Digitized Sky Servey (nominal accuracy ).
Table 2 gives the coordinates of the pulsar optical candidate, 6 bright stars (denoted by the numbers 1 through 6 in Fig. 1), and 4 objects within around the pulsar. For these objects, the coordinates corresponding to the frames of Figs. 3, 4 and 6 are also presented.
| ( Å, | ( Å, | ( Å, | ( Å, | |
|---|---|---|---|---|
| FWHM=1008 Å) | FWHM=827 Å) | FWHM=1568 Å) | FWHM=1542 Å) | |
| 1 | ||||
| 2 | ||||
| 3 | ||||
| 4 | ||||
| 5 | ||||
| 6 | ||||
| 7 | ||||
| 8 | ||||
| 9 | ||||
| 10 | ||||
| 11 |


2.4 Photometry
Photometric referencing was carried out by observing four standard stars from the Landolt catalog (1992): 112822, GD71 and RU 149 (8 stars) and star 2015 from Weis (1991). Photometric conditions remained stable during the whole night, with an insignificant increase of absorption at the blue part of the spectrum at the end of the observations. For the extinction factors, we used average values of the observatory: , , , (in stellar magnitudes). From observations of the standard stars we derived the following transition equations from the instrument system (magnitudes b, v, r, i) to the Cousins system (magnitudes B, V, R, I):
| (1) | |||||
The instrumental magnitudes were calculated as
| (2) |
etc, where is the DN value in a given aperture, is the exposure time, is the correction for the finite aperture (obtained from the Point Spread Function [PSF] of bright stars), and is the correction for the atmospheric extinction. Errors of the numerical coefficients in eq. (1) do not exceed .
The errors of the stellar magnitudes can be determined by measuring the signal-to-noise () ratios:
| (3) |
| (4) |
where is the number of pixels in the aperture chosen, Sky is the value of the local background in DN per pixel, and DN is the gain. The CCD readout noise is or DN and one was negligible in our observations.
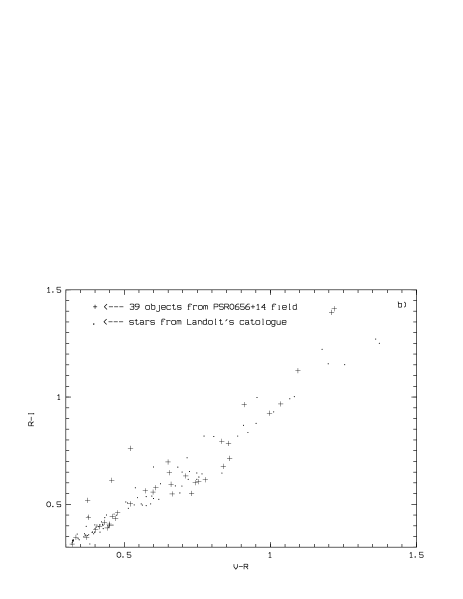
Making use of eqs. (1)–(4), we measured the magnitudes of relatively bright stars of the pulsar field (individual images were summed for each filter). The Cousins magnitudes of 11 of these stars (denoted by the numbers 1 through 11 in Fig. 1), together with the effective wavelengths and widths of the Cousins filters, are presented in Table 3. Figure 2 shows the comparison of the color indices for 39 objects of the pulsar field, from to , with the color indices for stars from the Landolt catalog. The color-color dependences are close to each other, which attests both low absorption in the Galaxy for the direction towards PSR B0656+14 and the absence of systematic shifts in our photometric system.
2.5 Optical counterpart of PSR B0656+14
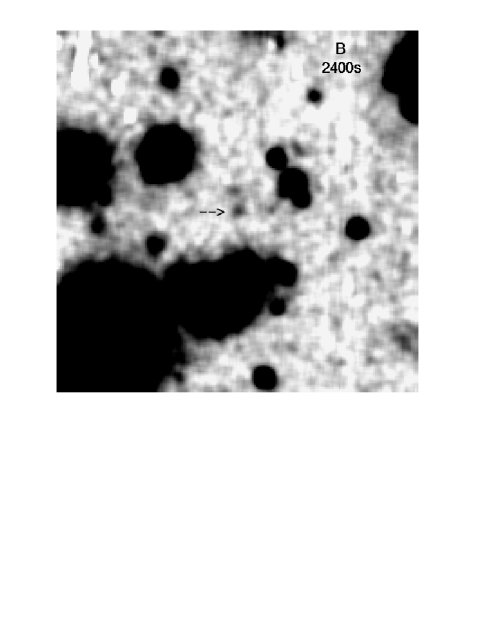
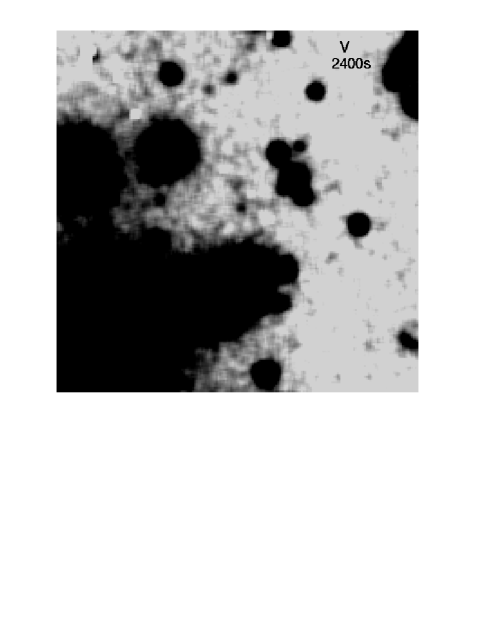
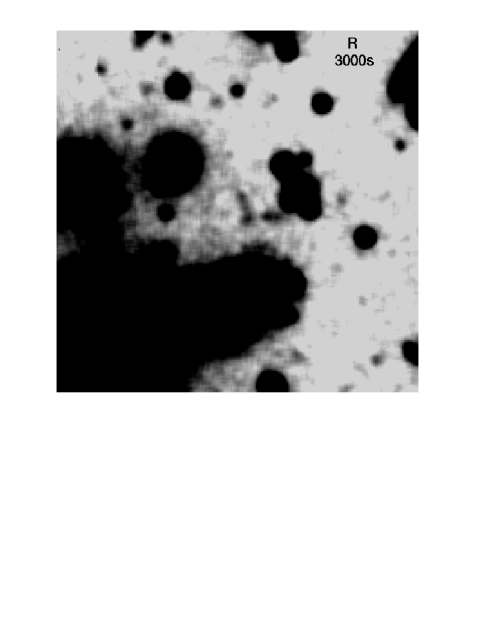
Contour plots of the pulsar vicinity in all the 4 filters obtained from smoothed ( pixels) images are shown in Figs. 3 and 4 The first five isophotes (for lower brightnesses) correspond to the following values above the background: , with , where corresponds to the aperture diameter of 6 pixels (), and the value of is that for the background near the pulsar. The isophotes for higher brightnesses are scaled arbitrarily to demonstrate brighter details. It is seen from Figs. 3 and 4 that 5 objects are detected within around the expected pulsar position. The position of one of them (“o1,PSR” in Table 2 and Fig. 6) coincides, within the budget of astrometry errors, with the radio position, so that this object is the most plausible candidate for the optical counterpart of PSR B0656+14. The nearest object “o2” (detected in the I filter only) lies to the North at a distance of . Since the objects in the near vicinity are not seen simultaneously in all 4 filters, we have shown them, for the sake of convenience, in the separate scheme of Fig.6.
| filter | m | Flux | ||||||||
| (DN/pix/s) | (pix) | (Jy) | ||||||||
| 3 | 28 | 5.6 | +0.13 | |||||||
| 2.465 | 4 | 50 | 6.1 | |||||||
| 5 | 79 | 6.1 | ||||||||
| 3 | 28 | 6.6 | ||||||||
| 6.429 | 4 | 50 | 6.7 | |||||||
| 5 | 79 | 7.1 | ||||||||
| 3 | 28 | 7.9 | ||||||||
| 18.207 | 4 | 50 | 9.8 | |||||||
| 5 | 79 | 9.3 | ||||||||
| 3 | 28 | 4.6 | ||||||||
| 29.922 | 4 | 50 | 4.2 | |||||||
| 5 | 79 | 4.1 |
The photometry of the pulsar candidate (Table 4) was carried out for several aperture radii , to optimize the ratio. The object “o2”, whose brightness in the filter is comparable to that of the pulsar candidate, starts to influence the photometry of the candidate at pixels (). Most notations of Table 4 have been described above. The columns and are for the magnitudes in the instrumental and Cousins systems, respectively. The last column shows the source flux (in erg cm-2 s-1 Hz-1) obtained from the Cousins magnitudes with the aid of the data on Lyr by Fukigita et al. (1995)
2.6 Objects in near vicinity of the PSR B0656+14 counterpart
The coordinates of the 5 objects within of the expected pulsar position (see Figs. 5 and 6) are presented in Table 2.
The object “o1,PSR”, whose brightness distribution is consistent with that of a point source, is the only probable candidate for the pulsar counterpart, based upon both its position and photometry.
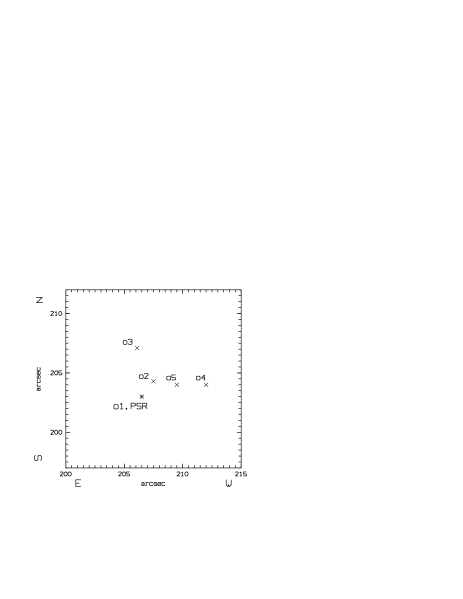

The object “o3” is seen in all our B,V,R,I images, as well as in the contour plots of Fig. 2 of Caraveo et al. (1994a). It has been also detected as a faint extended object in the F130LP image (Pavlov et al. 1996a). Moreover, it can be seen even in our first B images (Kurt et al. 1997a) as a background enhancement exactly at the same position. Thus, the presence of this faint (extended?) object at to the North of the pulsar is firmly established. The object “o4” has also been detected with the ESO-3.6m and NTT telescopes in the V filter (Caraveo et al. 1994a), although it is difficult to distinguish between the objects “o4” and “o5” because of their obviously extended nature. These objects are outside of the frame of the FOC image presented by Pavlov et al. (1996a).
The object “o2”, closest to the pulsar, is reliably detected only in the I filter. In other filters only a non-significant enhancement of the background is seen at this position. We suppose that the object “o2” is not seen in the FOC image because it is too red to be detected in the F130LP band.
| object | ||||
|---|---|---|---|---|
| o2 | - | - | - | 23.83 |
| (+0.2 1;-0.19) | ||||
| o3 | 24.63 | 23.93 | ||
| (+0.15;-0.13) | (+0.2 4;-0.20) | |||
| o4 | 24.59 | 23.50 | ||
| (+0.21;-0.17) | (+0.12 ;-0.10) | |||
| o5 | - | - | 24.35 | 23.54 |
| (+0.14;-0.12) | (+0.20;- 0.17) |
Table 5 gives estimates for magnitudes of these objects. These estimates and the distances of the objects relative to “o1,PSR” (Table 2) allow us to conclude that these objects do not affect the measured values of the B, V, R magnitudes of the pulsar counterpart. A minor effect about 3% from whole flux of the nearest object “o2” on the magnitude determined for the pulsar counterpart with the aperture radius of 3 pixels (diameter of ) can be expected, but it should not exceed the errors of our measurement.
3 Discussion.
Figure 7 shows the UV-optical energy fluxes in different bands for the PSR B0656+14 counterpart obtained with the and 6-m telescope. It demonstrates that our results (crosses , , and ), being compatible with previously obtained data, considerably extend redward the observed frequency domain, fill in the gap between the visual and UV parts of the spectrum, and provide more accurate fluxes in the and bands. The overall spectrum firmly confirms a nonthermal origin of the optical radiation suggested by Pavlov et al. (1996a). On the other hand, the relatively high value of the F130LP flux makes very plausible that the thermal radiation from the NS surface contributes noticeably into the UV part of the spectrum. Parameters of the thermal and nonthermal fluxes can be constrained by fitting the observed spectrum with a two-component model (cf. Pavlov et al. 1996a), a sum of the power-law and thermal spectra (the latter has the form of a Rayleigh-Jeans spectrum at these frequencies for plausible NS temperatures):
| (5) |
where is an arbitrary reference frequency (we chose Hz, which corresponds to Å), is the interstellar extinction (see, e. g., Savage & Mathis 1979), and are the values of the nonthermal and thermal fluxes at . The latter can be expressed, for the chosen value of , as
| (6) |
where K is the NS brightness temperature, km is the NS radius (as seen by a distant observer), and pc is the distance to the pulsar. According to Pavlov et al. (1996a), a plausible value for the color excess, which determines the extinction curve , is (). We fixed at this level and fitted the fluxes in the 6 bands (, , , , F555W and F130LP) with eq. (5), varying , and . The best-fit model (minimum for 3 degrees of freedom) corresponds to erg cm-2 s-1 Hz-1, and . The best-fit spectrum is shown in Fig. 7 with the solid line, and the best-fit thermal and power-law components with dashed lines.

The value of can be compared with what is expected from extrapolations of the soft X-ray spectral flux observed with the and (Finley, Ögelman & Kiziloğlu 1992; Anderson et al. 1993; Greiveldinger et al. 1997) to the optical range. The result of this extrapolation depends on the model assumed to fit the X-ray spectrum. The blackbody fit of the spectrum yields for (Finley et al. 1992), which corresponds to the Rayleigh-Jeans parameter . A fit of the same data with a set of hydrogen NS atmosphere models (Pavlov et al. 1995) gives, for G, the radius-to-distance ratio and the effective temperature K (Anderson et al. 1993). Since the model spectrum differs from the blackbody spectrum, there is no a universal relation between the effective and brightness temperatures; however, the model spectrum in the optical range closely reminds, and can be fitted with, the Rayleigh-Jeans spectrum with , thus giving , almost thrice greater than inferred from the blackbody model.
We see that the best-fit value of obtained from the available optical-UV observations exceeds the predictions of both the blackbody and hydrogen atmosphere interpretations of the soft X-ray flux. However, as Fig. 8 shows, the fitting parameter is constrained poorly by our data: at a level. The main reason of that is the lack of data in the far-UV range where the thermal component gives the main contribution. Thus, we can only conclude that the results are consistent with the presence of a thermal component, but we cannot distinguish between different NS surface models and can only estimate upper limits for the Rayleigh-Jeans parameter, , 6.8 and 7.3 at the confidence levels of 68, 90 and 99%. We expect that better constraints will be obtained from recent FOC observations of this pulsar in the UV range (Pavlov, Welty & Córdova 1997).
Figure 7 clearly demonstrates that the pulsar radiation in the IR-optical range is predominantly of a nonthermal origin, in agreement with the conclusion of Pavlov et al. (1996a). An independent confirmation of the nonthermal nature comes from the high pulsed fraction observed by Shearer et al. (1997) in the band. Although the slope of the nonthermal spectrum is not well constrained because of relatively large errors (especially in the band): at a level, it looks much steeper than those of the (much younger) Crab pulsar, (Percival et al. 1993; see also Ransom et al. 1994). The nonthermal component of the younger Vela pulsar has the slope in the range, but its flux is about twice lower than the extrapolation of the power law (Nasuti et al. 1997). Even more drastic difference is seen between the shapes of the optical spectra of PSR B0656+14 and the older pulsar Geminga ( yr) which looks very much alike B0656+14 in the soft X-ray range. Geminga’s flux has a minimum at the band, is peaked at the band, and falls off sharply redward, which allowed Bignami et al. (1996) to suggest the presence of a proton cyclotron line centered at Å. On the contrary, the flux of PSR B0656+14 grows redward of , thus demonstrating that the properties of the nonthermal IR-optical-UV radiation are neither the same in different pulsars nor they have a clear correlation with the pulsar age.
The apparent excess of the flux with respect to acceptable continuum fits (Fig. 7), responsible for the relatively large value of the minimum , may indicate the presense of a spectral feature at these wavelengths, perhaps similar to that reported for Geminga. More observations are needed to verify whether the feature is real. But at least three broad emission lines above 3600 A were recently detected indeed in a prism spectrum of PSR B0540-69 with the FOS/HST by Hill et al. (1997). The authors connect directly the presence of these strong emissions with a nebula surrounding B0540-69.
The nonthermal component has also been observed in high-energy radiation from PSR B0656+14. Greiveldinger et al. (1997) reported a power-law component in the X-ray spectrum of PSR B0656+14, with , which dominates at keV. Ramanamurthy et al. (1996) presented an evidence for -ray emission ( MeV), with . Being extrapolated to the X-ray range, our best-fit power-law component () gives the X-ray flux about 3 orders of magnitude lower than observed by Greiveldinger et al., i. e., the nonthermal flux should grow somewhere between the UV and X-ray ranges. To merge with the X-ray power-law component at keV, our optical flux should have a slope , hardly compatible with our fit (see Fig. 8), and in this case the spectrum should steepen at higher energies in order to be compatible with the -ray data. It is, however, hard to believe that the spectrum would have the same slope in the optical and high-energy ranges — in fact, none of the four other pulsars with investigated nonthermal optical components shows such behavior.
To put more stringent constraints on the parameters of the thermal and nonthermal components, more observations are needed. Observations in the IR range would be most useful for elucidating the slope of the nonthermal component, whereas far-UV observations would be crucial to measure the Rayleigh-Jeans parameter proportional to the temperature of the NS surface. Since and are correlated with each other (see Fig. 8), measuring one of these parameters with a higher accuracy would immediately constrain the other parameter. It would be also useful to obtain more detailed spectrum around the band in order to understand whether the excess we observed is associated with a spectral line. Such observations are quite feasible with both the and large ground-based telescopes.
Acknowledgements: The work of G. G. P. was partially supported by NASA through grant GO-06645.01-95A from the Space Telescope Science Institute, which is operated by the Association of Universities for Research in Astronomy, Inc., under NASA contract NAS 5-26555, and through NASA grant NAG5-2807.
References
- [Anderson et al. 1993] Anderson S.B., Córdova F. A.,Pavlov G. G., Robinson C.R., Thompson R. G., 1993, ApJ, 414, 863
- [] Bignami G.F., Caraveo P.A., 1996, ARA&A, 34, 331
- [Bignami et al. 1996] Bignami G.F., Caraveo, P.A., Mignani, R., Edelstein, J., Bowyer, S., 1996, ApJ, 456, L111
- [Caraveo et al. 1994a] Caraveo P.A., Bignami G.F., Mereghetti S., 1994a, ApJ, 422, L87
- [Caraveo et al. 1994b] Caraveo P.A., Mereghetti S., Bignami G.F., 1994b, ApJ, 423, L125
- [Finley et al. 1992] Finley J.P., Ögelman H., Kiziloğlu U., 1992, ApJ, 394, L21
- [Fukugita et al. 1995] Fukugita M., Shimasaku K., Ichikawa T., 1995, PASP, 107, 945
- [] Greiveldinger C., Camerini U., Fry W., et al., 1996, ApJ, 465, L35
- [] Hill R. J., Dolan J. F., Bless R. C., et al., 1997, ApJ., 486, L99
- [Kurt et al. 1997a] Kurt V.G., Komberg B.V., Sokolov V.V., Zharikov S.V., 1997, A&SS, submitted in the A&SS.
- [Kurt et al. 1997b] Kurt V.G., Komberg B.V., Sokolov V.V., Zharikov S.V., Pavlov G.G., 1997b, IAU Circ. 6533
- [Landolt A.U., 1992] Landolt A.U., 1992, AJ, 104, 340
- [Mignani, Caraveo, & Bignami 1997b ] Mignani R., Caraveo P. A., Bignami G. F., 1997, The Messenger, 87, 43
- [] Nasuti F.P., Mignani R., Caraveo P.A., Bignami G.F., 1997, A&A, in press
- [] Ögelman H., 1995, in: Alpar M. A., Kiziloğlu Ü., van Paradijs J. (eds). The Lives of the Neutron Stars. Kluwer, Dordrecht, p. 101
- [Pavlov et al 1995] Pavlov G.G., Shibanov Yu.A., Zavlin V.E., Meyer R.D., 1995, in: Alpar M. A., Kiziloğlu Ü., van Paradijs J. (eds). The Lives of the Neutron Stars. Kluwer, Dordrecht, p. 71
- [Pavlov et al. 1996a] Pavlov G.G., Stringfellow G.S., Córdova, F.A., 1996a, ApJ, 467, 370
- [Pavlov et al. 1996b] Pavlov G.G., Zavlin V.A., Trümper J., Neuhäuser R. 1996b, ApJ, 472, L33
- [] Pavlov G.G., Welty A.D., Córdova F.A. 1997, ApJ, in preparation
- [Percival et al. 1993] Percival J.W., Biggs J.D., Dolan J.F., et al., 1993, ApJ, 407, 276
- [] Ramanamurthy P.V., Fichtel C.E., Kniffen D.A., Sreekumar P., Thompson D.J., 1996, ApJ, 458, 755
- [Ransom et al] Ransom S.M., Fazio G.G., Eikenberry S.S., et al., 1994, ApJ, 431, L43
- [] Savage B.D., Mathis J.S., 1979, ARA&A, 17, 73
- [] Shearer A., Redfern, G,, Gorman, R., et al. 1997, ApJ., 487, L181
- [Thompson and Cordova, 1994] Thompson R.J., Córdova F.A., 1994, ApJ, 421, L13
- [Weis E. W., 1991] Weis E.M., 1991, AJ., 102, 1795