Self-Consistent Thermal Accretion Disk Corona Models for Compact Objects II. Application to Cygnus X-1
Abstract
We apply our self-consistent accretion disk corona (ADC) model, with two different geometries, to the broad-band X-ray spectrum of the black hole candidate Cygnus X-1. As shown in a companion paper (Dove, Wilms, and Begelman), models where the Comptonizing medium is a slab surrounding the cold accretion disk cannot have a temperature higher than about 120 keV for optical depths greater than 0.2, resulting in spectra that are much softer than the observed 10–30 keV spectrum of Cyg X-1. In addition, the slab geometry models predict a substantial “soft excess” at low energies, a feature not observed for Cyg X-1, and Fe K fluorescence lines that are stronger than observed. Previous Comptonization models in the literature invoke a slab geometry with the optical depth and the coronal temperature keV, but they are not self-consistent. Therefore, ADC models with a slab geometry are not appropriate for explaining the X-ray spectrum of Cyg X-1. Models with a spherical corona and an exterior disk, however, predict much higher self-consistent coronal temperatures than the slab geometry models. The higher coronal temperatures are due to the lower amount of reprocessing of coronal radiation in the accretion disk, giving rise to a lower Compton cooling rate. Therefore, for the spheredisk geometry, the predicted spectrum can be hard enough to describe the observed X-ray continuum of Cyg X-1 while predicting Fe fluorescence lines having an equivalent width of eV. Our best-fit parameter values for the spheredisk geometry are and keV.
Subject headings:
radiation mechanisms: nonthermal – radiative transfer – X-rays: general – X-rays: binaries – accretion1. Introduction
Due to its high X-ray brightness and its apparent large mass, Cygnus X-1 is the most studied Galactic black-hole candidate (BHC). Although it is almost certain that the production of the high-energy radiation is associated with the accretion of matter, the exact details are uncertain. The source of accreting matter is most probably a combination of Roche-lobe overflow and accretion out of the stellar wind of the companion, the O9.7Iab supergiant HDE 226868 (Gies & Bolton (1986)). Recent mass determinations give a mass of about 18 for the companion and 10 for the compact object (Herrero et al. (1995), in agreement with Dolan (1992); Sokolov (1987); Bochkarëv et al. (1986); Aab et al. (1984); Hutchings (1978) and references therein), making the latter a good candidate for being a black hole.
Cyg X-1 is usually observed in the so-called “X-ray low, -ray high” state, which is roughly described by a power-law with a photon index , modified by an exponential cut-off with an -fold energy of about 100 keV (see Oda (1977); Liang & Nolan (1984); Tanaka & Lewin (1995) for detailed reviews of the observations). The most popular model used for explaining the high-energy spectrum of Cyg X-1 (and other BHCs), while in the “low state,” involves inverse Comptonization of soft photons by a hot plasma, usually referred to as a corona. While the Comptonization model by Sunyaev & Titarchuk (1980) has been used widely in the past (e.g., Grebenev et al. (1993); Döbereiner et al. (1995)), Titarchuk (1994) showed that the typical fit-parameters found for Cyg X-1 are outside the model’s range of validity (and cannot be used for interpreting the physical conditions in the Comptonizing medium), and he developed a more generalized theory. Using a composite spectrum from EXOSAT, GRANAT, and OSSE observations, Titarchuk (1994) found that this new accretion disk corona (ADC) model, having an optical depth , a coronal temperature , and a slab geometry allowed for a rough description of Cyg X-1.
Although Comptonization apparently accounts for the general behavior of the observed X-ray spectrum of Cyg X-1, it appears that a reprocessing component is needed for the full description of the spectrum. Formal descriptions of the different observations in terms of a reflection component with an underlying Comptonization spectrum give better fits to the data than do pure Comptonization models. The presence of a weak fluorescence line from neutral iron (Kitamoto et al. (1990); Done et al. (1992); Marshall et al. (1993); Ebisawa et al. (1996)) and the deviation of the 2–60 keV-band from a pure power law seen by HEAO 1-A2 (Inoue (1989); Done et al. (1992); Gierliński et al. (1997)), which is usually interpreted as a Compton reflection hump, both indicate the presence of cold or slightly ionized material present in the source, in addition to the Comptonizing medium. Therefore, since the radiation processes of Comptonization and reprocessing of coronal radiation in the cold accretion disk cover a large range of photon energies ( keV to keV) in the predicted X-ray spectrum, it is necessary to use-broad-band spectral observations to place meaningful constraints on the models.
As we discussed in our companion paper (Dove, Wilms, & Begelman 1997, hereafter paper I), one serious drawback to solving the radiation transfer problem for an ADC with analytic and “linear” Monte Carlo techniques (where each photon particle is propagated through a fixed background) is that the physical properties of the corona must be defined a priori. The coronal properties and the radiation field are strongly coupled through the processes of Compton cooling, Compton upscattering, pair production and annihilation. Therefore, it is not clear whether the assumed coronal properties are self-consistent with the resulting radiation field.
We have recently developed an ADC model in which the radiation field, the temperature and opacity of the corona, and the reprocessing of coronal radiation in the accretion disk are calculated self-consistently (paper I). We find that all previous ADC models having a slab geometry and used to describe the X-ray spectrum of Cyg X-1 are not self-consistent, since the coronal temperatures and opacities are not within the physically allowed range of combinations of these parameters (see Fig. 2 of paper I). Haardt et al. (1993) claim that their “best-fit” model, having a coronal temperature keV and an optical depth , agree within the 3 confidence level of their allowed relation. However, due to the quality of the data, the 3 contour covers a very large region of the parameter space, of which only a very small part is within the self-consistently allowed region.
In this paper, we apply our self-consistent model to Cyg X-1, using a more complete composite spectrum than was available to previous work (Wilms et al. (1997)). We study two geometries: (1) the standard slab geometry and (2) a spherical corona with an exterior accretion disk. At the time of writing, simultaneous X-ray spectra covering the range from 2 keV to 250 keV were not generally available. We therefore had to use a non-simultaneous composite spectrum from several instruments to cover this energy range (each observation was taken while Cyg X-1 was in its “low” state). A detailed description of the individual data comprising the composite spectrum and a preliminary analysis are given in Wilms et al. (1997). 111We note that, due to a bug in the treatment of reprocessing of coronal radiation, the conclusion made by us in Wilms et al. (1997) that the slab geometry model is able to describe the broad-band spectrum of Cyg X-1 is erroneous. As we show below, the slab geometry model predicts a spectrum that is much softer than the observed spectrum. Due to the bug, the yields for Compton reflection/fluorescence and thermalization were reversed, causing % (instead of %) of the coronal radiation to be reprocessed into thermal radiation and leading to a corresponding erroneous Compton cooling rate. As discussed in paper I, the current version of our code has been successfully compared to other reprocessing models (e.g., George, Nandra, & Fabian (1990)).
2. The Numerical Code
It appears impossible to produce an analytical model of an ADC that properly accounts for the self-consistent thermal and opacity distributions of the corona while solving correctly the radiative transfer problem of an angle-dependent, high-energy radiation field in a semi-relativistic, non-uniform plasma (including reprocessing of radiation in the accretion disk). Therefore, numerical methods are needed. For the computations presented here, we use a non-linear Monte Carlo (NLMC) code to calculate self-consistently the temperature and opacity of the corona as well as the radiation field within and external to the corona. For the two geometries considered here, Compton scattering, photon-photon pair production, and pair annihilations are taken into account within the corona. For the reprocessing of radiation within the accretion disk, Compton scattering and photo-absorption, resulting in fluorescent line emission and thermal emission, are considered. We enforce charge neutrality by requiring , where , , and are the number densities of electrons, positrons, and protons, respectively. For this paper, the spatial distribution of the seed opacity (the opacity not including the contribution due to electron-positron pairs) was assumed to be uniform.
The free parameters of our models are: (1) the seed opacity of the corona, , (2) the temperature of the accretion disk as a function of radius, , and (3) the compactness parameter of the corona, . For a set of free parameters, the NLMC code is iterated until the temperature of the corona, , the total opacity, , and the radiation field have reached a steady state. Thermal equilibrium is achieved when the local heating rate is balanced by the Compton cooling rate. The pair opacity is determined by requiring pair-annihilations to balance pair-production. Once the system has reached steady state, the spectra of escaping radiation are recorded (in 10 bins of different inclination angles) until satisfactory statistics are obtained. A detailed description of the NLMC code and its use for ADC is given in paper I.
3. Slab Geometry
3.1. The Model
The most common geometry used to model the spectra of BHCs is the slab (plane-parallel) geometry. For this geometry, we assume that the accretion disk corona is situated above and below an optically thick, geometrically thin, cold accretion disk, that all corona and disk properties are constant with respect to radius, and that azimuthal symmetry applies. The coronal compactness parameter is defined to be
| (1) |
where is the scale-height of the corona, is the luminosity of the corona, is the radius of the corona, is the Eddington luminosity, is the Schwarzschild radius, is the rate of energy dissipation per unit area into the corona and . The specification of the physical mechanism heating the corona is not necessary. We simply assume that the energy is dissipated uniformly with respect to height. For a specific value of , the self-consistent coronal properties are degenerate with respect to and (Stern et al. (1995)).
As we discuss below, the predicted amount of thermal excess in the escaping spectrum of radiation strongly depends on the temperature of the accretion disk, . A lower limit to the temperature can be estimated by assuming that the disk is heated solely by illumination from the corona. In this case, the temperature is approximated by balancing absorption with thermal emission:
| (2) |
where is the flux of coronal radiation incident onto the accretion disk (assumed here, by symmetry, to be equal to the flux of escaping radiation), is the Stefan-Boltzmann constant, and is the angle-averaged albedo of the disk. Using equation (1), the disk temperature can be expressed as
| (3) |
We refer the reader to paper I for a more detailed discussion of the slab geometry models.
3.2. Application to Cyg X-1
As discussed in paper I, we find that the maximum self-consistent temperature of the corona is keV for total opacities , regardless of the compactness parameter and . Once this maximum temperature, , is reached, higher heating rates result in a higher opacity due to pair production, causing more reprocessing of coronal radiation in the accretion disk. Since most of the reprocessed radiation is emitted as thermal radiation, the higher amount of reprocessing gives rise to higher Compton cooling rates. Therefore, once pair-production becomes important, an increase in the heating rate results in a decrease in the temperature. Fig. 2 of paper I shows the allowed parameter space of self-consistent corona temperatures and opacities.
In Fig. 1 we show our by-eye “best-fit” of the predicted angle-averaged spectrum, modified by interstellar absorption, to the composite spectrum of Cyg X-1.

For the slab geometry, the modeled spectrum shown is the hardest spectrum possible while having a cut-off energy keV. It is apparent, however, that the predicted spectrum is still much softer than the observed spectrum. In our grid of models, the range of seed opacities is and the range of coronal compactness parameters is (see paper I). Out of the entire grid, the hardest spectrum predicted by our self-consistent models has a photon index of , while Cyg X-1 has a power-law index of . As discussed in Wilms et al. (1997), The BBXRT archived data were deconvolved by assuming a power-law continuum, with a photon index of , absorbed by the interstellar medium with cm-2. The TTM data were reduced by Borkous et al. (1995), the HEXE data by Döbereiner et al. (1995), and the OSSE data by Kurfess (1995). Since the models provided reasonable reduced chi-squared values (), the unfolded data should be at least a good approximation to the actual spectrum. Therefore, even though we are comparing our predicted spectra with unfolded data, which are dependent on the assumed model, the result that the predicted spectrum is always softer than the observed spectrum is not sensitive to the deconvolution procedure.
According to our linear (and therefore not self-consistent) MC simulations, simulated spectra with , while keV, are achieved only for models with . These values are consistent with past work, in which the spectrum of Cyg X-1 has been described by ADC models with a slab geometry (Haardt et al. (1993); Titarchuk (1994)). Such models, however, are not self-consistent, for the temperature and opacity values lie within the forbidden region of Fig. 2 of paper I. We remind the reader that the predicted maximum temperatures are indeed upper limits, for our models do not include additional cooling mechanisms such as bremsstrahlung. (This mechanism was found to be negligible for the models of interest, but its inclusion would reduce the maximum temperatures allowed.)
In addition to the simulated spectra having too soft a power-law component, our models predict a very large Fe K equivalent width (EW). Our “best-fit” slab model predicts an eV, considerably larger than the observed value of eV (Ebisawa et al. (1996)). Finally, the slab models also predict an excess of radiation for energies keV (i.e., a “soft excess”). Since the “best-fit” slab models are optically thin, most of the thermal emission emitted by the disk escapes the system without interacting with the corona. We have accounted for Galactic absorption by using the observed column density of hydrogen, cm-2 (Wilms et al. (1997)). Clearly, this is not sufficient to “hide” the soft excess for the 200 eV disk models. Models with a higher value of predict too low of a flux for energies below keV, so this soft-excess problem cannot be solved by having having arbitrarily large hydrogen column densities in the model. We note, however, that the BBXRT observation is unique since a soft-excess was not observed (Marshall et al. (1993)). Since Cyg X-1 usually has a soft-excess component (e.g., Bałucińska & Hasinger (1991); Bałucińska-Church et al. (1995); Ebisawa et al. (1996)), the discrepancy between the predicted flux and the observed flux at low energies should not be considered a serious problem by itself. However, it does appear that our “best-fit” slab geometry model predicts a higher soft-excess component than observed by the ASCA GIS detector for November 11, 1993 (Ebisawa et al. (1996)).
We conclude that self-consistent accretion disk corona models with a slab geometry are not capable of reproducing the observed broad X-ray spectrum of Cyg X-1.
4. Sphere+Disk Geometry
4.1. The Model
The main limitation of the slab geometry models, in regard to explaining the high-energy spectra of Cyg X-1, is that there is too much reprocessing of coronal radiation in the cold accretion disk. Therefore, models with the reprocessing matter having a smaller covering fraction (as seen from the corona) are more likely to explain the observations. One such geometry is a combination of a spherical corona with an optically thick, geometrically thin, cold accretion disk. Here, the accretion disk is assumed to be exterior to the corona, as shown in Fig. 2.
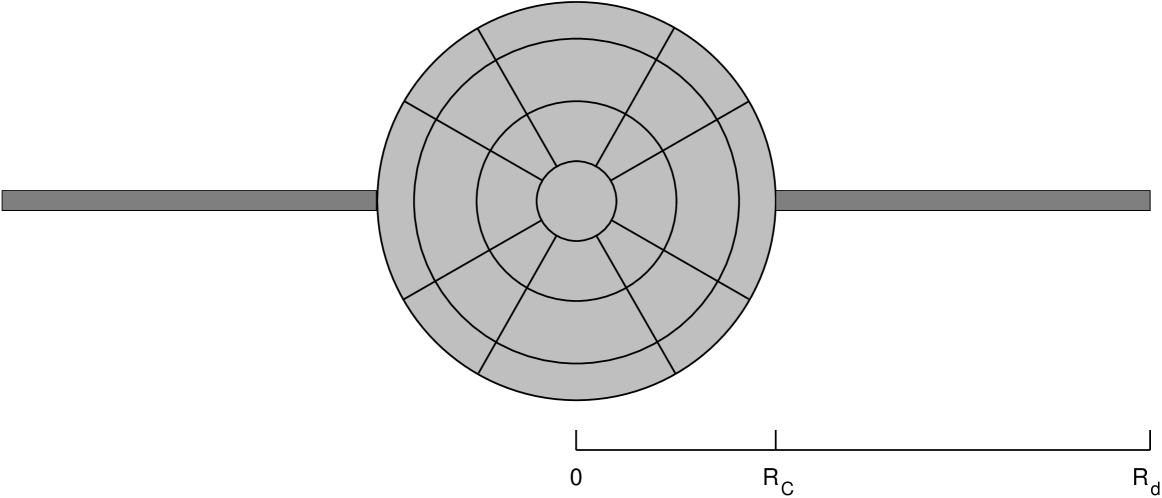
This geometry is very similar to the two-temperature accretion disk model of Shapiro & Lightman (1976), although, in our model, the proton temperature is assumed to be equal to the electron temperature. This geometry is also similar to the advection-dominated disk models by Narayan and collaborators (Narayan & Yi (1995a, b); Narayan (1996), and references therein). However, in our models, the seed photons for Comptonization are produced by the accretion disk through thermal emission rather than bremsstrahlung and synchotron radiation within the corona. The accretion disk extends from to where is the radius of the sphere and is the outer radius of the disk. We define the ratio of the outer disk radius to the corona radius as . For this paper, we set , but the main results are not sensitive to this value (see § 4.2).
4.1.1 Energetics
We define the coronal compactness parameter by
| (4) |
Similar to the slab geometry models, we allow for intrinsic emission of thermal radiation by the accretion disk (in addition to emission due to the reprocessing of coronal radiation). We define to be the rate at which gravitational energy is dissipated directly into the corona, where is the total rate of gravitational energy dissipated into the system. Consequently, is the rate of energy dissipation into the disk. The total luminosity of the accretion disk is given by
| (5) |
where is the rate at which energy is absorbed (not reflected) by the disk due to the reprocessing of radiation emitted by the corona. Equation (5) can be expressed in terms of compactness parameters as
| (6) |
where , , and . As with the slab geometry models, we constrain the models by setting for all of the simulations. With this choice, is given by
| (7) |
As discussed in paper I, setting to unity allows us to consider models where , but models with other values of yield the same ranges of self-consistent coronal temperatures and opacities.
4.1.2 Disk Temperature
As in the slab-geometry model, we can estimate a lower limit to the disk temperature by assuming that the disk is heated solely by illumination from the corona;
| (8) |
where is the total luminosity leaving the corona and is the fraction of photons leaving the corona that is reprocessed in the disk. This fraction can be approximated by assuming that the photons leaving the corona are uniformly distributed over the surface of the corona with an isotropic distribution. With these assumptions, the fraction of escaping photons that hits the disk is given by
| (9) | |||||
where is the average solid angle of the disk as seen from the surface of the corona,
, and is the angle between the normal of the coronal surface and the plane of the disk. In Fig. 3, we show how the covering fraction depends on .

It is apparent that is nearly constant for , and therefore the amount of reprocessing of radiation within the accretion disk is insensitive to . The maximum value of is . In contrast, for a slab geometry, all of the downward directed radiation at the base of the corona interacts with the accretion disk. Therefore, the slab geometry models predict much more prominent reprocessing features in the spectrum of escaping radiation.
For large accretion disks (i.e., ), the local disk temperature can vary by more than an order of magnitude between the inner and outer radius. Rather than using an average disk temperature for calculating the spectrum emitted by the disk, a more proper treatment is to take into account the temperature structure. We can estimate the disk temperature as a function of radius by equating the flux of absorbed coronal radiation with thermal emission,
| (10) |
where , is the differential covering fraction of a ring of radius , and is determined numerically using equation (9). Using equation (4), the temperature can finally be expressed as
| (11) |
In Fig. 4 we show how varies with . From a numerical fit, we find that roughly decreases as as compared to a power-law of corresponding to the standard –disk models (Shakura & Sunyaev (1973)).

It should be remembered, however, that if any accretion-energy were dissipated directly into the accretion disk (), then the disk temperature would be higher than the values given above. To address this possibility, we consider a simple model where, for , the accretion disk behaves as the standard disk (Shakura & Sunyaev (1973)), while, for , all of the accretion energy is dissipated into the corona. In order to determine the relative importance of the internal dissipation of energy, compared to the contribution from coronal illumination, we estimate the disk temperature by neglecting the contribution from illumination. In addition, we make the simplifying assumption that the disk is optically thick and radiates as a blackbody such that the emitted flux is equal to the dissipation rate,
| (12) |
where we have assumed (Frank, King, & Raine, 1992). Defining , where is the efficiency by which the accretion process converts gravitational energy into radiation, and using the standard definition of the Eddington luminosity, , we can express the disk temperature as
| (13) |
By comparing equation (13) with equation (11) (or Fig. 4), it appears that the heating rate due to the direct dissipation of accretion energy is comparable to that from coronal illumination. A proper treatment of the disk temperature structure would be to equate thermal emission with both heating mechanisms. Such a treatment is outside the scope of this paper; with a heating rate equal to twice the value used in equation (13), the disk temperature will be roughly times higher than the value given in equation (13) ( is proportional to the total heating rate per unit area). Therefore, the inclusion of direct energy dissipation into the disk changes the disk’s total luminosity, but does not significantly change the temperature profile of the disk.
For simplicity, we have assumed that the intrinsic flux of thermal radiation is constant with respect to radius (the emission due to reprocessing, however, is determined locally by equating emission with absorption). This approximation is not too important since the emission due to reprocessing is higher than the emission due to internal dissipation for the models considered in this paper. In regards to the soft excess issue, for , these models slightly overestimate the predicted amount of soft excess by less than 10%.
4.1.3 Covering Fraction of Corona
In all of our models, the seed-photons are produced within the cold accretion disk (we neglect bremsstrahlung radiation). For this geometry, however, not all seed photons have to propagate through the corona prior to escaping the system. Therefore, even for optically thick models, a very large soft excess of radiation is always predicted. The covering fraction of the corona, evaluated on the accretion disk at a distance from the center, is given by
| (14) |
where is the radius of the corona. As shown in Fig. 5, the covering fraction of the corona rapidly decreases with increasing .

In order to estimate the fraction of the thermal radiation emitted by the accretion disk that interacts with the corona, we average over the accretion disk, weighted by the thermal flux, ,
| (15) |
For an accretion disk heated solely by illumination, we found that (Fig. 4). On the other hand, for the case where the disk is heated solely by internal dissipation, i.e., the standard -disk, (Shakura & Sunyaev (1973)). For a rough estimate of when both disk heating mechanisms are important, we assume . In Fig. 6 we show how this averaged covering fraction depends on .

For , , and at least % of the thermal radiation escapes the system without interacting with the corona, even if the corona is optically thick. In contrast, for the slab geometry models, all of the thermal radiation must propagate through the corona prior to escaping the system. Therefore, the spheredisk models always predict that a large amount of thermal radiation, relative to the amount of Comptonized radiation, will escape the system. Unless this thermal radiation is absorbed by the interstellar matter (ISM), it will appear as a soft excess of radiation.
For , the self-consistent temperature structure varies by roughly 30% for the case where the heating rate is uniform with volume. For these optical depths, the outer shells of the corona are the hottest while the center region is the coldest. This variation is not large enough such that the predicted spectra contain a “hardening” feature that mimics the hardening due to Compton reflection (Skibo & Dermer (1995)).
For the spheredisk geometry, the accretion disk receives less illumination from the corona since the covering fraction is lower than in the slab geometry case, while the surface area of the disk is larger. In §4.1, we estimated the temperature structure due to either coronal illumination or internal dissipation of accretion energy (equation 13). For either case,
| (16) |
where , for heating by coronal illumination and for the standard -disk. The flux of radiation emitted by an accretion disk is approximated by
| (17) |
where is the Planckian distribution. In Fig. 7, we show the corresponding spectrum, , for , and we compare to a Planckian distribution corresponding to the temperatures eV and eV.

It is seen that the Planckian distributions approximate the high-energy tail fairly-well. The disagreement at energies lower than eV is irrelevant since this radiation is efficiently absorbed by the ISM. In addition, since the temperature decreases rapidly with radius, most of the radiation having an energy eV is emitted within the inner region of the disk, and the exact value of is unimportant. Therefore, since the Comptonized spectrum is insensitive to the exact shape of the spectrum of seed photons, we used a Planckian distribution corresponding to a single disk temperature of eV to approximate the exact integrated disk spectrum.
4.2. Application to Cyg X-1
We computed a grid of models, in which the range of seed opacities is and the range of coronal compactness parameters is . In Fig. 8, for eV, we compare the predicted spectrum of escaping radiation, modified by interstellar absorption, of our “best-fit” model to the composite spectrum of Cyg X-1. Since the seed photons enter the corona from the exterior of the sphere, the effective optical depth of the sphere is reduced.

Therefore, the total optical depth (as defined by , where ) must be higher than that for the slab geometries in order for the models to predict similar power-laws. Our “best-fit” model has a total optical depth and an average coronal temperature keV.
With this geometry, the corona is able to reach much higher temperatures as compared to the slab models because the corona is “photon-starved,” i.e., the luminosity of the seed photons is much less than the luminosity of the hard X-rays (Zdziarski et al. (1990)). As discussed above, most photons that are reprocessed within the accretion disk do not re-enter the corona. Therefore, the Compton cooling mechanism that prohibits slab geometry coronae from having high temperatures is not as efficient in keeping the spherical coronae cool. In Fig. 9, we show the allowed regime of optical depths and average corona temperatures for the spheredisk geometry.

Since the coronae are allowed to be much hotter than the slab geometry models, there are self-consistent {,} combinations such that the observed power-law and cut-off in BHCs can be reproduced. Since more than 90% of the thermal radiation escapes the system without passing through the corona, the soft excess is very large for these models. As in the case with the slab-geometry models, Galactic absorption is not sufficient to “hide” the soft excess for the 200 eV disk models. In Fig. 8, for eV, we compare our best-fit model to the spectrum of Cyg X-1. Here, the predicted thermal excess appears to be consistent with the observational data, and the entire-broad band spectrum is adequately described by the model. As discussed in the Appendix, even though we are fitting ‘unfolded’ data, we are confident that this model provides a good representation of the intrinsic photon-spectrum of Cyg X-1. However, the main point of this paper is to motivate a more detailed study of the sphere+disk model, using a more rigorous method of data analysis.
A nice feature of the spheredisk model is that it naturally predicts an “effective” disk temperature to be much lower than in the slab geometry models. In fact, due to the lower disk temperature, this model appears to predict a soft excess that is consistent with the observations (Bałucińska & Hasinger (1991); Bałucińska-Church et al. (1995)). The quality of the observations, however, is not too good for keV, which is unfortunate since this is the energy range where the spectrum is most sensitive to the disk temperature. Also, as noted in § 3.2, Cyg X-1 usually contains a soft-excess component. We plan on comparing this model to better observational data in this energy range (e.g., RXTE and ASCA data) in order to constrain this model further.
To test whether the predicted thermal radiation from the accretion disk is observable in the UV, we have compared the UV flux predicted by our model for the spectral band from 1200 Å to 1950 Å with the flux observed in this band by IUE. Our predicted flux is two to three orders of magnitude smaller than the flux in an IUE Low Dispersion spectrum of HDE 226868 made in June 1980. This is consistent with earlier findings that the UV spectrum of the system HDE 226868 — Cyg X-1 is dominated by emission from the O star (Treves et al. (1980); Pravdo et al. (1980)). Therefore, IUE observations cannot be used to constrain the disk temperature of our models.
Due to the smaller covering fraction of the accretion disk, the models predict weaker reprocessing features in the escaping radiation field as compared to the slab models. In principle, in modeling BHCs, the value of can be constrained by the equivalent width of the Fe K fluorescent line, which is proportional to the solid angle of the disk, . For Cyg X-1, the EW of the Fe K line is measured to be eV (Ebisawa et al. (1996); Gierliński et al. (1997)). With (corresponding to a disk covering fraction ), our best fit models predict an EW of eV. Therefore, models with smaller will predict EWs that are too low to be consistent with the observations. For , (Fig. 3). On the other hand, since does not vary significantly for , this method cannot provide an upper limit on the size of the accretion disk.
5. Discussion
Our self-consistent slab accretion disk corona models are unable to explain the broad-band X-ray spectra of Cyg X-1. The modeled coronae are either too cold or have an optical depth that is too small, resulting in spectra that are much softer than the observed spectrum. All previous ADC models that have successfully described the spectra of Cyg X-1 have temperature and opacity values that are outside the allowed region of self-consistent values. In addition, as discussed in paper I, the predicted angle-averaged equivalent width (EW) of the Fe K fluorescent line is eV, a value roughly three times higher than the measured value for Cyg X-1 (Ebisawa et al. (1996)), indicating that the covering fraction of the reprocessing material is .
We believe that there is no way around these shortcomings of the slab geometry model and that these ADC models are not the appropriate models for explaining the high-energy spectra of BHCs. This claim is in agreement with Gierliński et al. (1997), who, by fitting the joint Ginga-OSSE observation of Cyg X-1 with a power law plus a reflection component, find that the solid angle of the cold medium is , significantly lower than the angle corresponding to the slab geometry, a result consistent with Ebisawa et al. (1996). Gierliński et al. (1997) also argue that the corona must be “soft-photon starved,” which rules out a slab geometry.
For ADC models with a spheredisk geometry, there are self-consistent temperature and opacity combinations such that the power-law and cut-off portions of the spectra of BHCs can be explained. In addition, due to the small covering fraction of the disk as seen from the corona, it is possible that the “effective” disk temperature (a flux-weighted average disk temperature) can be as low as eV. With such low values, the models predict a thermal excess (or lack thereof) that appears to be consistent with the observations of Cyg X-1 since Galactic absorption is more efficient at these lower energies. It is still unclear, however, whether an ADC model having this geometry is stable, as the Shapiro & Lightman (1976) model suffers from a thermal instability (Piran (1978)). In our models, we can only assume a corona/disk morphology, but we cannot determine whether this morphology is thermally or dynamically stable. The spheredisk geometry does approximate the geometry corresponding to the advection-dominated models of Narayan (1996) (Narayan (1996), and references therein) which appear to be thermally stable. In addition, our best-fit models for Cyg X-1 have an optical depth and a coronal temperature keV, values that are consistent with the advection-dominated models if the mass accretion rate , where is the Eddington accretion rate (Narayan (1996)).
The results obtained here for Cyg X-1 are also applicable to other low state BHCs. In Fig. 10 we compare the spectra of the black hole X-ray transients GS2023+338 and GRO J0422+32 to the predicted spectra from our sphere+disk geometry model.

Occasionally black hole X-ray transients have spectra that are dominated by a strong soft-excess at lower energies and a pure power-law component at high energies. In the low state, however, GS2023+338 (=V404 Cyg) and GRO J0422+32 did not contain a soft excess, and their spectra of are very similar to that of the low-state of Cyg X-1. Therefore, it appears that photon starved ADC models, such as the spheredisk geometry, are applicable in explaining the observed X-ray spectra of many BHCs.
Our “fits” to the unfolded data should be interpreted as a motivation to consider this model in much more detail. For example, we have recently implemented our sphere+disk model in tabular form for the XSPEC user-defined model. We have recently implemented the sphere+disk geometry spectral grid as an user-defined model for XSPEC (version 9, Arnaud (1996)), and are currently analyzing new data of Cyg X-1 and other BHCs from the RXTE satellite. Our preliminary results are in agreement with the results presented in this paper.
ACKNOWLEDGEMENTS
We thank M. Nowak for the many useful discussions. We also thank K. Ebisawa, the referee, for his useful suggestions which improved the clarity of this paper. This work has been financed by NSF grants AST91-20599, AST95-29175, INT95-13899, and NASA Grant NAG5-2026 (GRO Guest Investigator program), DARA grant 50 OR 92054, and by a travel grant to J.W. and M.G.M. from the DAAD. This research has made use of data obtained through the HEASARC Online Service, provided by NASA-GSFC, and of data obtained through the IUE VILSPA data server, operated by the European Space Agency.
Appendix A
Comparisons of our models with observations have relied on the photon-spectrum presented in Fig. 8. Although the use of “unfolded” X-ray spectra is very common in the astronomical literature, it is important to keep in mind how these spectra are prepared. Due to the poor energy resolution of today’s X-ray detectors, the inversion of the detector response-matrix is generally impossible (Blisset & Cruise (1979), and references therein). Thus, in order to get an estimate of the intrinsic photon spectrum from a source, a spectral model has to be fit to the spectrum observed by the X-ray detector, usually using a -reduction method and an estimate for the detector response matrix (Gorenstein, Gursky, & Garmire, 1968). If the -value resulting from the fitting process is small, then it is assumed that the modeled photon-spectrum is a good representation of the observed photon-spectrum. In order to produce an “unfolded” spectrum, the additional assumption is made that the residual (for a given detector energy channel) between the modeled spectrum (folded through the response matrix) and the observed count-rate is a good representation of the deviation between the spectral model and the intrinsic photon-spectrum (in energy space). Thus, at a given energy, the product of the modeled photon-flux and the ratio between the observed count-rate and the (estimated) model count-rate is what is called the “unfolded” spectrum.
Although a small -value of the fit to the “unfolded” spectrum usually implies that the model is an adequate description of the intrinsic spectrum, sometimes this is not true. Fitting our models to the observed data in detector-space (using the method described above) would, in principle, give the best method of determining the “goodness of fit.” However, the CPU time needed to obtain model spectra with a signal to noise ratio that is suitable for spectral fitting is prohibitively high, and we were forced to use a simplified approach; for a particular detector, we simulated an observation using our modeled spectrum as the intrinsic spectrum, the correct detector response matrix, background estimate, and observational Poisson noise. This simulated spectrum was then fit with several spectral models that are typically used to describe the X-ray spectra of BHCs (e.g., a power-law with an exponential cutoff).
We performed these tests using several typical X-ray detectors (ROSAT, XTE-PCA, HEXE) and using typical count-rates and observation times for these detectors. In all of the tests the fit-parameters found using our model spectrum were in agreement with typical fit-parameters found in the real observation of Cyg X-1. In the simulated XTE-PCA observation, e.g., the model spectrum below 30 keV can be roughly described by an absorbed power-law with an index of . This index is similar to those found, e.g., by Done et al. (1992) and Döbereiner et al. (1995). In the residuals of the simulation the Fe line and the reflection hump are clearly visible. Using a more appropriate model that incorporates reflection, the simulated spectrum is best described by reflection of a power-law of index off a cold accretion disk with covering factor 0.4. Using an assumed length of 5 ksec for the ROSAT-PSPC observation it is possible to see evidence for the soft-excess in the simulated observation. According to this simulated observation, the soft-excess as seen by ROSAT PSPC can be described by a black-body with a temperature of about 100 eV or less, which is roughly comparable with the observations by Bałucińska-Church et al. (1995). Therefore, we are confident that the model-spectrum of Fig. 8 is a good representation of the intrinsic photon-spectrum of Cyg X-1.
References
- Aab et al. (1984) Aab, O. É., Bychkova, L. V., Kopylov, I. M., Kumaĭgorodskaya, R. N., 1984, Sov. Astron., 28, 90
- Arnaud (1996) Arnaud, K. A., 1996, in: Jacoby, G. H., Barnes, J., eds, Astronomical Data Analysis Software and Systems V, ASP Conf. Series Vol 101, San Francisco, p. 17
- Bałucińska & Hasinger (1991) Bałucińska, M., Hasinger, G., 1991, A&A, 241, 439
- Bałucińska-Church et al. (1995) Bałucińska-Church, M., Belloni, T., Church, M. J., Hasinger, G., 1995, A&A, 302, L5
- Blisset & Cruise (1979) Blisset, R. J., Cruise, A. M., 1979, MNRAS, 186, 45
- Bochkarëv et al. (1986) Bochkarëv, N. G., Karitskaya, E. A., Luskutov, V. M., Sokolov, V. V., 1986, SvA, 30, 43
- Döbereiner et al. (1995) Döbereiner, S., et al., 1995, A&A, 302, 115
- Döbereiner et al. (1994) Döbereiner, S., et al., 1994, A&A, 287, 105
- Dolan (1992) Dolan, J. F., 1992, ApJ, 384, 249
- Done et al. (1992) Done, C., Mulchaey, J. S., Mushotzky, R. F., Arnaud, K. A., 1992, ApJ, 395, 275
- Dove et al. (1997) Dove, J. B., Wilms, J., Begelman, M. C., 1997, ApJ, submitted (paper I)
- Ebisawa et al. (1996) Ebisawa, K., Ueda, Y., Inoue, H., Tanaka, Y., White, N. E., 1996, ApJ, 467, 419
- Frank et al. (1992) Frank, J., King, A., Raine, D., 1992, Accretion Power in Astrophysics, (Cambridge: Cambridge University Press)
- George, Nandra, & Fabian (1990) George, I. M., Nandra, K., Fabian, A. C., 1990, MNRAS, 242, 28 com.
- Gierliński et al. (1997) Gierliński, M., Zdziarski, A. A., Done, C., Johnson, W. N., Ebisawa, K., Ueda, Y., Haardt, F., Phlips, B. F., 1997, MNRAS, in press
- Gies & Bolton (1982) Gies, D. R., Bolton, C. T., 1982, ApJ, 260, 240
- Gies & Bolton (1986) Gies, D. R., Bolton, C. T., 1986, ApJ, 304, 389
- Gorenstein et al. (1968) Gorenstein, P., Gursky, H., Garmire, G., 1968, ApJ, 153, 885
- Grebenev et al. (1993) Grebenev, S., et al., 1993, A&AS, 97, 281
- Haardt (1993) Haardt, F., 1993, ApJ, 413, 680, (H93)
- Haardt et al. (1993) Haardt, F., Done, C., Matt, G., Fabian, A. C., 1993, ApJ, 411, L95
- Haardt & Maraschi (1993) Haardt, F., Maraschi, L., 1993, ApJ, 413, 507, (HM93)
- Herrero et al. (1995) Herrero, A., Kudritzki, R. P., Gabler, R., Vilchez, J. M., Gabler, A., 1995, A&A, 297, 556
- Hutchings (1978) Hutchings, J. B., 1978, ApJ, 226, 264
- Inoue (1989) Inoue, H., 1989, in Proc. 23rd ESLAB Symp. on Two Topics in X-ray Astronomy, Vol. 2, p. 783, ESA
- in’t Zand et al. (1993) in’t Zand, J. J. M., Pan, H. C., Bleeker, J. A. M., Skinner, G. K., Gilfanov, M. R., Sunyaev, R. A., 1993, A&A, 266, 283
- Kroeger et al. (1996) Kroeger, R. A., et al., 1996, A&AS, 120, C117
- Kitamoto et al. (1990) Kitamoto, S., et al., 1990, PASJ, 42, 85
- Kurfess (1995) Kurfess, J. D., 1995, Adv. Space Res., 15(5), 103
- Liang & Nolan (1984) Liang, E. P., Nolan, P. L., 1984, Space Sci. Rev., 38, 353
- Marshall et al. (1993) Marshall, F. E., Mushotzky, R. F., Petre, R., Serlemitsos, P. J., 1993, ApJ, 419, 301
- Miyamoto et al. (1992) Miyamoto, S., et al., 1992, ApJ, 391, L21
- Narayan (1996) Narayan, R., 1996, ApJ, 462, 136
- Narayan & Yi (1995a) Narayan, R., Yi, I., 1995a, ApJ, 444, 231
- Narayan & Yi (1995b) Narayan, R., Yi, I., 1995b, ApJ, 452, 710
- Ninkov et al. (1987) Ninkov, Z., Walker, G. A. H., Yang, S., 1987, ApJ, 321, 425
- Nowak et al. (1996) Nowak, M. A., Vaughan, B. A., Dove, J., Wilms, J., 1996, in Accretion Phenomena and Related Outflows, IAU Coll. 163, ed. D. Wickramasingle, L. Ferrario, G. Bicknell, in press
- Oda (1977) Oda, M., 1977, Space Sci. Rev., 20, 757
- Piran (1978) Piran, T., 1978, ApJ, 221, 652
- Pravdo et al. (1980) Pravdo, S. H., White, N. E., Kondo, Y., Becker, R. H., Boldt, E. A., Holt, S. S., Serlemitsos, P. J., McCluskey, G. E., 1980, ApJ, 237, L71
- Shakura & Sunyaev (1973) Shakura, N. I., Sunyaev, R. A., 1973, A&A, 24, 337
- Shapiro & Lightman (1976) Shapiro, S. L., Lightman, A. P., 1976, ApJ, 204, 187
- Skibo & Dermer (1995) Skibo, J. G., Dermer, C. D., 1995, ApJ, 455, L25
- Sokolov (1987) Sokolov, V. V., 1987, Sov. Astron., 31, 419
- Stern et al. (1995) Stern, B., Begelman, M. C., Sikora, M., Svensson, R., 1995, MNRAS, 272, 291
- Sunyaev et al. (1993) Sunyaev, R. A., 1993, A&A, 280, L1
- Sunyaev & Titarchuk (1980) Sunyaev, R. A., Titarchuk, L. G., 1980, A&A, 86, 121
- Tanaka & Lewin (1995) Tanaka, Y., Lewin, W. H. G., 1995, in X-Ray Binaries, ed. W. H. G. Lewin, J. van Paradijs, E. P. J. van den Heuvel (Cambridge: Cambridge Univ. Press), 126
- Titarchuk (1994) Titarchuk, L., 1994, ApJ, 434, 570
- Treves et al. (1980) Treves, A., et al., 1980, ApJ, 242, 1114
- Wilms et al. (1997) Wilms, J., Dove, J. B., Maisack, M., Staubert, R., 1997, A&AS, 120, C159
- Zdziarski et al. (1990) Zdziarski, A. A., Coppi, P. S., Lamb, D. Q., 1990, ApJ, 357, 149