12.07.1; 12.03.3; 11.17.4; 13.19.3
\offprintsF. Courbin (Liège address)
11institutetext:
Institut d’Astrophysique, Université de Liège,
Avenue de Cointe 5, B–4000 Liège, Belgium
22institutetext: URA 173 CNRS-DAEC, Observatoire de Paris,
F–92195 Meudon Principal Cédex, France
33institutetext: Harvard-Smithsonian Center for Astrophysics, MS-51, 60 Garden Street,
Cambridge, MA 02138, USA
44institutetext: Institute of Theoretical Astrophysics, University of Oslo,
Pb. 1029, Blindern, 0315 Oslo, Norway
55institutetext: NORDITA, Blegdamsvej 17, DK–2100 Copenhagen Ø, Denmark
The geometry of the quadruply imaged quasar PG 1115+080; implications for ††thanks: Based on observations taken at the Nordic Optical Telescope and the Canada France Hawaii Telescope
Abstract
Time delay measurements have recently been reported for the lensed quasar PG 1115+080. These measurements can be used to derive , but only if we can constrain the lensing potential. We have applied a recently developed deconvolution technique to analyse sub-arcsecond band images of PG 1115+080, obtained at the Nordic Optical Telescope (NOT) and the Canada France Hawaii Telescope (CFHT). The high performance of the deconvolution code allows us to derive precise positions and magnitudes for the four lensed images of the quasar, as well as for the lensing galaxy. The new measurement of the galaxy position improves its precision by a factor of and thus strengthens the constraints on the lensing potential. With the new data, a range of models incorporating some of the plausible systematic uncertainties yields km s-1 Mpc-1.
keywords:
gravitational lensing - data analysis1 Introduction
Gravitationally lensed quasars with multiple images provide a unique tool for determining the cosmological parameters independently of the classical methods. In particular, time delays between the images of a lensed quasar can be used to determine the Hubble constant (e.g. Refsdal 1964, Grogin & Narayan 1996).
Extensive photometric monitoring of lensed quasars has been undertaken to obtain accurate light curves for the most promising objects. Unfortunately, precise time delays have been difficult to obtain due to poor temporal sampling of the light curves, possible contamination by microlensing and short time scale events.
Light curves have recently been obtained for the quadruply imaged quasar PG 1115+080 (Schechter et al. 1997). The good time coverage, together with the fact that microlensing does not seem to significantly contaminate the intrinsic photometric variations of the lensed source, yield measurements of two time delays between three components of the system (Schechter et al. 1997, Bar-Kana 1997). Keeton and Kochanek (1997, hereafter KK97) showed that it was difficult to constrain because of degeneracies in the lens models. However, KK97 also showed that the constraints could be improved by measuring the position of the lensing galaxy relative to the quasar images better than was possible with the pre-refurbishment HST observations of Kristian et al. (1993, hereafter K93). The aim of the present paper is to provide a better determination of the galaxy position and, thus, an improved estimate of .
2 Observations
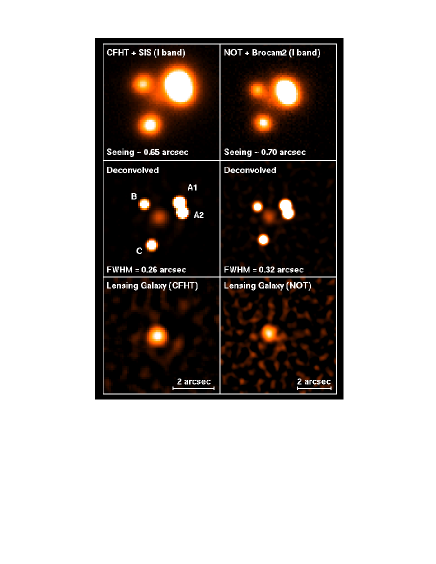
The observations consist of five band images of PG 1115+080 with a typical seeing of 0\farcs6-0\farcs7. Using SIS, the tip-tilt adaptive optics camera installed at the Cassegrain focus of the CFHT, two 600s exposures were taken on the night of 1995 December 27. The detector was a Loral 3, 20482048 pixel CCD (pixel scale 0\farcs0865). In addition, three band frames were obtained at the NOT in direct imaging mode. Two 200s exposures were taken on the night of 1996 June 7 and an equivalent exposure was obtained on 1996 June 10. The Brocam2 20482048 CCD camera was used (pixel scale 0\farcs1071).
3 Deconvolution - a new algorithm
The images were deconvolved using a new method, described by Magain, Courbin & Sohy (1997), that allows precise photometric and astrometric measurements of strongly blended point sources superimposed on a diffuse background. The main idea of this algorithm is to deconvolve by a PSF narrower than the total observed PSF so as to preserve a good sampling of the deconvolved image. As a consequence, 1) the image can be decomposed in a sum of point sources, plus diffuse background and 2) the final resolution of the deconvolved images is chosen by the user.
We chose the final deconvolved PSF of the CFHT as a Gaussian with a Full-Width-Half-Maximum (FWHM) of 3 pixels. The NOT images were deconvolved on a grid of pixels two times smaller than the original frames (i.e. 0\farcs05355) in order to keep a good sampling of the lensing galaxy, and the final PSF was a Gaussian with a FWHM of 6 (smaller) pixels. This led to resolutions of 0\farcs26 for the CFHT and 0\farcs32 for the NOT. The PSF used to reach these resolutions was constructed from two stars about one magnitude brighter than the quasar image and situated 1′ away from the lens.
The weight attributed to the local smoothing of the background component in our deconvolved model image (see Magain et al. (1997) for more details) was chosen so that the residuals at the location of the lensing galaxy had the correct statistical distribution, i.e. Gaussian with a standard deviation of 1 (in units of the photon noise). In this way we avoided under- or over-fitting in the area of interest. A constant smoothing term was used for the whole image and was adapted to the area of the lensing galaxy. This leads to slight overfitting of the sky noise farther away from the target and produces some noise amplification at low light levels.
In the CFHT images, the PSF shows variations of the order of 5–10% from one side of the total field to the other. Therefore, we allowed the PSF to depart slightly from that derived from the two neighboring stars. The PSF was constrained to deviate by the smallest amount consistent with an artefact-free deconvolution of the 4 quasar images.
Fig. 1 shows the result of the deconvolution for a CFHT and a NOT image. Since the greyscale was chosen to display the full dynamic range, this image clearly shows that there are no “deconvolution artefacts” or “ringing effects” around the point sources.
4 Geometry of PG 1115+080
Five images were used to measure the position of the lens galaxy. For each frame, the deconvolution procedure returned the coordinates of the four point sources, the deconvolved image as well as the image of the diffuse objects (Fig. 1). The latter was used to measure the position of the lensing galaxy.
To compare our results with K93’s results, we transformed our coordinates to the coordinate system they used. The scaling factor and rotation angle were chosen to match the positions of the four point sources as well as possible, and the transformation was then applied to the galaxy coordinates. Fig. 2 compares the new positions with the positions from K93. The precision of the galaxy position has been increased by more than a factor of 3, from 50 mas with the pre-refurbishment HST images (K93), to 15 mas with the new data and deconvolution technique. Note that K93 used a pixel scale of 0\farcs04389, which Gould & Yanny (1994) revised to 0\farcs04374. Table 1 summarizes the geometry of PG 1115+080, in the same orientation as K93, but using the pixel size given by Gould & Yanny (1994).

The galaxy position was measured on each deconvolved background by the first two authors independently, using either Gaussian fitting or the first order moments of the light distribution, resulting in 10 measurements (one for each author and each frame). We first averaged the two measurements for each frame and then computed a weighted mean of the 5 independent measurements, with a weight twice as large for the NOT images as for the CFHT images because the latter are corrupted by PSF variation across the field.
The standard deviation of the mean is mas for the point sources and mas for the lensing galaxy. The effect of a variable PSF was tested by performing numerical simulations which indicate that possible systematic effects could affect the point sources by another 2 mas and the lensing galaxy by an additional 10 mas. This leads to final 1 error bars of 3 mas for the point sources and 15 mas for the lensing galaxy.
The intensity ratio of A2 relative to A1 is given in Table 1. This ratio does not show significant variations among our frames or between our frames and the K93 frames, even though they were taken at four different epochs. This suggests that microlensing does not significantly affect the light curves of A1 and A2 in the band.
The galaxy magnitude was derived on the NOT deconvolved frames by aperture photometry (0\farcs9 diaphragm in diameter). The zero point was computed using several standard stars. Images with a much higher signal-to-noise would be necessary to derive the shape of the galaxy. However, the galaxy observed in the present data is compatible with a fuzzy circular object, broader than a point source.
| Image | (′′) | (′′) | |
|---|---|---|---|
| A1 | |||
| A2 | |||
| B | |||
| C | |||
| Lens |
5 Implications for
Schechter et al. (1997) recently obtained light curves for images B, C, and the mean of the close pair AA1+A2 (Fig. 1). Bar-Kana (1997) analysed the light curves using a variety of assumptions about how to treat the photometric errors. He found that the best resolved time delay is days, and that the other independent time delay is best expressed in terms of the time delay ratio , with a systematic uncertainty.
Using the quasar image and galaxy data of K93, Keeton, Kochanek & Seljak (1997), Schechter et al. (1997), and KK97 found that the system can be fit only by including a perturbation from a small group of galaxies near the lens galaxy (Young et al. 1981, Kundić et al. 1997). There are significant degeneracies in the models related to the position of the group and to the profiles of the galaxy and group, but with more precise data the degeneracies can be reduced (KK97). In particular, reducing the uncertainties in the lensing galaxy position can constrain the position of the group.
We studied the effects of the improved measurement of the galaxy position by recomputing the models from KK97. We modeled the galaxy as an ellipsoidal mass distribution with a variable position, ellipticity, and orientation, and we used both an isothermal (dark matter) model and a constant model. The constant model was approximated by a modified Hubble model because it has an analytic deflection formula and is therefore simpler than a de Vaucouleurs model; the Hubble model was chosen to have a fixed core radius ( kpc). We modeled the group as a spherical mass distribution with a variable position, and we considered both a singular isothermal sphere (SIS) model expected for a dark matter halo, and a point mass model to examine the effects of making the group more concentrated. Increasing the core radius of the galaxy or group would decrease the implied value for , but dark matter distributions generally appear to be singular.

Table 2 compares the new results with the results from KK97 to show the effects of improving the galaxy position. For models with an isothermal galaxy the best-fit has decreased despite the fact that the constraints have become stronger, while for models with a Hubble galaxy the has increased slightly but the fit is still good.
Following KK97, we determined from a Bayesian analysis of the lens models. Using discrete model classes limits the generality of the analysis, but until even better constraints are available (such as the shape and profile of the galaxy) a full model survey is unwarranted. The four model classes examined here illustrate the range of effects from model uncertainties; for other model classes see KK97. By reducing the range of acceptable lens models, the improved constraint from the galaxy position decreases the error bars by a factor of two (see Table 2 and Figure 3). The new position also increases the probability of the isothermal (dark matter) galaxy relative to the constant galaxy. Finally, it slightly strengthens the discrepancy noted by KK97 between the lens models and Bar-Kana’s (1997) value for . Improved measurements of would reveal whether the apparent discrepancy is due to systematic effects in the measurements or to a poor lens model.
| Galaxy: | Isothermal | Modified Hubble | |
|---|---|---|---|
| SIS Group | () | () | |
| () | () | ||
| Point Mass | () | () | |
| Group | () | () |
Based on K93 galaxy position, KK97 found km s-1 Mpc-1. The Bayesian analysis using our new data gives a total probability distribution with km s-1 Mpc-1, where these error bars incorporate the time delay uncertainties as well as some systematic uncertainties in the lens models related to the profiles of the galaxy and group and to the position of the group.
Our new deconvolution technique could be used to analyse all the images used for the light curves and to derive the independent light curves of A1 and A2. The high precision of the method might, in addition, make it possible to further narrow the uncertainties on the time delays and hence on .
Acknowledgements.
F.C. is supported by ARC 94/99-178 “Action de Recherche Concertée de la Communauté Française” and Pôle d’Attraction Interuniversitaire P4/05 (SSTC, Belgium). C.R.K. is supported by ONR-NDSEG grant N00014-93-I-0774. C.S.K. is supported by NSF grant AST-9401722.References
- [1] Bar-Kana R., 1997, preprint, astro-ph/9701068
- [2] Gould A., Yanny B., 1994, PASP 106, 101
- [3] Grogin N.A., Narayan R., 1996, ApJ 464, 92; erratum 1996, ApJ 473, 570
- [4] Keeton C.R., Kochanek C.S., 1997, in press
- [5] Keeton C.R., Kochanek C.S., Seljak U., 1997, ApJ 482, 604
- [6] Kristian J. et al. 1993, AJ 106, 1330
- [7] Kundić T., Cohen J.G., Blandford R.D., 1997, preprint, astro-ph/9704109
- [8] Magain P., Courbin F., Sohy S., 1997, preprint, astro-ph/9704059
- [9] Refsdal S., 1964, MNRAS 128, 295
- [10] Schechter P.L. et al. 1997, ApJ 475, L85
- [11] Young, P.J., Deverill, R.S., Gunn, J.E., Westphal, J.A., Kristian, J., 1981, ApJ, 244, 723