The Abundance Gradient of NGC 1365: Evidence for a Recently Formed Bar in an Archetype Barred Spiral Galaxy?
Abstract
Emission-line optical spectrophotometry for 55 H ii regions in the prominent southern barred spiral galaxy NGC 1365 is presented. Nebular diagnostic diagrams such as [N ii]/[O ii] and [S ii]/[O ii] versus ([O ii] + [O iii])/H show that the H ii regions of the barred galaxy have the same range of physical conditions as found in non-barred late-type galaxies. Extinction is moderately high across the disc and there is evidence for a slight trend of extinction with galactocentric distance; the logarithmic extinction at H falls from about (H) = 1.2 in the centre to 0.6 – 0.8 in the outer regions. The global O/H distribution has a moderate gradient of dex -1 ( dex kpc-1) consistent with the known trend between the slope of the abundance gradient and the strength of the bar. A break is seen in the O/H gradient just beyond the -4/1 resonance, the gradient being moderately steep at dex (–0.05 dex/kpc) inside this resonance, and flat beyond 0.55. The abundance distribution is compared with another barred spiral galaxy, NGC 3359, and with that of two well-sampled normal spiral galaxies, NGC 2997 and M 101. The possibility that the bar formed recently in NGC 1365 is considered. The difficulties encountered in doing spectrophotometry with fibre optics are discussed and shown not to be insurmountable.
keywords:
galaxies: individual (NGC 1365) – galaxies: ISM – galaxies: kinematics and dynamics – galaxies: spiral – galaxies: structure – H ii regions – techniques: spectroscopic1 Introduction
Bars, or non-axisymmetric central light distributions, are found in about 2/3 of the disc galaxies in the present-day universe (Sellwood & Wilkinson [1993]). Mechanisms for bar formation have been explored quite extensively (Noguchi [1988], [1996a], [1996b], Shlosman & Noguchi [1993]). As a result of cooling, gas discs are subject to gravitational instability and bars can arise spontaneously. In galaxies of earlier types, due the stabilizing effect of the growing bulge, the disc is much less prone to spontaneous bar formation. A stronger perturbation is then needed, like an interaction with a companion, a merger or the tidal forces of a galaxy cluster. The bar will not last forever because it may dissolve when the core mass becomes important, and will contribute to the growth of the bulge ([1996]). This implies that some bars are young, and that some bulges could contain relatively young stars.
The fact that the heavy element abundance distribution is flatter in barred galaxies as compared with normal spirals of similar type can be explained by the action of inward and outward radial flows of interstellar gas induced by the non-axisymmetric potential of bars (Roberts et al. [1979]; Sellwood & Wilkinson [1993]; Friedli et al. [1994]). As a consequence, the slope of any pre-existing radial gaseous or stellar abundance gradient decreases with time. The long term effect is such that the stronger the bar is, the flatter the abundance gradient becomes with time (Friedli & Benz [1995]). The finding by Martin & Roy [1994] of a relationship between the slopes of the global abundance gradient and the strength of bars provides support for the scenario of recently formed bars (Roy [1996b]). Thus bars may not necessarily be primordial features (Combes & Elmegreen [1993]), but could also form at any time during the lifetime of a galaxy (Friedli & Benz [1995]; Martinet [1995]; Martin & Roy [1995]).
In late-type galaxies (SBc, SBb), a young bar (1 Gyr) will be characterized as being a gas-rich structure. Such bars can be the site of vigorous star formation; if the star formation process is not inhibited by the high cloud velocities, the radial abundance distribution will present a steep inner gradient (homogenizing effects being compensated by chemical enrichment due to vigorous star formation), combined with a flatter gradient beyond corotation due to dilution by the outward radial flows, as shown by Friedli et al. [1994] and Friedli & Benz [1995]. On the other hand, if the level of star formation in the bar is modest or absent due to inhibiting forces, the radial abundance gradient would be weak both in the bar and in the disc. In both cases, with young bars, one should see breaks in the radial abundance distribution, which move outward in the disc as times evolves. Some bulges, because they result in part from the stars in the bar being scattered out of the galaxy plane, should be polluted by ‘young’ stars aged between 0.5 and 1.0 Gyr. Although one cannot exclude the presence of young stars in bulges, they are very difficult to detect. The interstellar gas is a better laboratory to search for young bars. The best candidate found so far for a galaxy with a young bar is NGC 3359 where Martin & Roy [1995] have observed an abrupt O/H gradient in the central region (which has an intense episode of star formation), and a flat gradient beyond corotation. NGC 3319, observed by Zaritsky et al. [1994], appears to be a case similar to NGC 3359.
In this paper we wish to explore the O/H radial distribution in the prominent southern bar galaxy NGC 1365 in order to test the scenario of recent bar formation. NGC 1365 is as close to an archetype barred galaxy as one can find in the nearby universe. Its bar is very rich in gas and it has moderate star forming activity.
2 Observations and data reduction
2.1 The galaxy NGC 1365
NGC 1365, a dominant galaxy of the Fornax cluster, is probably the most spectacular of the nearby barred galaxies. Classified as SB(s)b I-II by de Vaucouleurs et al. [1991] (RC3), it has a Seyfert 1.5 type nucleus and a ‘hot spot’ nuclear region (Sersic & Pastoriza [1965]; Anatharamaiah et al. [1993]; Sandqvist et al. [1995]). A distance for NGC 1365 of 18 Mpc, as recently determined by a HST-WFPC2 Cepheid study [1996], is adopted. The galaxy has clearly defined offset dust lanes on the leading edge of the bar and along its two main spiral arms. A velocity jump has been observed across the eastern and western dust lanes ([1987]) indicative of strong shocks in the gas flow (Athanassoula [1992]). The general properties of NGC 1365 are listed in Table 1.
| Parameter | Value |
|---|---|
| (J2000) | 3h33m37.s37 |
| (J2000) | -36∘08′25.′′5 |
| Morphological type | SB(s)b I-II |
| Inclination | 40∘ |
| Position angle | 220∘ |
| Galactic extinction ( | 0.21 |
| Systemic velocity (km s-1) | 1640 |
| 5.′61 | |
| 0.51 | |
| D (Mpc) | 18.2 |
| Scale (pc arcsec-1) | 88 |
Spectrophotometry of several H ii regions in the galaxy was obtained by Pagel et al. [1979], Alloin et al. [1981] and Roy & Walsh [1988]; the earlier observations, although limited, suggested relatively high extinction, and a shallow global O/H abundance gradient, a now well-established feature of barred galaxies (Vila-Costas & Edmunds [1992]; Zaritsky et al. [1994]; Martin & Roy [1994]). Star formation activity is moderate or weak in the bar, except in the nuclear ring (radius 7′′).
NGC 1365 has been studied in H i (e.g. Ondrechen & van der Hulst [1989]), but it is only recently that a detailed H i investigation with the VLA has been completed and published by Jörsäter & van Moorsel [1995]; these authors show that NGC 1365 has a unique dropping rotation curve. Sandqvist et al. [1995] performed radio continuum and CO observations of the central parts of the galaxy, finding a radio jet and enhanced CO in the nucleus and dust lanes; references to earlier radio work can also be found in that paper. Sandqvist et al. [1995] estimated that the amount of molecular gas in the nuclear and bar region, is equal to the total amount of neutral atomic hydrogen in the galaxy, that is 15 109 M⊙. The H i distribution shows a hole in the central region where CO is the strongest and the neutral hydrogen is predominantly located in the spiral arm. The bar region is a very gas-rich feature.
2.2 Selection of H II regions
An AAT prime focus plate of NGC 1365 taken in the R band (RG 610 filter + O94-04 emulsion) on 1990 December 16 was scanned on the ESO PDS machine. The triplet corrector was employed giving a scale of 15.′′3 mm-1 and the scanning aperture was 50 m and sampling 25 m (0.′′381). This image is shown in Figure 1; 163 potential H ii regions were identified and their X,Y positions determined by either fitting a 2-D Gaussian or more often simply by centroiding the image by eye. Given that there was no off-emission band image with which to check whether the identified regions were indeed H ii regions, some contamination by stars, globular clusters or distant galaxies was anticipated. In addition to the H ii regions candidates, the X,Y positions of HST GSC stars were measured by fitting 2-D Gaussians and a six coefficient astrometric solution was made for 23 GSC stars. The RA and Dec of the potential H ii regions was then calculated. ’Sky’ positions were also selected away from the galaxy and free of stars. In selecting H ii regions to observe, a number of considerations were taken in account:
-
[(iv)]
-
1.
about 55 object and sky fibres can be observed per fibre bundle per aperture plate;
-
2.
the full range of H ii region apparent brightness should be covered in order to avoid any bias;
-
3.
fibres cannot be closer than 19′′. Thus only one H ii region could be selected in a crowded region; a nearby H ii region could of course be selected for a second aperture plate. Some bright H ii regions should be included in common between different aperture plates to check the observation quality and reproducibility of calibration;
-
4.
the faintest H ii regions could be included on more than one aperture plate to increase the exposure time.
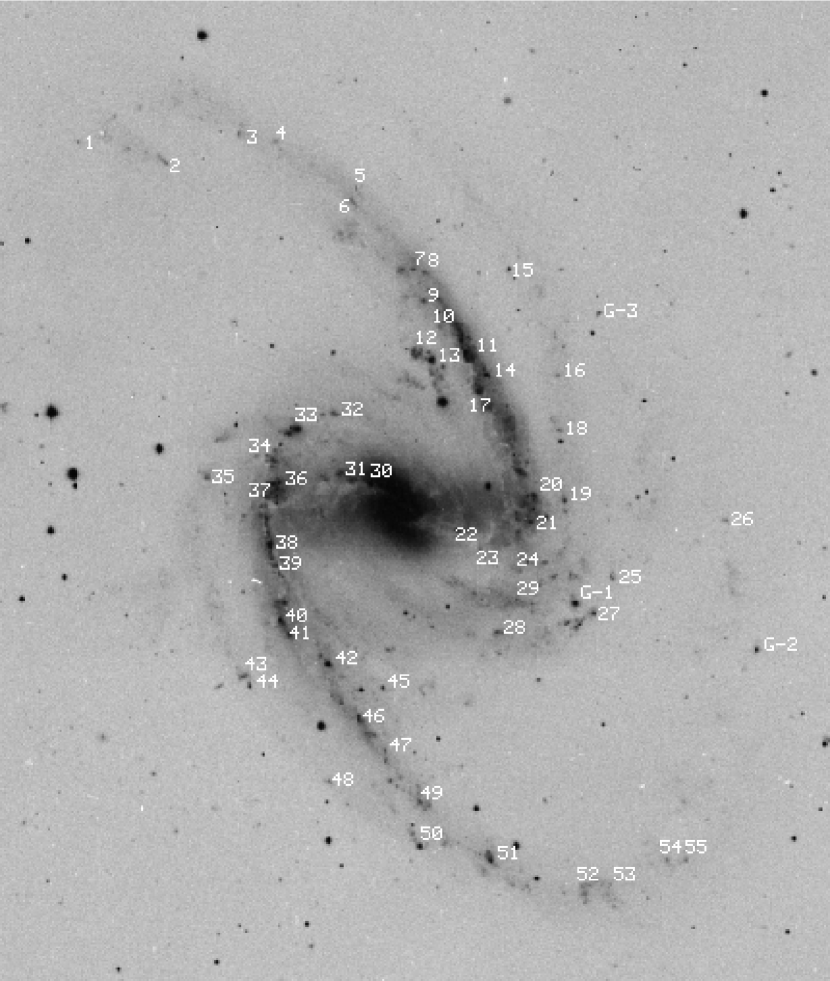
The final choice of H ii regions selected is indicated by the numbered regions on Figure 1. These were divided between two aperture plates which were observed on different nights. Both plate A (observed on 1994 December 09) and plate B (observed on 1994 December 10 and 11) had 49 fibres on H ii regions and 7 on sky positions. There were 30 regions in common between the two plates: 8 had no detectable emission; 7 were so faint that the better exposure on 1993 December 11 only was used for analysis; the remaining 15 spectra were combined: 5 had very faint emission and 5 were among the brightest H ii regions observed. For targets not in common, 9 objects were rejected which had insufficient signal-to-noise in the emission lines. Three objects (G-1, G-2 and G-3 on Figure 1) were found to be distant galaxies (See Appendix). Judging the strength of line emission from the appearance on a broad band image is clearly not sufficient since some regions have stronger continuum, particularly at smaller galactocentric radius. The final number of distinct H ii region spectra obtained with well measured lines was 55.
2.3 Fibre observations
Low dispersion spectra of the selected targets in NGC 1365 were obtained using the RGO spectrograph (25 cm camera) and the Tektronix #2 1024 1024 CCD (24 m pixels) on the 3.9 m Anglo-Australian Telescope during the nights of 1993 December 9-12. The FOCAP system with its bundle of about 55 fibres of 300 m core diameter (2.0′′ on sky) was employed to feed the spectrograph; the FOCAP system was used because it allowed closer positioning of fibres than AUTOFIB. A 250 lines per mm grating was used in the first-order blaze to collimator configuration for a dispersion of 156 Å mm-1. Most of the H ii regions observed in NGC 1365 have diameters in the range of 5′′ – 10′′, much bigger than the fibre apertures. To increase the area sampled by each fibre, the telescope was set in a continuous scan motion, by moving it on a circle of 1′′ radius at a rate of one full circle per 30 s. Convolved with seeing of 1′′ – 2′′, the effective sampling area was 3′′ – 4′′ in diameter. The Tektronix CCD is a thinned device and was used in the XTRASLOW mode (394 sec readout time) to achieve the lowest readout noise of 2.3 e- rms. The CCD blue response is good, being greater than 40% at 3727 Å.
Six 2000s exposures were taken with a first plate on 1993 December 09-10, one of which was affected by cloud. A second aperture plate was used for observations on the third night (1993 Dec 11-12) when conditions were good, seeing 1′′, and seven 2000s exposure were performed. The H ii regions indicated on Figure 1 are only those for which the emission lines were analysed, the spectra containing at least detectable H and H emission. Three of the objects rejected as having weak emission line spectra were found to have high redshifts. They are indicated by a letter G prefix in Figure 1 and are discussed in the Appendix.

2.4 Spectrophotometry with optical fibers
Spectroscopy using optical fibers for multiplexing is now a widely-used technique in astronomy. A great number of spectra are being obtained but, unfortunately, little attention has been given to the promising astrophysical potential of having usable spectral energy distributions for so many sources in addition to radial velocities. There is a general consensus that spectrophotometry cannot be done with fibres. However in the multi-fibre spectroscopy of 49 H ii regions in NGC 2997 (Walsh & Roy [1989]), it was shown that with suitable care, spectrophotometry to better than 20% can be achieved. Five problem areas for fibre spectrophotometry were outlined in Walsh & Roy [1989]. The use of a CCD with high quantum efficiency, as opposed to the IPCS for the NGC 2997 observations, together with the multi-night coverage of one galaxy, have changed some of the emphasis of the problem areas and led to improved understanding of the limitations. The problem areas can be restated thus: dealing with differential atmospheric refraction; effect on spectra of cross talk between fibres; efficacy of sky subtraction; reliability of spectral extraction.
-
[]
-
1.
Atmospheric refraction
The fibres were 300m in diameter (2.0′′) so that at zenith distances above 30∘ the differential atmospheric refraction between 3727 and 6730Å (the extent of the most useful optical wavelength range for H ii regions) is 1.0′′ (see Walsh & Roy [1990]). The maximum zenith distance at which exposures were made of NGC 1365 is 40∘ so that differential refraction will have a modulating effect on the spectrum. However the telescope was moved in a circular pattern of 1′′ radius to improve the sampling of the extended H ii regions, and this also has the effect of averaging out the effects of differential atmospheric refraction for modest airmasses.
Comparison of spectra of the same H ii region taken at zenith distances of 6 and 35∘ and corrected for airmass, show only small differences in line ratios between the blue and red ends. However for the observations of the spectrophotometric standard stars (L745-46A and L870-2 [1974]) the telescope was not circled during the exposure. Depending on the exact position of the star image over the fibre and the airmass, then the input spectra will differ, most obviously in the blue where the differential atmospheric refraction changes rapidly with wavelength. As for the case for NGC 2997, four H ii regions were in common between the fibre spectroscopy and the scanned long slit spectroscopy (Roy & Walsh [1987]). However for NGC 2997, the problems of relying on the spectrophotometric standard for the flux calibration proved insurmountable and a sensitivity curve was deduced by comparing the fibre spectra with the data from a long slit over identical regions. Whilst the same method could have been relied on for the NGC 1365 observations, it is clearly preferable to rely on an independent spectrophotometric calibration.
A number of precautions were taken in the observations of the standards. At least three, and sometimes five, separate observations, each of 300s duration, were made on the standards and at low to moderate airmass (zenith distance 27∘). At each exposure the standard star was recentered in the guide fibre and then offset to the appropriate fibre. During data reduction the individual spectra of the standards were compared in terms of absolute level and shape. The differences in absolute level could be attributed to the star not being centered in the fibre combined with the seeing, which was around 1′′-1.5′′. Differences in spectral distribution were also apparent, in particular a relative in(de)crease in the blue when comparing different exposures. This must be attributed to different centering of the star within the fibre: a higher blue response occurring when the fibre was more centered to lower altitude zenith distance. Some conspiracy between shifts in the parallactic direction and perpendicular to it could produce such effects, although no attempt was made to model this behaviour.
In forming the mean spectrum of the standard for a given night, a weighted mean of the strongest spectra was made; however if a spectrum differed markedly in shape from the others, it was not included in the mean. It was suggested in Walsh & Roy [1989] that improved spectrophotometry of standard stars could be achieved with very good seeing by scanning the telescope in an elongated pattern in the direction of the parallactic angle. This was not attempted during the observations described here. Such a strategy will of course impair absolute spectrophotometry (which can only be achieved with good seeing for fibres), but this is usually not a serious issue and certainly was not of major concern here. The agreement between spectra taken of the same H ii region on different nights both with the same fibre and with a different fibre suggest that the strategy of scanning a small circle is sufficient to ensure repeatable spectrophotometry to within 5% and could also be applied to the observation of the standard stars. Incidentally the level of agreement implies that the colour transmission of the fibres is similar, at least to tolerances lower than the spectrophotometric ones.
Inverse sensitivity curves were formed for L745-46A (first and third nights) and for L870-2 (second, third and fourth nights). The two curves for L745-46A were very significantly different in the blue, the curve derived for the third night showing a sharp minimum centred at 4000Å. For L870-2 the curves had the same general shape but with differences in absolute level; for the second and third nights the relative differences did not exceed about 6%. The sensitivity curves were used to calibrate the H ii region spectra and the extinction, derived from comparison of the hydrogen line ratios with the Case B values, was computed. It was found that the L870-2 sensitivity curves gave a more consistent value of the extinction (the Seaton [1979] Galactic curve was employed as parametrized by Howarth [1983]) for the different hydrogen line ratios (e.g. H/H vs. H/H). It was therefore decided to use a mean weighted spectrum of the L870-2 data from three nights to produce the calibration curve. On the highest signal-to-noise H ii spectrum (#42, night 3) the extinction is the same (within the errors of measurement) on all lines ratios from H/H to H/H. Thus the calibration produced by the adopted L870-2 spectrum is at least adequate over the range 3950 to 6600Å.
Comparison of the spectra with those of identical H ii regions observed by Roy & Walsh [1988] and Alloin et al. value [1981] was also made. There are 9 H ii regions in common with Alloin et al (L4, L6, L7, L10, L15, L21, L24, L28 and L33). There is poor agreement with the IDS spectra of Alloin et al, where low extinctions (=0) were derived; for the IPCS spectra, for L33 the derived extinction is much higher than Alloin et al. value, for L10 it is higher whilst for the others there is satisfactory agreement. The [O ii] /H ratios presented by Alloin et al. are systematically lower than presented here. The spectra were also compared with those of Roy & Walsh [1988] for H ii region emission summed over much larger areas than the fibre data. The fibre data indicated higher extinction and higher dereddened [O II]/H ratios than the summed H ii region emission. The higher extinction is most probably a real effect whereby the bright cores have higher extinction, whilst the higher [O ii] /H ratios may be affected by the difficulties of fibre spectrophotometric calibration at lower wavelengths.
-
2.
Cross-talk between fibres
On account of the much higher signal-to-noise of the CCD data in comparison with the previous IPCS data (Walsh & Roy [1989]), a better measurement of the cross-talk from fibre to fibre could be made. For an observation of the standard star, the counts in the two adjacent fibres along the slit yielded cross talk of 1.9 and 1.0%, with an increase to 2.5% in the red (7000Å) in the fibre with the higher level of cross-talk. For the other fibre, with lower cross talk, the spectrum had the same shape as that in the star fibre. A related effect was noticed in that some spectra after flux calibration were very blue. The effect appeared strongest on weaker spectra although was not confined to them, and was also not simply correlated to the strength of adjacent fibre spectra. It is suggested that the effect could arise from the flat fielding, since the flat-field lamp has a low response in the blue. This would make the flat field in the blue very sensitive to small changes in packing between fibres along the slit and small irregularities would cause differential cross-talk. However it is not clear why this cross-talk should be different between the flat field and the sky data. Sky flats might assist in better understanding of this problem. It is clear that the fibres should be well separated at the spectrograph entrance slit and on the detector in order to allow well-defined minima to be distinguished between the spectra.
-
3.
Sky subtraction
As suggested by Wyse & Gilmore [1992], at least six fibres were employed for determination of the sky - in fact 7 were used. After normalising the fibre to fibre response by the flat field spectra integrated in wavelength, the mean sky spectrum was formed and subtracted from the object spectra. The efficacy of sky subtraction was tested by examining the residuals on the mean sky-subtracted sky spectra. Examining the goodness of subtraction of the strong sky emission lines alone is not very reliable since small wavelength shifts (0.3 pixels) between the fibre spectra can result in improperly subtracted sky lines, although the mean difference across the line can be zero. Such small shifts can result from slight differences in the polynomial fit to the comparison lines along the slit. Comparison of the fibre-to-fibre response between the flat field and the [O i]5577Å line shows good agreement, suggesting that the method of correcting for the relative fibre transmissions is satisfactory.
-
4.
Spectral extraction
The packing of the fibres is such that the separation of the spectra peak-to-peak is 5 or 6 CCD pixels, and there is not a true zero intensity between fibres. The spectra were extracted simply by summing as many fibre spectra per object as possible; for the better separated spectra one signal-free pixel column was left between fibre spectra. A full extraction would require solving for all the extracted spectra simultaneously. Shifting the extent of the extracted spectrum by one pixel causes an error of up to 5%. Assigning a column from the edge of one spectrum into the adjacent spectrum gives rise to an error of about 2%. The simple linear extraction could be improved by fitting the cross-dispersion profile and by optimal extraction, but would not substantially affect the results presented here.
Comparing the spectra of the same H ii regions taken on different nights and with different fibres shows that these systematic effects dominate the photon statistical errors associated with the line fitting. For the bright lines, e.g. [O iii] and H, the typical differences in the line ratios (expressed as a fraction of H) are 10%; for [O ii] this difference is around 20%, with values up to 30%. For spectra taken on different nights, but in the same fibre, the differences are only slightly larger than the photon statistical errors, although conditions were not photometric on the first and second nights. It is clearly the problems of spectral extraction and spectrophotometric calibration that dominate the uncertainties in the derived line fluxes.
2.5 Reduction of the spectra
All the data frames were bias subtracted and the spectra and flat fields formed for each fibre. Wavelength calibration was achieved by fitting third order polynomials to the integrated spectra of each fibre for a Th-Ar lamp. Corrections of each individual exposure for airmass were made and the data summed. Following flux calibration by the merged L870-2 spectrum, the spectrum of each target was extracted and an interactive procedure for fitting continuum and emission lines was used to derive the line fluxes expressed in units of = 100. Photon noise errors on the fitted line fluxes were computed and propagated. The magnitude of the interstellar reddening was determined by the H/H ratios; comparison was done to the theoretical decrement as given by Brocklehurst [1971] for a temperature of 8,000 K and a density of 100 cm-3, but after adding 2 Å of equivalent width to the H emission line to compensate for the underlying Balmer absorption (cf. McCall, Rybski & Shields [1985]; Roy & Walsh [1987]). If the underlying stellar absorption at H is greater than 2 Å then this correction would lead to an overestimation of the reddening correction, especially in H ii regions of low H emission equivalent width. The spectrum was corrected in detail as a function of wavelength using the standard reddening law of Seaton [1979], as specified by Howarth [1983], assuming R = 3.1.
3 Results
Figure 2 shows some examples typical of the best spectra, uncorrected for interstellar reddening. The region numbers refer to the H ii region identification numbers in Figure 1 and Table 2. The difference in the relative strengths of the collisionally excited lines of [O iii] , [N ii] and [S ii] illustrate the change in excitation across the galaxy. Region #30 is close to the nucleus. Table 2 lists the line intensities (H= 100) corrected for reddening for the main emission lines of the 55 H ii regions observed. and refer to RA and DEC offsets in arcsec relative to the centre of the galaxy given in Table 1. The logarithmic extinction at H, , includes both Galactic reddening (contribution about 0.07, see Table 1) and extragalactic extinction. is the radial distance expressed in terms of the fractional isophotal radius (Table 1). We made only a marginal detection of the WC9 star in region #30 (L4 of [1981]) found by Phillips & Conti [1992]; this is in contrast to NGC 2997 where we observed 49 H ii regions and found signatures of Wolf-Rayet stars in three (and possibly four) regions.
3.1 Diagnostic diagrams
Several line ratios have been calculated after correction for reddening. Defining [O iii] as 1.34[O iii] 5007Å, [N ii] as 1.34[N ii] 6584Å and [S ii] as [S ii] 67136730Å, and using ([O ii] + [O iii])/H as a sequencing parameter, Figure 3 shows [O ii]/[O iii] , [N ii]/[O ii] , [S ii]/[O ii] and [O iii]/[N ii] versus this parameter. The tight relationships shown by these sequences imply that the majority of the nebulae are ionization-bound; these trends are characteristic of gas volumes photoionized by massive stars (McCall et al. [1985]), and very similar, for example, to those measured in M101 (Kennicutt & Garnett [1996]). The tight sequence shown by [N ii]/[O ii] indicates that the fibre spectrophotometry indeed produces reliable line fluxes. The change of [N ii]/[O ii] and [S ii]/[O ii] versus ([O ii] + [O iii])/H is driven by the thermal properties of the H ii regions, and not by change in the nitrogen and sulfur abundance ratios (Garnett & Shields [1987]). The abundance of oxygen mainly controls the thermal equilibrium in H ii regions (McCall et al. [1985]).
| RW | X | Y | [OII] | [OIII] | HeI | [NII] | [SII] | c(H) | |
|---|---|---|---|---|---|---|---|---|---|
| # | ′′ | ′′ | 3727 | 5007 | 5876 | 6584 | 6717-30 | ||
| (1) | (2) | (3) | (4) | (5) | (6) | (7) | (8) | (9) | (10) |
| 1 | 210 | 250 | 2228 | 1585 | 14.42.6 | 543 | 493 | 0.510.10 | 0.97 |
| 2 | 151 | 235 | 36817 | 704 | 12.93.0 | 814 | 804 | 0.660.13 | 0.84 |
| 3 | 101 | 254 | 3519 | 662 | 10.82.0 | 782 | 683 | 0.750.07 | 0.84 |
| 4 | 76 | 248 | 60651 | 639 | 10810 | 13712 | 0.800.25 | 0.81 | |
| 5 | 23 | 216 | 24910 | 1876 | 11.72.0 | 422 | 562 | 0.660.10 | 0.72 |
| 6 | 26 | 207 | 36426 | 1008 | 997 | 909 | 0.740.18 | 0.68 | |
| 7 | -14 | 160 | 3298 | 612 | 13.51.4 | 892 | 571 | 0.900.06 | 0.56 |
| 8 | -22 | 158 | 47628 | 454 | 986 | 716 | 0.970.16 | 0.56 | |
| 9 | -21 | 139 | 1747 | 372 | 10.61.8 | 943 | 773 | 0.950.09 | 0.50 |
| 10 | -31 | 131 | 26214 | 354 | 1035 | 795 | 0.890.12 | 0.48 | |
| 11 | -50 | 104 | 2282 | 241 | 9.90.6 | 1021 | 711 | 0.860.02 | 0.53 |
| 12 | -14 | 106 | 2225 | 1233 | 10.71.1 | 732 | 491 | 0.840.06 | 0.37 |
| 13 | -26 | 99 | 2554 | 641 | 10.40.7 | 911 | 601 | 0.840.03 | 0.37 |
| 14 | -63 | 88 | 2216 | 822 | 712 | 512 | 0.730.06 | 0.42 | |
| 15 | -79 | 160 | 30627 | 12913 | 528 | 8516 | 0.270.27 | 0.67 | |
| 16 | -111 | 87 | 26425 | 539 | 808 | 11412 | 0.580.25 | 0.55 | |
| 17 | -57 | 77 | 2255 | 301 | 9.91.0 | 962 | 771 | 0.840.05 | 0.37 |
| 18 | -112 | 50 | 61418 | 1154 | 12.62.3 | 843 | 1055 | 0.770.08 | 0.47 |
| 19 | -114 | 2 | 3665 | 1342 | 9.60.7 | 651 | 632 | 0.760.04 | 0.41 |
| 20 | -94 | 6 | 3263 | 591 | 10.30.4 | 901 | 531 | 0.780.02 | 0.34 |
| 21 | -91 | -11 | 2687 | 242 | 10.01.5 | 993 | 622 | 0.830.06 | 0.32 |
| 22 | -41 | -16 | 1059 | 203 | 9.51.9 | 1114 | 624 | 1.550.09 | 0.14 |
| 23 | -57 | -29 | 22212 | 213 | 8.02.1 | 1014 | 735 | 1.010.10 | 0.20 |
| 24 | -89 | -39 | 38110 | 562 | 9.11.1 | 962 | 592 | 1.050.06 | 0.31 |
| 25 | -146 | -50 | 2746 | 1173 | 13.01.5 | 642 | 622 | 0.530.06 | 0.50 |
| 26 | -223 | -12 | 23427 | 13616 | 7812 | 11524 | 0.070.31 | 0.78 | |
| 27 | -133 | -74 | 2919 | 1585 | 13.51.9 | 622 | 623 | 0.690.09 | 0.47 |
| 28 | -67 | -86 | 2915 | 672 | 13.61.2 | 812 | 562 | 0.810.04 | 0.33 |
| 29 | -81 | -64 | 1588 | 403 | 1064 | 934 | 0.780.10 | 0.32 | |
| 30 | 16 | 15 | 482 | 4.5 | 951 | 382 | 1.190.02 | 0.07 | |
| 31 | 29 | 18 | 16311 | 293 | 1014 | 614 | 1.180.11 | 0.11 | |
| 32 | 40 | 64 | 35413 | 343 | 1074 | 913 | 0.870.08 | 0.23 | |
| 33 | 65 | 53 | 1822 | 551 | 10.70.4 | 871 | 501 | 0.880.02 | 0.26 |
| 34 | 93 | 35 | 2696 | 1193 | 16.01.5 | 712 | 512 | 0.470.06 | 0.32 |
| 35 | 127 | 21 | 30512 | 924 | 804 | 863 | 0.610.11 | 0.44 | |
| 36 | 78 | 17 | 803 | 142 | 8.71.2 | 962 | 572 | 0.670.06 | 0.27 |
| 37 | 87 | 7 | 22212 | 343 | 1084 | 946 | 0.780.11 | 0.31 | |
| 38 | 85 | -23 | 1644 | 271 | 9.40.6 | 1052 | 762 | 1.110.04 | 0.33 |
| 39 | 81 | -39 | 32120 | 475 | 14.42.5 | 1025 | 754 | 1.370.15 | 0.34 |
| 40 | 78 | -75 | 2755 | 381 | 9.30.8 | 932 | 662 | 1.100.05 | 0.42 |
| 41 | 72 | -85 | 1266 | 442 | 13.61.8 | 883 | 594 | 0.920.09 | 0.43 |
| 42 | 47 | -105 | 3092 | 661 | 10.60.3 | 951 | 441 | 1.140.02 | 0.43 |
| 43 | 104 | -113 | 51610 | 1223 | 9.11.6 | 743 | 1043 | 0.530.06 | 0.60 |
| 44 | 100 | -120 | 2768 | 2406 | 13.32.3 | 523 | 594 | 0.400.08 | 0.61 |
| 45 | 10 | -122 | 2275 | 1032 | 11.11.7 | 762 | 592 | 0.610.05 | 0.42 |
| 46 | 26 | -144 | 3579 | 823 | 13.31.7 | 822 | 614 | 0.630.07 | 0.52 |
| 47 | 9 | -165 | 37420 | 916 | 895 | 1097 | 0.580.14 | 0.57 | |
| 48 | 46 | -185 | 32413 | 1075 | 9.92.8 | 734 | 805 | 0.630.11 | 0.69 |
| 49 | -13 | -200 | 54153 | 639 | 789 | 8112 | 0.800.29 | 0.67 | |
| 50 | -13 | -230 | 4284 | 2282 | 11.50.4 | 441 | 351 | 0.690.02 | 0.77 |
| 51 | -61 | -240 | 3805 | 872 | 8.60.7 | 782 | 662 | 0.550.03 | 0.78 |
| 52 | -123 | -259 | 36015 | 1216 | 10.72.7 | 904 | 1007 | 0.770.12 | 0.87 |
| 53 | -142 | -258 | 18012 | 766 | 866 | 767 | 0.340.16 | 0.89 | |
| 54 | -181 | -241 | 39515 | 1687 | 634 | 786 | 0.380.11 | 0.90 | |
| 55 | -193 | -242 | 53251 | 609 | 779 | 11013 | 0.740.28 | 0.92 |
3.2 Radial gradients in NGC 1365
Galactocentric distances and azimuthal positions of the H ii regions were calculated by assuming a 40∘ inclination of the galaxy disc to the plane of sky, and a position angle of 220∘ from Jörsäter & van Moorsel [1995]. As a normalizing radius, we used the value of the isophotal radius of 5.′61 (RC3); the possible choices of a normalizing radial parameter are discussed in detail by Vila-Costas & Edmunds [1992] and Zaritsky et al. [1994]. Line ratios which show systematic radial variations are the excitation [O iii]/H , the abundance indicators [N ii]/[O iii] and ([O ii] + [O iii])/H and reddening (Fig. 4). The radial positions of the H ii regions are given in Table 2 in terms of the fractional isophotal radius. Despite a large scatter, there appears indeed to be a systematic variation of (H), the logarithmic extinction at H, as a function of radius; such a radial trend has been observed so far only in the galaxy M101 (Kennicutt & Garnett [1996]). The linear coefficient of correlation between (H) and is R = –0.46. The value of (H) is high on average across the disc, dropping from 1.2 near the centre to 0.6–0.8 in the outer disc; the dust lanes of NGC 1365 are remarkably strong and indicate the rich dust content. Despite the relatively high extinction (the mean of = 0.750.27), one can see through the galaxy; in particular, a distant elliptical (object G-1 on Figure 1) was found just southwest of the bar.

As seen from the spectra of Figure 2, the level of excitation in NGC 1365 is generally low, and no direct measurement of the electron temperatures is possible. Therefore semi-empirical methods must be relied on to derive abundances. These methods have been widely discussed and used (e.g. Edmunds & Pagel [1984]; McCall et al. [1985]; Evans [1986]; Garnett & Shields [1987]; Vilchez et al. [1988]; Walsh & Roy [1989]; Belley & Roy [1992]; Martin & Roy [1994]; Zaritsky et al. [1994]). They are based on the result that larger values of ([O ii] + [O iii])/H or [O iii]/[N ii] are correlated with higher electron temperatures and lower abundances of oxygen. These calibrations have been refined by Edmunds and Pagel [1984], McCall et al. [1985], and Dopita & Evans [1986]; Zaritsky et al. [1994] have produced a synthetic calibration for ([O ii] + [O iii])/H by merging the three previous ones. It must be recalled that factors other than heavy element abundances also modify nebular line strengths. The limitations and uncertainties of the semiempirical methods due to various effects have been also discussed by McGaugh [1991] for ionization parameter and effective temperature of the ionizing radiation, by Henry [1993] and Shields & Kennicutt [1995] for dust, by Oey & Kennicutt [1993] for density, by Kinkel and Rosa [1994] for high Z effects and by Roy et al. [1996a] for moderately low Z behavior.
Radial gradients in ([O ii] + [O iii])/H and [O iii]/[N ii] reflect primarily abundances gradients wherever those line ratios are sampled over a significant fraction of the H ii region volume. The absolute O/H abundance predicted by the different semi-empirical calibrations of these ratio can vary depending on the calibration employed, but the relative trends can be probed reliably (see for example Henry & Howard [1995]; Zaritsky et al. [1994]; Martin & Roy [1994]; Kennicutt & Garnett [1996]). The radial abundance variation in oxygen abundances in NGC 1365 was determined from three calibrations: i) ([O ii] + [O iii])/H as calibrated by Edmunds & Pagel [1984]; ii) [O iii]/[N ii] also calibrated by Edmunds & Pagel [1984]; and ([O ii] + [O iii])/H as calibrated by Zaritsky et al [1994]. The reader can then compare the results with similar abundance data on the few other galaxies which have been thoroughly sampled with spectroscopic techniques, e.g. NGC 2997 (Walsh & Roy [1989]) and M101 (Kennicutt & Garnett [1996]). The overall trend in NGC 1365 is a rather shallow abundance gradient at about –0.50 dex -1, or –0.02 dex/kpc; the exact parameters of the correlation depends on the calibration used as shown in Table 3, where is the coefficient of correlation. The three calibrations, [O iii]/[N ii] by Edmunds & Pagel [1984], ([O ii] + [O iii])/H by Zaritsky et al. [1994] and ([O ii] + [O iii])/H by Edmunds & Pagel [1984], give rather similar results within the errors. The calibration of ([O ii] + [O iii])/H by Edmunds & Pagel [1984] tend to give a larger amplitude for the variation of O/H across the disc. A shallow gradient is expected for strongly barred galaxies, and NGC 1365 with a deprojected bar axis ratio = 0.51, has a strong bar ([1995]). The central intercept is at about 12 + log O/H = 9.15 (depending on the calibration used).
In addition, one observes a rather obvious break at R 185 - 200′′ (); inside this radius the O/H gradient is moderately steep (–0.80 dex -1, i.e. –0.05 dex kpc-1), while outside it is flat. We have chosen as the galactic radial distance where the break occurs and have calculated the appropriate equations and coefficient of correlation (Table 3); this position for the break ensures a reasonable number of sample points (34 in the inner part and 21 in the outer part) while corresponding to small residuals for the fits. The correlations for the inner zone are almost as strong as for all the points. Comparisons between the three abundance calibrations can be made; it is obvious from Table 3, that there is no abundance gradient (within the uncertainties) beyond the break. We note that the values of O/H derived by using the [O iii]/[N ii] calibration by Edmunds & Pagel [1984] are very similar to those given by the synthetic calibration of Zaritsky et al. [1994]; this applies to individual points and to the correlations (Table 3). The break is also well seen in the radial plot of [O iii]/H (not shown); thus effects related to dust or a erroneous reddening determination can therefore be excluded.
Possible azimuthal asymmetries in the O/H distribution were searched for, but no evidence was found for such asymmetry. The significant assymetry in O/H distribution found by Kennicutt & Garnett [1996] in M101 remains a rather unusual and significant feature. The apparent dispersion in abundance (0.2 dex) at fixed radius is probably mainly due to variations in nebular ionization as discussed by Kennicutt & Garnett [1996].
| Radius | Equation | Calibration | |
|---|---|---|---|
| R 1.0 | 12 log O/H = 9.100.04 - 0.420.07 | -0.62 | [O iii]/[N ii] (EP84) |
| R 1.0 | 12 log O/H = 9.170.05 - 0.530.09 | -0.63 | ([O ii] + [O iii])/H (ZA94) |
| R 1.0 | 12 log O/H = 9.120.06 - 0.680.11 | -0.65 | ([O ii] + [O iii])/H (EP84) |
| R 0.55 | 12 log O/H = 9.230.06 - 0.780.17 | -0.63 | [O iii]/[N ii] (EP84) |
| R 0.55 | 12 log O/H = 9.260.08 - 0.770.21 | -0.54 | ([O ii] + [O iii])/H (ZA84) |
| R 0.55 | 12 log O/H = 9.280.10 - 1.100.28 | -0.57 | ([O ii] + [O iii])/H (EP84) |
| R 0.55 | 12 log O/H = 8.850.15 - 0.070.20 | -0.09 | [O iii]/[N ii] (EP84) |
| R 0.55 | 12 log O/H = 8.660.17 + 0.130.23 | 0.13 | ([O ii] + [O iii])/H (ZA84) |
| R 0.55 | 12 log O/H = 8.500.18 + 0.160.24 | 0.15 | ([O ii] + [O iii])/H (EP84) |

4 Discussion


The presence of a break in the radial abundance distribution is one outstanding signature that a bar may have recently ( 1 Gyr) formed in a spiral galaxy. Following Friedli et al. [1994] and Friedli & Benz [1995] who have developed this scenario, two breaks may actually appear in the radial abundance distribution: (i) a “steep-shallow” break, near corotation, due to vigorous enrichment by star formation in the bar, followed by a much flatter portion dominated by the dilution effect of the outward flow, and (ii) an outer “shallow-steep” break defining where the outflow has had time to penetrate the outer disc. This “shallow-steep” outer break moves to larger radius as time evolves, and as the extent of the radial homogenization reaches further out in the disc (Friedli et al. [1994]; Friedli & Benz [1995]). As the bar ages, it dissolves and runs out of gas. Star formation then weakens, and dilution effects in the interstellar gas come to dominate; after a few Gyr, the resultant global abundance gradient ends up shallow, the break becomes indistinguishable and the gradient displays a monotonic decrease. The slope of any pre-existing radial gaseous or stellar abundance gradient decreases from the start of the first phase. To have a break, one needs vigorous star formation in the bar, and grand design spiral arms for strong outward flows. NGC 1365 is a barred galaxy with moderate star formation along the bar but an intense nuclear starburst (Seyfert nucleus and ring of H ii regions); this is evidence for an age of 1 Gyr (see discussion in Martin & Roy [1995]).
A “steep-shallow” inner break is found in the abundance distribution of NGC 1365 and it is located quite a bit further out than the corotation radius (Figure 5). It is assumed that due to an interaction or a merger, the disc of NGC 1365 became unstable and developed a bar in a recent epoch. On account of angular momentum transfer via the arms, the bar induced large-scale radial flows of interstellar gas. First, a quick phase of intense star formation occured along the bar major axis as well as along spiral arms; galaxies showing this property (e.g. NGC 3359) have rather young bars. At a later time (closer to our epoch), a starburst was triggered when gas had collapsed to the centre in a nuclear ring as observed by Sandqvist et al. [1995]. Star formation now continues mainly along the spiral arms. With the fuel progressively consumed, star formation is essentially limited to the ring and the spiral arms. Thus in this framework of a recently formed bar, NGC 1365 would be a disc spiral with a strong, gas rich, but moderately young bar (age 1 Gyr). As indicated by the absence of a rich population of H ii regions in the bar, the star formation rate is now weak, except in the center and at the bar ends.
From the neutral hydrogen kinematics, corotation (at or at ) is at 1.21 times the bar semi-major axis (see Linblad, Linblad & Athanassoula [1996b]. There is a clear break in the O/H abundance radial distribution at or (Figure 5). Although there is some uncertainties () in the locations of corotation and of resonances (dependence on the model) and of the break, the latter is beyond corotation; the break in the O/H gradient is close to the -4/1 resonance at . The position of the abundance gradient break beyond corotation is puzzling, since this is a region of strong radial mixing. However mixing always competes with enrichment due to star formation in changing the local abundance. The intense star forming activity in NGC 1365 observed at the bar ends and just beyond (betrayed by clumps of several bright H ii regions) may compensate dilution and maintain high abundances, pushing the location of the break further where star formation is reduced.
The apparent dispersion of the O/H points, at a fixed radius, does not vary with galactocentric distance. This is to be contrasted with the behavior of another barred galaxy, NGC 3359, which has also a break in its radial abundance distribution (see Fig. 6). NGC 3359 has vigorous star formation in its bar and a steep inner abundance gradient; there the break is observed at corotation. The abundance fluctuations, at a fixed radius, are much larger in the outer parts of the disc – where the gradient is flat – than in the inner regions where the gradient is steep. Martin & Roy [1995] have interpreted this behavior of the O/H abundances in NGC 3559 as due to a recently formed bar 400 Myr old, an age less than the mean azimuthal mixing time in galaxy discs [1995]. We suggest that the homogenizing action of the bar in NGC 1365 may have acted on a timescale longer than the characteristic azimuthal mixing time, that is the bar is older than 500 Myr. The high mass of gas accumulated in the centre, as implied by the presence of a nuclear starburst and a Seyfert nucleus, also indicates an age 1 Gyr for the bar of NGC 1365. Overall, several features are consistent with a bar formed about 1 Gyr ago.
In Figure 6, the abundance gradients of four galaxies which have had extensive spectrophotometry across their discs are shown: two normal spiral galaxies, NGC 2997 (Walsh & Roy [1989]) and M 101 (Kennicutt & Garnett [1996]); two barred galaxies, NGC 3359 (Martin & Roy [1995]) and NGC 1365 (this work). The shallower gradients and the presence of breaks in the radial abundance distribution is easily seen in the two barred galaxies. The difference between barred and normal spirals in radial abundance distributions is striking. If the recently formed bar hypothesis is correct, the numerical simulation of Friedli et al. [1994] of a disc with a recently formed bar and star formation show that the pre-bar O/H radial distribution in NGC 1365 would have been very similar to that observed nowadays in M 101.
Finally, the models of Friedli and collaborators predict two breaks in the radial abundance distribution of galaxies with young bars. So far no observational evidence for the “shallow-steep” break in the outer disc has been found. In order to ascertain the scenario of secular evolution of disc galaxies (Martinet [1995]), by the recurrent action of bars, it will be necessary to find this outer break. This more definite test of the “young bar” hypothesis appears to be difficult however. As gas density falls with radial distance and the star formation rate weakens, there are fewer and smaller H ii regions, not unlike the interarm H ii regions. Long integration times will be required in order to determine O/H abundances and there may be only a few galaxies having a sufficient number of outer H ii regions to provide statistically significant samples.
Acknowledgments
We acknowledge the technical support of J. Pogson, the AAT telescope
operator. Discussions with Daniel Friedli, Pierre Martin, and
Laurent Drissen were most helpful.
We thank the PATT Committee for assigning time on the AAT for this
project. This investigation was funded in part by the Natural
Sciences and Engineering Research Council of Canada, the Fonds FCAR
of the Government of Quebec and by
the Visitor Program of the European Southern Observatory through financial
support of JRR.
Appendix A: Serendipitously discovered galaxies
As mentioned in section 2.2 three of the targets chosen as H ii regions were identified from their spectra as galaxies. They are indicated as G-1 to G-3 on Figure 1. Brief details of the targets and their spectra are included here.
G-1: This bright galaxy is quite round (ellipticity on the B image 0) so is probably of type around E0-E1. Its major axis has a half width of about 4′′, corrected for seeing. The spectrum shows a strong red continuum with absorption lines of Ca II H and K, H and G-band and Mg I. From the wavelengths of the Ca II H and K lines the red-shift is 0.103. There is a detection of Ca II H and K absorption at the redshift of NGC 1365, making the galaxy a very useful probe for studying the line of sight velocity dispersion in an interesting region near the bar.
G-2: This galaxy has a resolved almost circular core of half width 2′′ and shows two spiral arms of total extent 15′′. The spectrum shows a redward rising continuum with Ca II H and K and Mg I absorption lines. From the observed wavelength of the Ca II H and K lines, the redshift is 0.294.
G-3: This galaxy displays a strong disc with a possible knot at its SE edge, possibly indicating an interacting system. The spectrum shows a rather flat continuum with strong emission lines of [O ii] , H, and [O iii] . The redshift is 0.131. The [O iii] 5007/H ratio is 2.4 and [O ii] /H ratio is 4.5.
References
- [1981] Alloin D., Edmunds M. G., Lindblad P. O., Pagel B. E. J., 1981, A&A, 101, 377
- [1993] Anantharamaiah K. R., Zhao J.-H., Goss W. M., Viallefond F., 1993 ApJ, 419, 585
- [1992] Athanassoula E., 1992, MNRAS, 259, 345
- [1992] Belley J., Roy J.-R., 1992, ApJS, 87, 61
- [1971] Brocklehurst, M., 1971, MNRAS, 153, 471
- [1993] Combes F., Elmegreen B. G., 1993, A&A, 271, 391
- [1991] de Vaucouleurs G., de Vaucouleurs A., Corwin H. G., Buta, R., Paturel G., Fouqué R., 1991, Third Reference Catalogue of Bright Galaxies.Springer, New York (RC3)
- [1986] Dopita M. A., & Evans I. N., 1986, ApJ, 307, 431
- [1984] Edmunds M. G., Pagel B. E. J., 1984, MNRAS, 211, 507
- [1986] Evans I. N., 1986, ApJ, 309, 544
- [1994] Friedli D., Benz W., Kennicutt R. C., 1994, ApJ, 430, L105
- [1995] Friedli D., Benz W., 1995, A&A, 301, 649
- [1987] Garnett D., Shields G. A., 1987, ApJ, 317, 82
- [1993] Henry R. B. C., 1993, MNRAS, 261, 306
- [1995] Henry R. B. C., Howard J. W., 1995, ApJ, 438, 170
- [1983] Howarth I. D., 1983, MNRAS, 203, 301
- [1995] Jörsäter J., van Moorsel G. A., 1995, AJ, 110, 2037
- [1996] Kennicutt R. C., Garnett D. R., 1996, ApJ, 456, 504
- [1994] Kinkel U., Rosa M. R., 1994, A&A, 282, 37
- [1987] Lindblad P. O., & Jörsäter S., 1987, in Evolution of Galaxies, ed. J. Palous. Tenth European Regional Astronomical Meeting of the IAU, p. 289
- [1996a] Lindblad P. A. B., Lindblad P. O., Athanassoula E., 1996, in Barred Galaxies, IAU Coll. no. 157, ed. R. Buta, B. Elmegreen, D. Crocker. ASP Conference Series, p. 413
- [1996b] Lindblad P. A. B., Lindblad P. O., Athanassoula E., 1996, A&A, 313, 65
- [1996] Madore B., et al., 1996, BAAS, 189, 108.04
- [1995] Martin P., 1995, AJ, 109, 2428
- [1994] Martin P., Roy J.-R., 1994, ApJ, 424, 599
- [1995] Martin P., Roy J.-R., 1995, ApJ, 445, 161
- [1995] Martinet L., 1995, Fund. Cosm. Phys., 15, 141
- [1985] McCall M. L., Rybski P. M., Shields G. A., 1985, ApJS, 57, 1
- [1991] McGaugh S. S., 1991, ApJ, 380, 140
- [1988] Noguchi M., 1988, A&A, 203, 259
- [1996a] Noguchi M., 1996, in Barred Galaxies, IAU Coll. no. 157, ed. R. Buta, B. Elmegreen, D. Crocker. ASP Conference Series, p. 339
- [1996b] Noguchi M., 1996, ApJ, October in press
- [1996] Norman, C. A., Sellwood J. A., 1996, ApJ, 462, 114
- [1993] Oey M. S., Kennicutt R. C., 1993, ApJ, 411, 137
- [1974] Oke J. B., 1974, ApJS, 27, 21
- [1989] Ondrechen M. P., van der Hulst, J. M., 1989, ApJ, 342, 29
- [1979] Pagel B. E. J., Edmunds M. G., Blackwell D. E., Chun M. S., Smith G., 1979, MNRAS, 189, 95
- [1992] Pfenniger D., 1992, in Physics of Nearby Galaxies, Nature or Nurture?, ed. T. X. Thuan, C. Balkowski, J. Tran Tranh Van. Ed. Frontières, Gif-sur-Yvette, p. 519
- [1992] Phillips A. C., Conti P. S., 1992, ApJ, 395, L91
- [1979] Roberts W. W., Huntley J. M., van Albada G. D., 1979, ApJ, 233, 67
- [1987] Roy J.-R., Walsh J. R., 1987, MNRAS, 228, 883
- [1988] Roy J.-R., Walsh J. R., 1988, MNRAS, 234, 977
- [1995] Roy J.-R., Kunth D., 1995, A&A, 294, 432
- [1996a] Roy J.-R., Belley J., Dutil Y., Martin P., 1996, ApJ, 460, 284
- [1996b] Roy J.-R., in Barred Galaxies, IAU Coll. no. 157, ed. R. Buta, B. Elmegreen, D. Crocker. ASP Conference Series, p. 63
- [1995] Sandqvist Aa., Jörsäter S., Lindblad P. O., 1995, A&A, 295, 598
- [1992] Scowen P. A., Dufour R. J., Hester J. J., 1992, AJ, 104, 92
- [1979] Seaton M. J., 1979, MNRAS, 187, 73P
- [1993] Sellwood J. A., Wilkinson A., 1993, Rep. Prog. Phys., 56, 173
- [1965] Sersic J. L., Pastoriza M., 1965, PASP, 77, 287
- [1995] Shields J. C., Kennicutt R. C., 1995, ApJ, 454, 807
- [1993] Shlosman I., Noguchi M., 1993, ApJ, 414, 474
- [1982] Tubbs A. D., 1982, ApJ, 255, 458
- [1992] Vila-Costas M. B., Edmunds M. G., 1992, MNRAS, 259, 121
- [1988] Vilchez J. M., Pagel B. E. J., Díaz A. I., Terlevich E., Edmunds M. G., 1988, MNRAS, 235, 633
- [1989] Walsh J., Roy J.-R., 1989, ApJ, 341, 722
- [1990] Walsh J. R., Roy J.-R., 1990, in 2nd ESO/ST-ECF Data Analysis Workshop. ed. D. Baade and P. J. Grosbol. ESO, Garching, p. 95
- [1996] Walsh J. R., Roy J.-R., 1996, MNRAS, submitted
- [1992] Wyse R. F. G., Gilmore G., 1992, MNRAS, 257, 1
- [1994] Zaritsky D., Kennicutt R. C., Huchra J. P., 1994, ApJ, 420, 87