The O/H Distribution in the Transition Magellanic Galaxy NGC 1313
Abstract
Multi-fibre emission-line spectrophotometry of 33 H ii regions and 3 diffuse interstellar medium positions are presented for the barred Magellanic galaxy NGC 1313. The H ii regions show a fairly narrow range of thermal conditions characteristic of high excitation nebular gas. Electron temperature was directly determined in four of the H ii regions. The global O/H abundance distribution appears very flat across the disk at 12 + log O/H 8.4 0.1, with possibly the bar regions having abundances higher by 0.2 dex than the outer disc. NGC 1313 is the highest mass barred galaxy known not to have any radial abundance gradient. The key role of the bar on the abundance distribution in disc galaxies is revisited.
keywords:
galaxies: individual (N1313) – galaxies ISM – galaxies: Magellanic – H ii regions1 Introduction
NGC 1313 has been described by de Vaucouleurs [1963] as a galaxy in transition between SBm and SBc type. It is sufficiently close to the Magellanics to recall some of their properties, and at the same time it can be compared to M33 or NGC 300. Low-mass irregulars like the Magellanic Clouds [1978], NGC 2366 and NGC 4395 [1996] and NGC 4214 [1996] have very flat abundance distributions, with mean metallicity levels which appear to scale with the overall mass of the galaxies. Edmunds & Roy [1993] have noted that abundance gradients seem to disappear at the same absolute magnitude ( -17 in late-type spirals) where spiral structure no longer exists. In contrast, late-type spirals of Sc type, like NGC 300, NGC 7793 and M 33, which are slightly more massive than the above low mass irregulars, show well developed global O/H abundance gradients of the order of –0.080.02 dex/kpc.
It is also well established that, compared to normal disc galaxies, barred galaxies have flatter radial abundance distributions whatever their mass (Vila-Costas & Edmunds [1992]; Zaritsky et al. [1994]; Martin & Roy [1994]; Roy [1996]). Also well-known are the barred structures of many Magellanic irregulars. A bar can be reponsible for angular momentum transfer by inward and outward radial flows across the disc; the bar becomes then an effective way for radial homogenization of the abundance distribution [1994]. Thus the presence of strong bar features in SBm type galaxies may not be foreign to the uniform abundance distribution, as originally suggested by Pagel et al. [1978] [1980]. Nevertheless the difference in behaviour of the chemical composition between galaxies of the same morphological type, but of different bar strength, is intriguing.
It would also be helpful to establish at what morphological type, what luminosity and what mass abundance gradients become established in galaxy disks. Somewhere between units of M33 size and mass, and units of Large Magellanic Cloud (LMC) size, the discs evolve in ways which enable the buildup of an abundance gradient. Because of its bar and its intermediary properties, NGC 1313 is an attractive object to study the “take-off” of abundance gradients in galaxy discs.
In order to improve the understanding of the origin and evolution of abundance gradients, we have obtained fibre spectrophotometry of 33 H ii regions in the late-type galaxy NGC 1313. Section 2 provides some details of the galaxy and on how the H ii regions were selected; section 3 presents the results and in section 4 the features of the O/H gradient and comparison with other galaxies of similar luminosity are discussed.
2 Observations and data reduction
2.1 The galaxy NGC 1313
NGC 1313 is an isolated very late-type barred spiral which has long been thought to have a complicated history. Its morphology is reminiscent of several of the irregular or amorphous objects seen in the Hubble Deep Field. Its ill-formed arms have led to speculation about the galaxy being the result of a tidal interaction (Peters et al. [1994]). However, from their recently completed thorough optical and H i study, Ryder et al. [1995] concluded that NGC 1313 is dynamically and morphologically more regular and well developed than the class of Magellanic barred spirals. Bright H ii regions outline the bar and the arms, with the most luminous being in the arms, particularly the northwestern one [1983]. There is no colour gradient across the galaxy [1995]. A Type II supernova was observed in NGC 1313 in 1968 [1968]; another Type II supernova (SN1978K) was found retrospectively by Ryder et al. [1993]. Table 1 gives some of the general properties of the galaxy.
| Parameter | Value |
|---|---|
| (J2000) | 3h18m15.s5 |
| (J2000) | -66∘29′51′′ |
| Morphological type | SB(s)d |
| Inclination | 48∘ |
| Position angle | 0∘ |
| Galactic extinction ( | 0.04 |
| Systemic velocity (km s | 480 |
| 4.′56 | |
| 0.63 | |
| D (Mpc) | 4.5 |
| Scale (pc arcsec-1) | 22 |
Pagel et al. [1980] presented the results of the spectrophotometry of six H ii regions in NGC 1313 (and seven in NGC 6822) and concluded that the abundance distribution was quite uniform at 12 + log O/H = 8.26 0.07. From spectrophotometric measurements of 14 H ii regions, Ryder [1993] derived a steep abundance gradient of –0.09 dex kpc-1, but this result depends on two points at large effective radius which strongly affected the derived slope.
2.2 Selection of H II regions
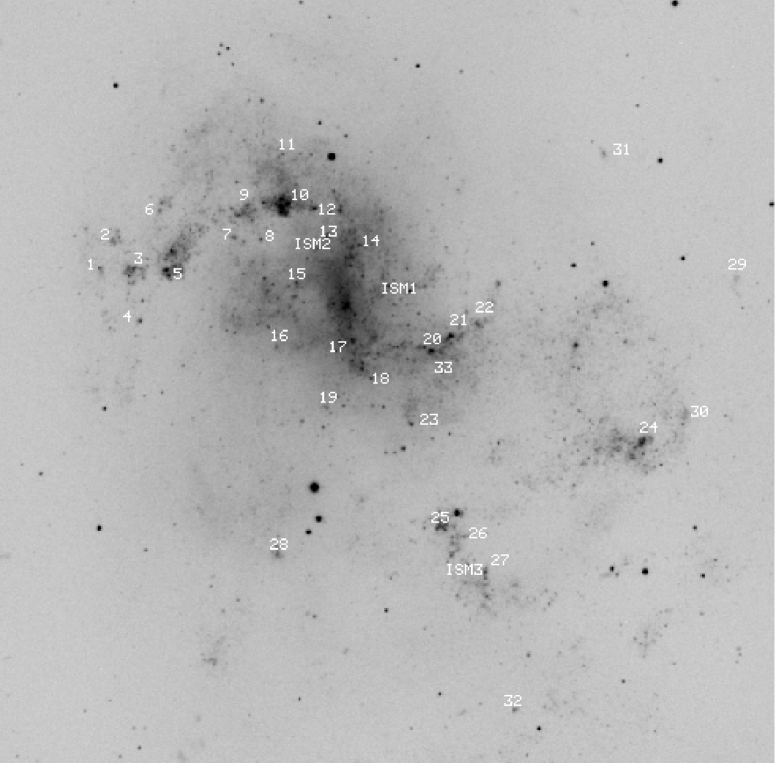
Marcelin & Gondoin [1983] catalogued 375 H ii regions in NGC 1313 from analysis of an H plate. Michel Marcelin kindly loaned a B plate of 40 min exposure (taken with the ESO 3.6-m at Cassegrain focus on IIaO with a GG385 filter centred at 6575Å on 1978 January 31) which was scanned on the ESO PDS machine. The scanning aperture was 50m square and the sampling 25m (0.474′′). The image is shown in Figure 1. Using the catalogue of Marcelin & Gondoin [1983], 104 H ii regions were identified which were suitable for fibre spectroscopy in that they were not too faint, distinct and with a representative distribution over the bar and arms. The centroid positions of these H ii regions were determined and also of 12 HST GSC stars by 2-D Gaussian fitting. The RA and Dec of the H ii regions were then determined by a six coefficient astrometric solution. The projected size of NGC 1313 is such that all the (50) fibres in a single FOCAP bundle could not be filled by H ii regions since they are too close (the closest distance between fibres is 19′′); for this reason we could not observe as many regions in the bar as we would have liked. A total of 37 H ii regions were observed with fibres. A number of positions were also identified to sample the diffuse interstellar medium of the galaxy and examine their emission line spectrum; they are denoted by ISM1 - ISM3 on Figure 1. For the purposes of sky subtraction, ten positions away from the galaxy and from stars were identified for sky fibres. Of the 37 H ii regions observed, 33 had strong enough emission (i.e. at least H and H) for detailed analysis. Three of the ISM regions had spectra strong enough for individual analysis (7 were observed). The observed H ii regions and ISM positions are identified on Figure 1 by a running number and an ISM tag respectively.
2.3 Observations
Low dispersion spectra of the selected H ii regions in NGC 1313 were obtained on the night of 1993 December 12-13 with the Anglo-Australian Telescope, using the fiber optics fed FOCAP system, the RGO spectrograph, and the Tek #2 CCD. The same instrumental set-up with 300m (2.0′′) fibres was employed as for the observations of NGC 1365 reported in Roy & Walsh [1996]. The total exposure time was 6200s, divided mostly into 1000s exposures. Seeing was about 1′′ but there was some cloud encountered during the observations. 37 H ii regions, 10 sky positions and 7 ISM positions off identified H ii regions were observed. Full details of the observation procedures and a detailed discussion of the observation and reduction steps followed with the AAT FOCAP fiber optics system can be found in Roy & Walsh [1996].
2.4 Reduction of the spectra
The data were reduced identically to the NGC 1365 H ii region fibre data [1996]. The average spectrum over three nights of the spectrophotometric standard L870-2 [1974] was employed for flux calibration. Gaussians were fitted to the emission lines and polynomials to the underlying continuum using an interactive procedure and line fluxes and photon noise errors on the line fluxes were expressed relative to = 100. The magnitude of interstellar reddening was determined from the H/H ratios; comparison was done to the theoretical decrement as given by Brocklehurst (1971) for a temperature of 10,000 K and a density of 100 cm-3, after adding 2 Å of equivalent width to the H emission line to compensate for the underlying Balmer absorption (cf. McCall, Rybski & Shields 1985; Roy & Walsh 1987). The observed spectra were corrected for extinction as a function of wavelength using the standard reddening law of Seaton [1979], as specified by Howarth [1983] and using R=3.1.
3 Results

Figure 2 shows three examples of some of the best spectra; all those retained were characterized by high signal-to-noise, except for those three corresponding to positions on the diffuse ionized interstellar medium. Signatures of Wolf-Rayet stars were found in regions #3 and #28, both at large galactocentric radii. The spectra are in general representative of high excitation H ii regions, and that level is rather uniform across the disk. The strength of the [O iii] 4363Å line was strong enough to determine the electron temperature in 4 H ii regions; they are regions #23 (Te = 12,250400 K), #5 (Te = 11,500500 K), #21 (Te = 11,000700 K) and #12 (Te = 9,900600 K). Extinction is moderately high and uniform across the disc at (H) 0.7. Positions of the H ii regions (in terms of RA and Dec offset from the galaxy centre specified in Table 1) and reddening-corrected line fluxes relative to F(H)=100 are given in Table 2. The final column lists the deprojected fractional radius in terms of the isophotal radius, , listed in Table 1.
Three of the observed H ii regions were also studied by Pagel et al [1980]: #10 (Pagel et al No. 1); #20 (No. 5) and #24 (No. 8). For #20, the extinction is the same within the errors between both the long slit data of Pagel et al [1980] and the fibre spectroscopy, although the excitation of the fibre spectra is lower (stronger [O ii] and weaker [O iii] ). For the two other regions the extinction differs considerably (by about 0.3 in c) whilst the excitations are similar. Detailed comparison of both sets of spectra is not warranted since the sampling region is different and it is known from previous work (e.g. [1987], [1989]) that extinction and ionization conditions are not constant across the surface of resolved extragalactic H ii regions.
| No | X | Y | [OII] | [OIII] | HeI | [NII] | [SII] | [Ar III] | c | |
|---|---|---|---|---|---|---|---|---|---|---|
| ′′ | ′′ | 3727 | 5007 | 5876 | 6584 | 6717-30 | 7136 | |||
| (1) | (2) | (3) | (4) | (5) | (6) | (7) | (8) | (9) | (10) | (11) |
| 1 | 183 | 21 | 995118 | 18124 | 3811 | 11517 | 0.460.38 | 1.00 | ||
| 2 | 174 | 43 | 48549 | 17918 | 376 | 718 | 0.760.28 | 0.96 | ||
| 3 | 158 | 21 | 3587 | 3235 | 10.60.8 | 171 | 382 | 101 | 0.850.05 | 0.87 |
| 4 | 153 | -16 | 57311 | 2324 | 10.60.9 | 191 | 342 | 91 | 0.930.05 | 0.84 |
| 5 | 132 | 17 | 3403 | 4253 | 10.40.3 | 181 | 371 | 91 | 0.960.02 | 0.73 |
| 6 | 140 | 64 | 20213 | 44120 | 143 | 123 | 496 | 0.700.15 | 0.80 | |
| 7 | 85 | 45 | 2766 | 3265 | 9.70.8 | 141 | 301 | 81 | 0.830.05 | 0.50 |
| 8 | 65 | 45 | 2817 | 3216 | 8.01.2 | 141 | 261 | 91 | 0.670.06 | 0.39 |
| 9 | 76 | 70 | 4367 | 1893 | 7.50.7 | 251 | 602 | 71 | 0.980.04 | 0.49 |
| 10 | 46 | 71 | 30121 | 25417 | 343 | 516 | 0.610.20 | 0.37 | ||
| 11 | 51 | 107 | 3656 | 2804 | 11.01.0 | 231 | 441 | 111 | 0.720.05 | 0.48 |
| 12 | 27 | 68 | 2302 | 3733 | 10.50.3 | 131 | 261 | 91 | 0.720.02 | 0.29 |
| 13 | 17 | 49 | 3607 | 1923 | 11.50.9 | 301 | 471 | 71 | 0.850.05 | 0.20 |
| 14 | -6 | 42 | 59251 | 16115 | 45 5 | 9010 | 0.920.26 | 0.16 | ||
| 15 | 39 | 13 | 77150 | 10610 | 505 | 13811 | 0.600.20 | 0.22 | ||
| 16 | 52 | -33 | 1794 | 4167 | 141 | 251 | 121 | 0.660.06 | 0.31 | |
| 17 | -2 | -27 | 57129 | 19710 | 494 | 877 | 0.660.15 | 0.10 | ||
| 18 | -9 | -48 | 60212 | 1213 | 9.01.4 | 381 | 772 | 81 | 0.640.06 | 0.18 |
| 19 | 14 | -77 | 33610 | 1605 | 7.11.8 | 291 | 462 | 92 | 0.670.08 | 0.30 |
| 20 | -54 | -31 | 39513 | 2106 | 7.41.5 | 312 | 783 | 91 | 1.040.09 | 0.32 |
| 21 | -74 | -22 | 2813 | 3402 | 9.90.3 | 171 | 311 | 103 | 0.940.02 | 0.41 |
| 22 | -93 | -13 | 4278 | 2815 | 11.20.8 | 241 | 511 | 101 | 1.180.05 | 0.51 |
| 23 | -46 | -87 | 1552 | 4744 | 12.00.5 | 151 | 311 | 111 | 0.510.03 | 0.41 |
| 24 | -215 | -98 | 43921 | 20510 | 223 | 716 | 0.770.14 | 1.23 | ||
| 25 | -57 | -162 | 60971 | 27129 | 457 | 5210 | 1.060.32 | 0.67 | ||
| 26 | -87 | -169 | 40410 | 1914 | 7.61.5 | 191 | 442 | 81 | 0.820.07 | 0.78 |
| 27 | -102 | -195 | 5299 | 1763 | 10.01.0 | 231 | 551 | 91 | 0.610.05 | 0.91 |
| 28 | 49 | -185 | 59620 | 31710 | 9.02.1 | 222 | 382 | 112 | 0.750.10 | 0.73 |
| 29 | -282 | 23 | 33615 | 31612 | 9.52.6 | 172 | 434 | 0.670.12 | 1.54 | |
| 30 | -246 | -79 | 755142 | 19639 | 0.810.58 | 1.37 | ||||
| 31 | -183 | 113 | 22913 | 26313 | 173 | 496 | 0.550.15 | 1.08 | ||
| 32 | -126 | -295 | 32511 | 2027 | 11.21.7 | 212 | 482 | 0.780.10 | 1.28 | |
| 33 | -68 | -49 | 996175 | 18835 | 389 | 13220 | 1.230.53 | 0.42 | ||
| ISM1 | -21 | 0 | 71070 | 10114 | 407 | 13210 | 0.940.30 | 0.12 | ||
| ISM2 | 41 | 39 | 710154 | 10328 | 7319 | 17130 | 0.640.67 | 0.27 | ||
| ISM3 | -80 | -197 | 17929 | 18626 | 4310 | 9518 | 0.590.42 | 0.85 |
Various diagnostic diagrams are plotted in Figure 3 against the sequencing index ([O ii] + [O iii])/H . The spread in values is small attesting to the rather high excitation and small range in ionization conditions. Both the diagnostic diagrams [N ii]/[O ii] and [S ii]/[O ii] versus ([O ii] + [O iii])/H (Fig. 3) are characteristic of high excitation nebular gas. From the point of view of physical conditions, the H ii regions of NGC 1313 are similar to the highest excitation H ii regions found in the outer parts of the spiral galaxy M 101 (see Kennicutt & Garnett [1996]); in contrast NGC 2997 does not appear to possess this high excitation population (see Walsh & Roy [1989]). The H ii regions of NGC 1313 illustrate the narrow range of thermal conditions and the crowding effect close to log ([O ii] + [O iii])/H 1.0 as discussed by McGaugh [1991]. The optical lines of oxygen dominate the cooling and their strengths are driven mainly by the heating rate. However the values of [O iii]/H and ([O ii] + [O iii])/H might be in the degenerate range where they become nearly independent of the level of O/H (McGaugh [1991]; Roy et al. [1996]). Then the strength of [O ii]/H and [O iii]/H depends mostly on the effective temperature of the ionizing radiation field and on the ionization parameter.

Although no obvious trend is seen across the disc of NGC 1313, the radial behaviour of some of the nebular parameters is illustrated in Figure 4. The radial position of the H ii regions are given in Table 2 (column 11) in terms of the fractional isophotal radius (Table 1). Figure 4 shows , the logarithmic extinction at H, ([O ii] + [O iii])/H and [O iii]/[N ii] versus radial distance in terms of the fractional isophotal radius (RC3). The behavior of these nebular indicators is rather uniform across the disc of NGC 1313. The exception is the H ii regions of the bar which show slightly lower values of the [O iii]/[N ii] ratios.
The three ISM positions show relatively high ratios of [N ii]/H and [S ii]/H (Table 2). This is especially true of [S ii]/H which has a mean of 0.46 0.13 in the ISM locations compared to 0.20 0.10 in the H ii regions. The values measured in the ISM of NGC 1313 are very similar to those found by Rand & Kulkarni [1990] in the extraplanar ionized gas of NGC 891, or by Reynolds [1988] in the diffuse interstellar background of the Galaxy. Rand & Kulkarni have suggested a diffuse radiation field from a Population I source as the origin of the warm diffuse ionized gas.

4 Discussion
4.1 The O/H abundance distribution
Using the ([O ii] + [O iii])/H ratio to derive the O/H abundance distribution in NGC 1313 (Edmunds & Pagel [1984], McCall et al. [1985], Dopita & Evans [1986]), one obtains a flat radial distribution at 12 + log O/H = 8.33 0.14. It seems preferable to use the ratio [O iii]/[N ii] to derive O/H abundances since ([O ii] + [O iii])/H could be in the degenerate regime with respect to oxygen abundance (McGaugh [1991]; Roy et al. [1996]). The calibration of [O iii]/[N ii] by Edmunds & Pagel [1984] was used to derive O/H with the following polynomial fitting for the range appropriate to the low O/H abundances and small values of [O iii]/[N ii] :
| (1) |
where log [O iii]/[N ii] –0.18 [1996]. The abundance distributions, shown in Figure 5 are consistent with a flat gradient (mean 12 + log O/H = 8.44 0.09 and slope 0.16 dex/) for most of the body of the galaxy (r 100′′). When using [O iii]/[N ii] as an abundance indicator, one obtains O/H values higher by more than 0.1 dex in the inner H ii regions corresponding to the bar; the bar extends to about or = 0.25 (1.5 kpc).
Abundances could be directly measured in four H ii regions using the electron temperature determined from the [O iii] 4363Å line; collision strengths and transition probabilities were taken from Mendoza [1983]. These points are shown by filled circles on Figure 5. The discrepancy between the directly determined O/H abundance and that from the strong line calibration is indicated by a bold line for the four H ii regions on Figure 5. The mean temperature of the four (11,000K) was also applied to the 29 H ii region spectra without measured Te to redetermine the O/H abundances using the strength of the [O ii] and [O iii] lines. The resulting abundance distribution is again flat at 12 + log O/H = 8.32 0.08, with slope -0.05 0.15 dex/. The abundance distribution is uniform, with perhaps a slight increase in the bar. The bar is not as prominent in H as the arms are. However the possibly higher level of O/H suggested by the [O iii]/[N ii] ratios in the bar is suggestive of recent enrichment which has not yet been diluted by the radial flows. In summary, whichever calibration is used, the O/H distribution across NGC 1313 appears uniform, as already implied in the earlier work of Pagel et al. [1980] using a much smaller number of H ii regions.

| Object | Type | Vmax | O/H gradient | |
|---|---|---|---|---|
| (mag.) | km/s | (dex/kpc) | ||
| SMC | IM IV-V | -16.99 | 0.00 | |
| LMC | SBm III | -18.43 | 65 | 0.00 |
| NGC 2366 | SBm IV-V | -16.73 | 46 | -0.0030.015 |
| NGC 4214 | SBm III | -18.79 | 59 | 0.00 |
| NGC 4395 | Sd III-IV | -18.57 | 90 | 0.0130.016 |
| NGC 1313 | SB(s) III-IV | -19.66 | 116 | -0.040.03 |
| NGC 300 | Sc II.8 | -18.59 | 102 | -0.18 |
| NGC 598 | Sc(s) II-III | -19.07 | 107 | -0.13 |
| NGC 7793 | Sd(s) IV | -18.85 | 116 | -0.16 |
Notes: (a) MB and morphological types are from Sandage & Tammann [1981]. (b) Vmax are from Luks & Rohlfs [1992] (LMC), from Wevers (thesis) (NGC 2366, NGC 4395), Allsopp [1979] (NGC 4214), Puche et al. [1990] (NGC 300), Ryder et al. [1995] (NGC 1313), Rogstad et al. 1976 [1976] (NGC 598), and Carignan & Puche (1990) (NGC 7793). (c) Abundances data are from Pagel et al. [1978] (LMC), Kobulnicky & Skillman [1996] (NGC 4214); Roy et al. [1996] (NGC 2366, NGC 4395); Zaritsky et al. [1994] (NGC 300, NGC 598, NGC 7793).
4.2 Behaviour of abundance gradients in disc galaxies
In Table 3 are presented brief data on other low luminosity disc galaxies. The absolute B luminosity is given in column 3 and the O/H abundance gradient in column 4. NGC 300 and NGC 7793 are the smallest known galaxies having a well-developed steep negative O/H radial abundance gradient. Inspection of Table 3 reveals other galaxies as luminous as these two, which have no gradient. In particular NGC 1313 seems at least as luminous and massive as M 33 (NGC 598) and NGC 7793, but it does not have a global O/H gradient. NGC 1313 differs from NGC 598 and NGC 7793 mainly by its bar feature.
Bars can modify the chemical evolution of disc galaxies as shown by Friedli & Benz [1995] and Friedli et al. [1994]. Bar-driven gas fueling the central regions results in enhanced star formation and metal-enrichment. But as the bar ages and re-fueling by the bar dies out, large scale dilution by radial mixing will decrease the slope of any pre-existing radial gaseous or stellar abundance gradient. A galaxy with an old and strong bar should display a shallow gradient. The bar of NGC 1313 is gas-rich; star formation may have been vigorous if the apparent metal enhancement (given only by the [O iii]/[N ii] indicator) is real. Thus its bar would have to be young. Young and strong bars which are gas rich and forming massive stars should have a steep abundance gradient at least in the bar (Friedli et al. [1994]), but NGC 1313 does not. This may be related to the moderate strength of its bar whose stellar axis ratio = 0.63 (Martin [1995]).
The character of the radial abundance distribution in SBm and late SBc galaxies obviously requires the effect of bars to be re-examined when applied to smaller mass disc galaxies. Clearly these galaxies have either a strong global gradient or no gradient at all, as exemplified by Table 3. The subtle effect of bars in galaxies of larger mass, which is to produce a shallow gradient, becomes in small mass disc galaxies a purely “on” or “off” effect. As soon as a bar is present in a small mass galaxy, the global abundance distribution – at least as seen in the interstellar gas – becomes uniform. This implies that the homogenizing action of the bar is rapid, or that systems like the Magellanic Clouds or NGC 1313 always had a bar or, less likely, never had an abundance gradient. The presence of a bar in low-mass disc galaxies results in the absence of any abundance gradient.
Although no significant correlation appears to exist between the slope of abundance gradients, the rotational velocity and the morphological type of the galaxies [1994], only late-type systems are able to have either a steep single-scale exponential radial abundance profile or no gradient at all. Moving to earlier types, gradients are observed in all galaxies, but they are never as steep as in late types. Moreover, if they have a young bar like NGC 3359 [1995], NGC 3319 [1994] and NGC 1365 [1996], the gradients show a break, with a steep inner part and a flat abundance distribution in the outer parts.
For axisymmetric discs, models show only a narrow range
of gradient slopes and these evolve little with time (e.g.
Mollá et al. [1996]). Such models apply obviously
only to a narrow range of “normal” galaxies. There is need
for theoretical investigation of the more common type of galaxy discs.
Two thirds of all galaxies have a bar or a non-axisymmetric
oval stellar light distribution in their centre (Sellwood & Wilkinson
[1993]; Martin [1995]). These asymmetries induce large scale radial
flows and mixing, and the galaxy must evolve very differently
from those where the different radial sections are considered
as closed boxes. Dramatic effects
on the shape and the slope of the radial abundance
distribution can appear. These effects may take place over
a period of a few dynamical timescales only;
these timescales may be short, as the “on” or “off” effect of bars on
abundance gradients in late-type galaxie would suggest. Mechanisms capable of
producing such a uniform abundance distribution have been
explored by Götz & Köppen [1992], Edmunds & Greenhow
[1995] and Roy et al. [1996], but no detailed
hydrodynamical simulations have been performed corresponding to evolving small
gas-rich galaxies.
Acknowledgments
We thank J. Pogson for fine technical support at the AAT.
We acknowledge helpful discussions with Danield Friedli, Pierre Martin,
Stéphanie Côté and Laurent Drissen.
The PATT Committee are thanked for assigning time on the AAT for this
project. This investigation was funded in part by the Natural
Sciences and Engineering Research Council of Canada, by the Fonds
FCAR of the Government of Quebec and by
the Visitor Program of the European Southern Observatory.
References
- [1979] Allsopp N. J., 1979, MNRAS, 188, 765
- [1971] Brocklehurst, M., 1971, MNRAS, 153, 471
- [1990] Carignan C., Puche D., 1990, AJ, 100, 394
- [1963] de Vaucouleurs G., ApJ, 137, 720
- [1991] de Vaucouleurs G., de Vaucouleurs A., Corwin H. G., Buta R., Paturel G., Fouqué R., 1991, Third Reference Catalogye of Bright Galaxies. Springer-Verlag, New York (RC3)
- [1986] Dopita M. A., Evans I. N., 1986, ApJ, 307, 431
- [1984] Edmunds M. G., Pagel B. E. J., 1984, MNRAS, 211, 507
- [1993] Edmunds M. G., Roy J.-R., 1993, MNRAS, 261, L17
- [1995] Edmunds M. G., Greenhow R. M., 1995, MNRAS, 272, 241
- [1993] Friedli D., Benz W., 1993, A&A, 268, 65
- [1995] Friedli D., Benz W., 1993, A&A, 301, 649
- [1994] Friedli D., Benz W., Kennicutt R. C., 1994, ApJ, 430, L105
- [1992] Götz M., Köppen, J., 1992, A&A, 262, 455
- [1995] Henry R. B. C., Howard J. W., 1995, ApJ, 438, 170
- [1983] Howarth I. D., 1983, MNRAS, 203, 301
- [1996] Kennicutt R. C., Garnett D. R., 1996, ApJ,456, 504
- [1996] Kobulnicky H. A., & Skillman D., 1996, ApJ, 471, 211
- [1992] Luks Th., Rohlfs K., 1992, A&A, 263, 41
- [1982] Marcelin M., Athanassoula E., 1982, 105, 76
- [1983] Marcelin M., & Gondoin Ph., 1983, A&AS, 51, 353
- [1995] Martin P., 1995, AJ, 109, 2428
- [1994] Martin P., Roy J.-R., 1994, ApJ, 424, 599
- [1995] Martin P., Roy J.-R., 1995, ApJ, 445, 161
- [1985] McCall M. L., Rybski P. M., Shields G. A., 1985, ApJS, 57, 1
- [1991] McGaugh S., 1991, ApJ, 380, 140
- [1983] Mendoza C., 1983, in IAU Symp. No. 103 Planetary Nebulae, ed. D. R. Flower, 143
- [1996] Mollá M., Ferrini F., Díaz A. I., 1996, ApJ, 466, 668
- [1974] Oke J. B., 1974, ApJS, 27, 21
- [1978] Pagel B. E. J., Edmunds M. G., Fosbury R. A. E., Webster B. L., 1978, MNRAS, 184, 569
- [1980] Pagel B. E. J., Edmunds M. G., Smith G., 1980, MNRAS, 193, 219
- [1994] Peters W. L., Freeman K. C., Forster J. R., Manchester R. N., Ables J. G., 1994, MNRAS, 269, 1025
- [1990] Puche D., Carignan C., Bosma A., 1990, AJ, 100, 1468
- [1990] Rand R. J., Kulkarni, S. R., 1990, ApJ, 352, L1
- [1988] Reynolds R. J., 1988, ApJ, 333, 341
- [1976] Rogstad D. H., WRight M. C. H., Lockhart I. A., 1976, ApJ, 204, 703
- [1989] Roy J.-R., Belley J., Walsh J. R., 1989, AJ, 97, 1010
- [1987] Roy J.-R., Walsh J. R., 1987, MNRAS, 228, 883
- [1996] Roy J.-R., Belley J., Dutil Y., Martin P., 1996, ApJ, 460, 284
- [1996] Roy J.-R., in Barred Galaxies, IAU Coll. no. 157, ed. R. Buta, B. Elmegreen, D. Crocker. ASP Conference Series, p. 63
- [1996] Roy J.-R., Walsh J. R., 1996, MNRAS, in the same issue
- [1993] Ryder S. D., 1993, Ph. D. Thesis, Australian National University
- [1993] Ryder S. D., Staveley-Smith L., Dopita M. A., Petre R., Colbert E., Malin D. F., Schlegel, E. 1993, ApJ, 416, 167
- [1995] Ryder S. D., Stavely-Smith, L., Malin D., Walsh W., 1995, AJ, 109, 1592
- [1981] Sandage A., Tammann G. A., 1981, A Revised Shapley Ames Catalog of Bright Galaxies. Carnegie Institution of Washington, Washington
- [1979] Seaton M. J., 1979, MNRAS, 187, 73P
- [1993] Sellwood J. A., Wilkinson A., 1993, Rep. Prog. Phys., 56, 173
- [1968] Sersic J. L., 1968, Z. Astrophys., 69, 242
- [1992] Vila-Costas M. B., Edmunds M. G., 1992, MNRAS, 259, 121
- [1989] Walsh J. R., Roy J.-R., 1989, ApJ, 341, 722
- [1984] Wevers B. M. H. R., 1984, Ph. D. Thesis, University of Groningen
- [1986] Wevers B. M. H. R., van der Kruit P. C., Allen R. J., 1986, A&AS, 66, 502
- [1994] Zaritsky D., Kennicutt R. C., Huchra J. P., 1994, ApJ, 420, 887