Evidence for Ordered Magnetic Fields
in the Quasar Environment
Abstract
At a distance of 20 pc from the purported supermassive black hole powering quasars, temperatures and densities are inferred from optical observations (Osterbrock (1989)) to be K and cm-3. Here we present Very Long Baseline Interferometry radio observations revealing organized magnetic fields on the parsec scale in the hot plasma surrounding the quasar OQ 172 (1442+101). These magnetic fields rotate the plane of polarization of the radio emission coming from the core and inner jet of the quasar. The derived rotation measure (RM) is 40,000 rad m-2 in the rest frame of the quasar. Only 10 mas (a projected distance of 68 pc) from the nucleus the jet absolute values of RM fall to less than 100 rad m-2.
Astrophysical Journal Letters, in press
1 Introduction
While typical extragalactic radio sources display Faraday RMs of 1–100 rad m-2 at arcsecond resolution, OQ 172 is one of only 20 sources found to have RMs exceeding 1000 rad m-2 (Taylor, Inoue & Tabara (1992); Inoue et al. (1995); Carilli et al. (1996)). About half of these are Compact Steep Spectrum (CSS) sources. Those of larger angular extent, for example, Hydra A, Cygnus A, and 3C 295, have been shown by VLA observations to possess ordered RM structure on scales of 1–100 kpc (Dreher, Carilli & Perley (1987); Perley & Taylor (1991); Taylor & Perley (1993)). The origin of these high RMs is a magnetized X-ray emitting cluster gas with field strengths of 10 G (Taylor, Barton & Ge (1994)). In the case of the high RM CSS sources, observations at a resolution of 1 arcsecond or more were insufficient to measure the scale of the magnetic fields and thereby determine their origin. Our multi-frequency VLBA polarimetric observations of the CSS quasar OQ 172 in the 6 and 18 cm bands agree with the high RMs seen at lower resolution (M. Inoue, private communication) and further reveal that the high RMs are associated with the nuclear component. Such differences in the RM structure on these small scales rule out a cluster magnetic field Faraday screen. We suggest that the high RMs seen in OQ 172, and perhaps in other CSS quasars as well, originate in the nuclear environment.
Osmer, Porter & Green (1994) have measured the redshift of OQ 172 to be z=3.52. Assuming = 50 km s-1Mpc-1 and =0.5, 1 mas corresponds to 6.81 pc.
2 Observations and Results
The observations, performed on 1995 June 4, were carried out at four frequencies in the 6 and 20 cm bands using the 10 element VLBA and one element of the VLA (see Table 1. for details of the parameters used). Observations of the strong calibrator OQ 208 were employed for the polarization calibration following the standard procedure (Cotton (1993); Roberts, Wardle & Brown (1994)). A short segment of data from the strongly polarized source 3C 345 (Brown, Roberts & Wardle (1994)) was used for calibration of the polarization angles. A single correction was applied for all 6 cm frequency observations of OQ 172. By applying a constant correction, we preserve the relative angles among the different frequencies, which are of prime importance to this experiment.
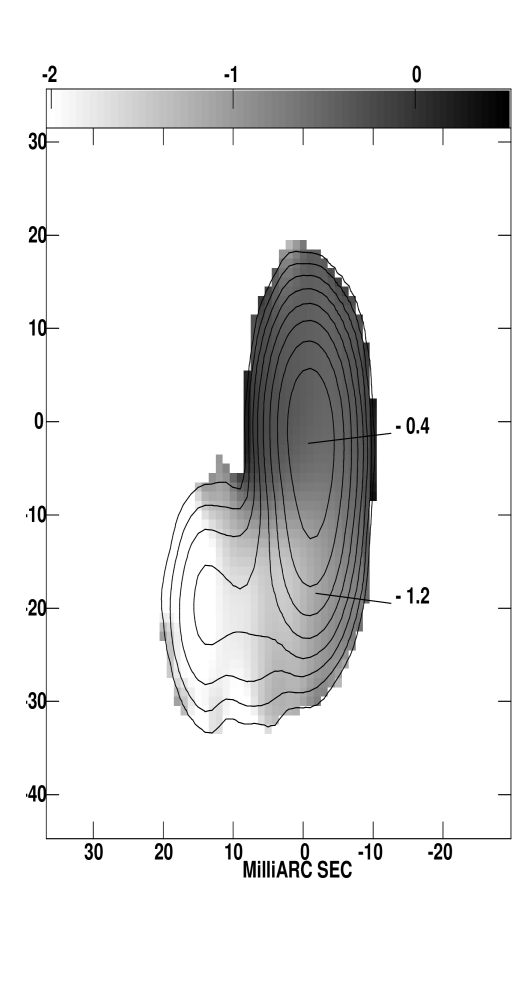
The four frequencies within the 6 cm band were combined to create a total intensity image of OQ 172 (Fig. 1). Based on compactness, relative strength, and a flat spectrum (see below), we identify the strong north-easternmost component in Fig. 1 as the core. At this resolution, OQ 172 shows the typical core and jet structure of a CSS quasar (Dallacasa et al. (1995)), but it is slightly unusual in that the jet turns through almost . The jet emission extends from the central core in a WSW direction and almost immediately bends southward. About 20 mas south of the core, it turns again, about , and extends to the east. No extended emission has been detected on scales greater than 100 mas (Spencer et al. (1989)). A spectral index image was made from the total intensity images at 6 cm and 20 cm (Fig. 2). The core shows the flattest spectrum (). However, because the core and the inner jet are unresolved it is likely that the core component has an even flatter spectrum. The spectral index of the jet is very steep (typically, ). This is steeper than the expected value of and is probably caused by a loss of flux at 6 cm due to a lack of short spacings.
TABLE 1
VLBA Observational Parameters
| Source | Frequency | BW | t | Scan | Time | |
|---|---|---|---|---|---|---|
| (1) | (2) | (3) | (4) | (5) | (6) | (7) |
| OQ 172 | 1.506, 1.514, 1.664, 1.672 | 7 | 500 | 4 | 8.5 | 94 |
| 4.616, 4.654, 4.854, 5.096 | 7 | 500 | 4 | 8.5 | 85 | |
| OQ 208 | 1.506, 1.514, 1.664, 1.672 | 7 | 500 | 4 | 4 | 40 |
| 4.616, 4.654, 4.854, 5.096 | 7 | 500 | 4 | 4 | 40 | |
| 3C 345 | 1.506, 1.514, 1.664, 1.672 | 7 | 500 | 4 | 4 | 4 |
| 4.616, 4.654, 4.854, 5.096 | 7 | 500 | 4 | 4 | 4 |
Notes to Table 1
Col.(1).—Source name.
Col.(2).—Observing frequencies in GHz.
Col.(3).—Total spanned bandwidth in MHz.
Col.(4).—Channel width output from correlator in kHz.
Col.(5).—Integration time output from correlator in seconds.
Col.(6).—Length of each scan in minutes.
Col.(7).—Total integration time on source in minutes.
Our 20 cm total intensity image of OQ 172 compares well with one made at 1.66 GHz by Dallacasa et al. (1995) using a global array. A 6 cm image produced by Gurvits et al. (1994), however, is inconsistent with any of the images produced by us or by Dallacasa et al.. The Gurvits et al. image is now thought to suffer from calibration errors.
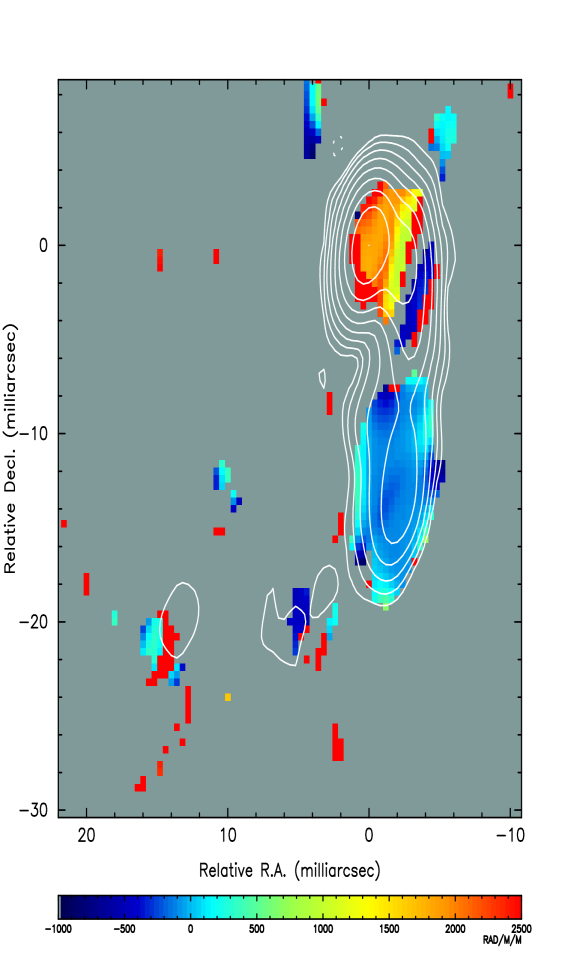
The RM structure of OQ 172 was determined by comparing the four position angle (PA) images in the 6 cm band and determining the change in PA with respect to wavelength squared for each pixel. The resulting RM image, shown in Fig. 3, reveals a distinct difference in RM between the core and the southern jet. Typical RM values at the core are extremely high, ranging from 1000 to 2000 rad m-2, with a gradient of about 445 rad m-2 mas-1 toward the southwestern jet, whereas values in the southern jet area range from 200 to 60 rad m-2. Fig. 4 shows sample fits to the position angle vs. wavelength squared for a group of pixels in the region of the core. The fits in the core agree well with a law in the core. In the jet, the lower rotation measures yield a much smaller change in position angle, approaching the minimum RM detectable over this frequency range. At 20 cm we found the inner region to be unpolarized, consistent with depolarization by the large RM gradients seen at 6 cm. The southern and eastern portions of the jet were found to be up to 15% polarized, with RMs of rad m-2.
The most striking feature of this high resolution RM image (Fig. 3) is the observed non-uniformity between the inner and outer jet. The lower RMs observed in the outer, southern jet are comparable to RM values obtained from single dish measurements of nearby objects (Simard-Normandin, Kronberg & Button (1981)) and can thus be explained as being Galactic in origin. However, something particular to the nuclear environment must be producing the high RMs in the inner core and jet of the quasar. In this region the RMs in the rest frame of OQ 172 are 20,000 to 40,000 rad m-2, values which, to our knowledge, are the highest RMs yet observed in any extragalactic source. Since the scale length for these RMs is so small (70 pc), they cannot be explained by the cluster-scale magnetic fields that cause the high RMs in the larger radio galaxies such as Hydra A and Cygnus A. The high RMs observed in OQ 172 thus result from an effect confined to the nuclear region. Here we discuss some of the possible candidates.
3 Discussion
We first consider internal Faraday rotation as the cause of the high observed RMs. In internal Faraday rotation, thermal material is mixed in with the synchrotron emitting plasma. For a slab model in which the density and magnetic field are homogeneous throughout the source (Burn (1966)), the position angle of the polarized flux density, , follows a wavelength squared law, but only between 0 and 90∘ with discontinuous jumps in . There is also considerable depolarization, with nulls at the discontinuous changes in polarization angle. Fig. 4 shows that for various pixels, turns through almost 90∘ without a discontinuity or marked change in the fractional polarization, and we thus rule out internal Faraday rotation.
We now consider a magnetized plasma in the nuclear region, but external to the radio source, as the cause of the RMs observed in the core. For such an external Faraday screen the rotation measure is given by (Spitzer (1978))
| (1) |
where is the electron density in cm-3, is in mGauss, and is in pc. On average the magnetic field, , will be larger than the parallel component, , by . If the magnetic field is tangled, then it will be larger by a factor where is the number of cells along the line of sight.
Two regions containing thermal gas which could act as a Faraday screen if magnetized are the broad line region (BLR) and the narrow line region (NLR) associated with active galactic nuclei. The BLR is thought to have a size of 0.1 pc and magnetic field strengths of perhaps 1 G (Rees (1987)). However the region of high RM in OQ 172 extends over 3 mas, or a projected size of 20 pc. Given the likely inclination of the jet close to the line-of-sight, this region could be considerably larger. Thus the BLR is unlikely to produce coherent RMs on the observed scale. The NLR is thought to cover a region of 100-1000 pc albeit with a small volume filling factor ( 10-3 [Osterbrock (1989)]). In order to produce a coherent RM on scales of tens of pc, the covering factor of the NLR must be close to unity, and the free-free opacity must be sufficiently low that the radio source is not extinguished at cm wavelengths. Free-free opacities for the NLR, with the standard estimates for density of 104 cm-3 and temperature of 104 K, are much less than unity at cm wavelengths (Ulvestad, Wilson & Sramek (1981)). The covering factor could be close to unity if the NLR clouds form preferentially in the vicinity of the radio jet (Norman & Wiley (1984)). If the magnetic field is in pressure equilibrium with the NLR then its field strength would be 0.6 mG. A RM of 40,000 rad m-2 could be produced in a pathlength of 0.01 pc. Such a short pathlength is unlikely to produce a coherent RM since variations across the source would result in depolarization. It is more likely that the magnetic fields are not in equipartition – if distributed over 20 pc the field strengths in the NLR are 0.5 Gauss.
Alternatively, the NLR clouds could be thermally confined by a more rarefied intercloud region at higher temperature. O’Dea (1989) took a density of 10 cm-3, temperature 107 K, and size of 100 pc for this intercloud material and assuming an equipartition magnetic field strength of 1 mG, predicted a RM of 2 105 rad m-2 toward the cores of quasars. A tangled magnetic field, or a shorter path length through this intercloud region could produce the RM observed for the core of OQ 172. O’Dea observed much lower RMs of 200 rad m-2 for a sample of 15 core dominated quasars and BL Lac objects. His measurements, however, were based on VLA observations at 150 mas resolution. At this comparatively low resolution his observations may not reflect the true RM of the core component.
Finally we ask ourselves what is special about OQ 172? It is possible that we are seeing it along some favorable line-of-sight, or that the magnetic fields of the NLR are enhanced in this source. Few sources, however, have been studied in this way. In fact the low polarization seen in many quasar cores at 6 cm (Cawthorne et al. (1993)) may be the result of depolarization from a Faraday screen. Just recently, multi-frequency VLBI polarimetry of the quasar 3C 138 has revealed a RM of within 22 pc from the nucleus while the jets further out exhibit low RMs (Cotton et al. (1996)). OQ 172 is also similar to other quasars in that, once corrected for rotation measure, the polarized emission appears to follow the curve of the jet (Roberts et al. (1989); Brown, Roberts & Wardle (1994)). RM studies performed to date at arcsecond resolution are in almost all cases dominated by the polarized flux of jets (Roberts et al. (1989)). The jets will have lower RMs if they are outside the region of high magnetic fields. The “anomalous” high RM CSS sources discovered in surveys at low resolution may be unusual only in that their cores dominate the integrated polarized flux density and are therefore detectable in the integrated RM. High resolution RM measurements of additional sources, especially “typical” quasars are needed. This technique may lead us to a better understanding of the nuclear environment in AGNs.
References
- Brown, Roberts & Wardle (1994) Brown, L. F., Roberts, D. H., & Wardle, J. F. C. 1994, ApJ, 437, 108
- Burn (1966) Burn, B. F. 1966, MNRAS, 133, 67
- Carilli et al. (1996) Carilli, C. L., Röttgering, H., van Ojik, R., Miley, G., & van Breugel, W. 1996, ApJS, in press
- Cawthorne et al. (1993) Cawthorne, T. V., Wardle, J. F. C., Roberts, D. H., Gabuzda, D.C., & Brown, L. F. 1993, ApJ, 416, 496
- Cotton (1993) Cotton, W. D. 1993, AJ, 106, 1241
- Cotton et al. (1996) Cotton, W. D., Dallacasa, D., Fanti, C., Fanti, R., Foley, A. R., Schilizzi, R. T., & Spencer, R. E. 1996, A&A, in press
- Dallacasa et al. (1995) Dallacasa, D., Fanti, C., Fanti, R., Schilizzi, R. T., & Spencer, R. E. 1995, A&A, 295, 27
- Dreher, Carilli & Perley (1987) Dreher, J. W., Carilli, C. L., & Perley, R. A. 1987, ApJ, 316, 611
- Gurvits et al. (1994) Gurvits, L. I., Schilizzi, R. T., Barthel, P. D., Kardashev, N. S., Kellermann, K. I., Lobanov, A. P., Pauliny-Toth, I. I. K., & Popov, M. V. 1994, A&A, 291, 737
- Inoue et al. (1995) Inoue, M., Tabara, H., Kato, T., & Aizu, K. 1995, PASP, 47, 725
- Johnston et al. (1995) Johnston, K. J. et al. 1995, AJ, 110, 880
- Norman & Wiley (1984) Norman, C., & Miley, G. 1984, ApJ, 141, 85
- O’Dea (1989) O’Dea, C. P. 1989. A&A, 210, 35
- Osmer, Porter & Green (1994) Osmer, P. S., Porter, A. C., & Green, R. F. 1994, ApJ, 436, 678
- Osterbrock (1989) Osterbrock, D.E. 1989, Astrophysics of Gaseous Nebulae and Active Galactic Nuclei (Mill Valley: University Science Books)
- Perley & Taylor (1991) Perley, R. A., & Taylor, G. B. 1991, AJ, 101, 1623
- Rees (1987) Rees, M. J. 1987, MNRAS, 228, 47P
- Roberts et al. (1989) Roberts, D. H., Wardle, J. F. C., Brown, L. F., Gabuzda, D. C., & Cawthorne, T. V. 1989 in “Parsec-Scale Radio Jets”, eds. A. Zensus & T. Pearson, Cambridge, p.110
- Roberts, Wardle & Brown (1994) Roberts, D. H., Wardle, J. F. C., Brown, L. F. 1994, ApJ, 427, 718
- Simard-Normandin, Kronberg & Button (1981) Simard-Normandin, M., Kronberg, P. P., & Button, S. 1981, ApJS, 45, 97
- Spencer et al. (1989) Spencer, R.E., McDowell, J.C., Charlesworth, M., Fanti, C., Parma, P., & Peacock, J.A. 1989, MNRAS, 240, 657
- Spitzer (1978) Spitzer, L. 1978, Physical Processes in the Interstellar Medium (New York: Wiley)
- Taylor, Inoue & Tabara (1992) Taylor, G. B., Inoue, M, & Tabara, H. 1992. A&A, 264, 421
- Taylor & Perley (1993) Taylor, G. B., & Perley, R. A. 1993, ApJ, 416, 554
- Taylor, Barton & Ge (1994) Taylor, G. B., Barton, E. J., & Ge, J. 1994. AJ, 107, 1942
- Ulvestad, Wilson & Sramek (1981) Ulvestad, J. S., Wilson, A. S., Sramek, R. A. 1981, ApJ, 247, 419

angle 15°. Contour levels are at 1.7, 1.7, 3.4, 6.8, 14, 27, 54, 109 and 218 mJy/beam with negative contours shown as dashed lines. Positions are given in milliarcseconds relative to the strongest component, located at RA(J2000) 14:45:16.465 and Dec(J2000) 09:58:36.072 (Johnston et al. (1995)). This naturally weighted image has a dynamic range of 1700. Overlaid on the contours is the RM-corrected projected magnetic field of OQ 172. A vector length of 1 mas corresponds to a polarized intensity of 10.4 mJy/beam at 6 cm. The error in the projected magnetic field direction ranges from 10 – 20∘.