On the mass distribution in the Shapley Supercluster inferred from X-ray observations
Abstract
We present an analysis of a mosaic of ROSAT PSPC and Einstein Observatory IPC X–ray observations of 14 clusters and 2 groups of galaxies, enclosed in a sky area centred on A3558 within the Shapley Supercluster region.
From the mass of each cluster, extrapolated to a density contrast of 500, we define 4 large structures: (1) the core of the Shapley Supercluster with radius 13 Mpc; (2) the core plus A1736; (3) the core, A1736 and the western extension (A3528-A3530-A3532) and A3571; and (4), adding the northern cluster pair A1631–A1644 to structure (3), the Supercluster as a whole enclosed within a radius Mpc. The observed total masses range between 3.5–8.5 . The mass values derived from the observed intracluster gas (assuming a baryon fraction consistent with primordial nucleosynthesis) are of the order of few times . Given these estimates, the core is a bound structure with a very significant overdensity of at least 5 times the critical density, indicating that is approaching maximum expansion before collapsing. Structure (2) has an overdensity of 1.7 on a scale of Mpc. The core is then a 2–3.7 fluctuation in an initial Gaussian perturbation field, normalized for galaxies and clusters. The highest value applies if we extrapolate to a density contrast of 200 and assume that .
The baryon fraction of the core of the Shapley Supercluster, with A1736, is about 15 per cent over a radius of 28 Mpc.
keywords:
galaxies: clustering – X-ray: galaxies.1 INTRODUCTION
First noted by Shapley (1930), the Shapley Supercluster is a large overdensity of galaxies in the region of Centaurus–Hydra (, ) which has been widely studied both in the optical (Melnick & Moles 1987; Vettolani et al 1990; Raychaudhury et al 1991; Quintana et al 1995) and X-ray wavebands (Day et al 1991 based on GINGA data; Breen et al 1994 on Einstein Observatory IPC data).
Analysis of the structure of the supercluster, performed by Zucca et al (1993; SC 26 in their catalogue) and Einasto et al (1994; SC 80), suggest that it is a concentration with more than 20 clusters of galaxies within a volume of Mpc3 ( times the average density of ACO clusters at the same , Vettolani et al 1990; we assume and ), distributed in 4 different regions: (i) the core around A3558 and A3562; (ii) an eastern part centred around A3571; (iii) a western region with A3532 and (iv) an elongation to the north (A1736, A1644). The unusual nature of this region is also borne out through X–ray observations which show these six clusters to be amongst the 46 X–ray brightest at high galactic latitude (, Edge et al 1990). Furthermore, the Shapley concentration probably contributes about 10–20 per cent to the optical dipole observed in the motion of the Local Group with respect to the Cosmic Microwave Background (Lynden-Bell et al 1988, Raychaudhury 1989, Scaramella et al 1989).
The Shapley Supercluster is thus an extremly dense region where peculiar and global cluster–supercluster characteristics can be studied. Following an initial analysis by Fabian (1991), which showed that its central region is the largest mass overdensity yet discovered on so a large scale, we attempt here to estimate the matter (gas, stellar, gravitational) distributions, the total baryon fraction, and whether the region is bound. To this aim, we collate all the available ROSAT PSPC images of the clusters present of the Shapley area, completing the resulting mosaic with Einstein Observatory IPC images of 3 other clusters. Then, their surface brightness profiles are deprojected to estimate the gas and gravitational masses, as described in Section 2. Combining these results with constraints on the mass in galaxies, we obtain limits on the baryon fraction of the Shapley Supercluster in Section 3. In Section 4 we discuss the matter (gas and dark) distribution in the various Shapley structures, and the implications of our results for cosmology and large scale structure. We summarize our conclusions in Section 5.
2 X-RAY DATA AND ANALYSIS
The surface brightness profiles from ROSAT Position Sensitive Proportional Counter (PSPC) images of 11 clusters and 2 groups, and Einstein Observatory Imaging Proportional Counter (IPC) data for 3 other clusters (A1631, A1644, A1736), are analysed using the image deprojection procedure, as described below.
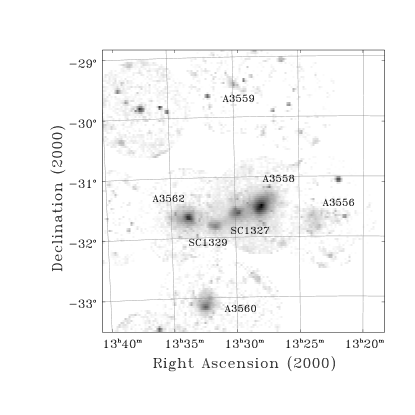
The spatial position of the PSPC and IPC fields and the clusters of the ACO catalogue suspected as members of the Shapley Supercluster are shown in Fig. 1; a mosaic of the exposure–corrected images is shown in Fig. 2.

In Table 1 the ACO coordinates and details of the X-ray exposure for each cluster in the sample are summarized. The optical data on redshift and velocity dispersion , are taken from the literature; the X–ray data includes the instrument, the exposure time, and the spatial average intracluster medium (ICM) temperature, , (available from previous work). In the last column, we quote the Galactic absorption taken from the 21-cm determinations by Stark et al (1992).
Figure 2: In the panel below, we present a mosaic
of the X–ray
observations. In the panel to the right, we show the observations
of clusters in the northern extension (A1631 and A1644) which is located
away from
the core in the NW direction. Note the two
groups SC1327-312 and SC1329-313
(west and east, respectively) between A3558 and A3562. A close–up image
of the core is shown in Fig. 7.
![[Uncaptioned image]](/html/astro-ph/9704092/assets/x2.png)
![[Uncaptioned image]](/html/astro-ph/9704092/assets/x3.png)
| name | inst. | exp | ref | ref | ||||||
| sec | hh mm ss | dd mm ss | km s-1 | opt | keV | X-ray | cm-2 | |||
| A1631 | IPC | 5705 | 12 52 50 | 26 17 | 0.0466 | 628 [2.7] | (1) | 2.8 [653] | (4) | 3.9 |
| A3528 | PSPC | 15751 | 12 54 18 | 01 16 | 0.0521 | 864 [4.8] | (2) | … | … | 6.1 |
| A3530 | PSPC | 8620 | 12 55 37 | 21 14 | 0.0532 | 391 [1.1] | (2) | 3.2 [703] | (4) | 6.0 |
| A1644 | IPC | 11096 | 12 57 15 | 22 13 | 0.0475 | 933 [5.6] | (1) | 4.7 [869] | (5) | 4.3 |
| A3532 | PSPC | 8620 | 12 57 19 | 22 13 | 0.0537 | 594 [2.4] | (2) | 4.4 [838] | (6) | 6.2 |
| A3556 | PSPC | 13765 | 13 24 06 | 39 38 | 0.0481 | 554 [2.1] | (3) | … | … | 4.7 |
| A1736 | IPC | 10660 | 13 26 52 | 07 33 | 0.0446 | 835 [4.5] | (2) | 4.6 [858] | (5) | 5.1 |
| A3558 | PSPC | 30213 | 13 27 55 | 29 32 | 0.0475 | 986 [6.1] | (3) | 6.2 [1012] | (7) | 4.4 |
| A3559 | PSPC | 8127 | 13 29 54 | 31 29 | 0.0461 | 279 [0.6] | (2) | … | … | 4.5 |
| A3560 | PSPC | 14929† | 13 31 51 | 13 25 | 0.0462 | 403 [1.2] | (2) | … | … | 4.3 |
| A3562 | PSPC | 20202 | 13 33 32 | 40 23 | 0.0491 | 825 [4.4] | (2) | 3.8 [772] | (6) | 4.2 |
| A3564 | PSPC | 8011 | 13 34 22 | 13 21 | 0.0498 | … | (2) | … | … | 4.5 |
| A3566 | PSPC | 7357 | 13 38 59 | 33 13 | 0.0497 | … | (2) | … | … | 4.3 |
| A3571 | PSPC | 6072 | 13 47 29 | 51 57 | 0.0391 | 1060 [7.0] | (2) | 7.6 [1133] | (6) | 4.0 |
| SC1327-312 | PSPC | 50415† | 13 29 45 | 36 12 | 0.0495 | 676 [3.1] | (3) | … | … | 4.3 |
| SC1329-313 | PSPC | 20202 | 13 31 36 | 48 45 | 0.0469 | 1044 [6.8] | (3) | … | … | 4.2 |
| (1) Zabludoff et al 1990; (2) Quintana et al 1995; (3) Bardelli et al 1994 | ||||||||||
| (4) White et al 1996; (5) David et al 1993; (6) Edge et al 1990; (7) Day et al 1991 | ||||||||||
| † the exposure is equal to the sum of the overlapping images | ||||||||||
| ‡ in the square brackets and italic font, we report the reference values (, ) obtained from | ||||||||||
| the relationships (cf. White et al 1996): and , | ||||||||||
| where (measured in 100 km s-1) and (in keV) are the observed values. | ||||||||||
| A1631 seq. 1900; | ||||||||||
| A3528 seq. wp300093; also known as Klemola 21 (Klemola 1969), it is a X-ray double cluster: | ||||||||||
| A3528n (, , = 3.8 keV [772 km/s] ref. 4); | ||||||||||
| A3528s (, , = 4.0 keV [795 km/s] ref. 4). | ||||||||||
| A3530 seq. wp701155n00; its ROSAT field contains also A3532. | ||||||||||
| A1644 seq. 7654; it is a cD cluster. | ||||||||||
| A3532 seq. wp701155n00; also Klemola 22. | ||||||||||
| A3556 seq. wp800375n00 | ||||||||||
| A1736 seq. 7653; a foreground group of galaxies is also seen optically at 10400 km/s (Dressler & Schectman 1988) | ||||||||||
| A3558 seq. wp800076; Shapley8, a cD cluster (cf. also PSPC analysis by Bardelli et al 1995) | ||||||||||
| A3559 seq. rp800285n00. | ||||||||||
| A3560 seq. wp800381+wp800381a01+wp800381a02. | ||||||||||
| A3562 seq. rp800237n00. | ||||||||||
| A3564 seq. rp800288n00+a01; no significant X-ray emission; not considered in the sample analysed. | ||||||||||
| A3566 seq. rp800286; no X-ray significant emission; not considered in the sample analysed. | ||||||||||
| A3571 seq. rp800287; it is a cD cluster. | ||||||||||
| SC1327-312 seq. wp800076+rp800237n00; singled out optically in (3) as SC1329-314 B and in the X–ray band | ||||||||||
| by Breen et al. (1994). | ||||||||||
| SC1329-313 seq. rp800237n00; singled out optically in (3) as SC1329-314 A and in the X–ray band | ||||||||||
| by Breen et al. (1994). | ||||||||||
2.1 Deprojection analysis
We use PSPC images in the 0.4–2 keV band, which maximizes the signal-to-noise ratio due to reduced background. The images are subdivided into four energy bands (42–51, 52–90, 91–131, 132–201 PI channels) and corrected by the corresponding exposure maps using an implementation of the procedure written by Snowden and collaborators (1994) in the Interactive Data Language. The 0.8–3.5 keV IPC band images (corresponding to the range 5–10 PI channels) are also flat-fielded.
The cluster surface brightness profiles are extracted using the XIMAGE software (vers. 2.53), and then analysed using the deprojection technique pioneered by Fabian et al (1981). As a more detailed description is given by White et al (1996), we only summarize the assumptions and the limitations of this analysis method here. Assuming spherical geometry for the cluster and hydrostatic equilibrium, the deprojection technique enables the volume count emissivity of the hot ICM to be determined as a function of radius from the surface brightness profile. Including the effects of absorption by the intervening material (hydrogen column density ) and detector characteristics, a choice of the gravitational potential (functional form, core radius , velocity dispersion ) allows the physical properties of the ICM to be determined (assuming the perfect gas law). In this analysis, we use a true isothermal sphere to describe the shape of the gravitational potential (Binney & Tremaine 1987; a comparison of the effect of different potential laws is described by White & Fabian 1995).
Given the complexity of the Shapley region, some uncertainties in the available values of from optical analysis may arise from diffuse clusters overlapping and/or the ill-defined boundary of each structure. Because of this, we interpolate the values from where available, using the general relationships from White et al (1996) (see notes of Table 1; sometimes there can be a significant discrepancy between the interpolated and the optical velocity dispersion, i.e. A3530 and A3532). The optical velocity dispersion is used when is unknown (i.e.for A3556, A3559, A3560, SC1327-312 and SC1329-313). The consistency of the optical value is then compared against the values inferred by interpolating the deprojected and luminosity . If there is a large disagreement, then is altered according to the interpolated values (as found for A3559, A3560, SC1329-313).
In Table 2, the input values of , the velocity dispersion and the outer hydrostatic pressure, , are presented. These parameters enable us to produce a flat deprojected temperature profile for each cluster, according to the isothermal assumption. The table also shows the results of the deprojection analysis. The rebin factor gives the degree of grouping of the surface brightness profile to improve the counts statistics, and the radius is the outer extremity of the deprojection where the luminosities and masses (the gravitating mass, , the gas mass, , and the stellar mass, ) are quoted. The values with the subscript “500” are discussed below in Sect. 3.
Note the background contribution is estimated by considering the surface brightness value just outside the maximum radius of each deprojection.
| name | rebin | + | |||||||||
| km s-1 | Mpc | K cm-3 | bin† | Mpc | erg s-1 | Mpc | % | ||||
| A1631 | 628 | 0.2 | 0.4 | 5 | 0.40 | 0.1 | 0.99 | 0.17 + 0.42 | 1.23 | 3.07 | 0.060 |
| A3528n | 772 | 0.3 | 4.2 | 3 | 0.37 | 1.1 | 1.09 | 0.62 + | 1.65 | 7.23 | 0.079 |
| A3528s | 795 | 0.2 | 4.0 | 3 | 0.37 | 1.4 | 1.40 | 0.62 + | … | … | … |
| A3530 | 703 | 0.4 | 1.0 | 3 | 0.76 | 1.0 | 2.27 | 1.61 + 0.50 | 1.40 | 4.69 | 0.117 |
| A1644 | 856 | 0.5 | 4.0 | 3 | 0.61 | 2.5 | 2.10 | 1.78 + 0.32 | 1.70 | 8.12 | 0.120 |
| A3532 | 791 | 0.4 | 1.5 | 3 | 0.90 | 2.9 | 3.45 | 3.33 + 0.66 | 1.55 | 6.38 | 0.136 |
| A3556 | 644 | 0.6 | 0.4 | 4 | 1.55 | 0.7 | 4.17 | 3.82 + … | 1.29 | 3.63 | 0.102 |
| A1736 | 835 | 0.7 | 3.5 | 3 | 0.63 | 1.4 | 1.62 | 1.45 + 0.27 | 1.66 | 7.54 | 0.129 |
| A3558 | 986 | 0.6 | 2.8 | 3 | 1.03 | 9.8 | 5.57 | 6.84 + 1.20 | 1.94 | 12.18 | 0.176 |
| A3559 | 511 | 0.7 | 0.2 | 3 | 1.19 | 0.3 | 1.97 | 1.89 + … | 1.00 | 1.66 | 0.104 |
| A3560 | 738 | 0.5 | 0.7 | 3 | 1.34 | 2.3 | 4.67 | 5.36 + … | 1.48 | 5.43 | 0.135 |
| A3562 | 772 | 0.6 | 1.0 | 3 | 1.24 | 3.9 | 4.50 | 5.86 + 0.75 | 1.54 | 6.12 | 0.152 |
| A3571 | 1060 | 0.3 | 4.0 | 3 | 0.91 | 14.5 | 6.22 | 5.82 + 0.46 | 1.99 | 12.79 | 0.142 |
| SC1327-312 | 676 | 0.5 | 2.2 | 3 | 0.60 | 1.1 | 1.32 | 1.26 + … | 1.36 | 4.27 | 0.137 |
| SC1329-313 | 511 | 0.4 | 1.0 | 3 | 0.45 | 0.3 | 0.61 | 0.46 + 0.28 | 1.07 | 2.05 | 0.146 |
| † the original binsize is in PSPC images and in IPC; kpc at . | |||||||||||
| for this double cluster, we estimate that at = 0.74 Mpc, which is the radius that encloses both | |||||||||||
| substructures. | |||||||||||
3 THE BARYON FRACTION
Comparison of observations of light-element abundances with standard primordial nucleosynthesis theory indicates that the baryon density parameter lies between “reasonable” values of 0.037 and 0.088 (see Copi et al 1995 for a discussion on the meaning of “reasonable” due to the fact that the main uncertainties are not described by a Gaussian). These limits represent and respectively, that we consider hereafter when referring to the baryon density parameter from primordial nucleosynthesis. It should be noted that these changes, from the previously accepted value of (Walker et al 1991), arise from revised constraints on the D + 3He (for the lower limit on ) and 7Li abundance (for the upper limit).
Thus, if regions that collapse to form rich clusters in an Einstein-de Sitter Universe retain the same value of as the rest of the Universe, then only a few per cent of cluster masses can be due to baryons (mostly gas in the ICM, but also stars in galaxies). However, observations of clusters reveal a baryon fraction, (the sum of the gas fraction in the ICM and the stellar fraction contributed by the cluster galaxies), of 10–30 per cent.
Historically, X-ray observations have always shown a relatively high baryon fraction in clusters (e.g. Stewart et al 1984), although White & Frenk (1991) highlighted the discrepancy when new tighter and lower constraints from nucleosynthesis were published. In the Coma cluster, White et al (1993; cf. also Briel et al 1992) found the ratio between the gas plus stellar mass to the total gravitational mass to be about 0.226 0.015. Thus, the disagreement between the observed baryon density and that predicted by cosmic nucleosynthesis appears to be exceeded by a factor of 3 for all reasonable values of the Hubble constant (there is only a weak dependence on ).
This problem, sometimes known as the “Baryon Catastrophe”, is not unique to the Coma cluster as the discrepancy appears to be similar, if not worse, in many other clusters (Henry et al 1993, White & Fabian 1995). The baryon content of the Shapley Supercluster has also been estimated to be significantly high at 18 per cent, in a 37 Mpc region around the core (Fabian 1991). Such an overdensity on this large a scale means that the severest problem is then the accumulation of baryons within a standard cosmological model.
Possible solutions to the “Baryon Catastrophe” are: (a) a non-zero Cosmological Constant , so that (cf. Carroll et al 1992 for a discussion on the limit on ), (b) a different estimate of from the nucleosynthesis calculations of the light elements abundances (as may appear from the recent conflicting observations of deuterium abundances, cf. Hata et al 1996 and Schramm & Turner 1996, and references there), (c) inappropriate X-ray modelling of clusters which may result in overestimations of gas mass and/or underestimations of gravitational mass (e.g. Gunn & Thomas 1996).
In our case, the gas fraction, , is estimated by the ratio of gas mass determined in the deprojection analysis to the gravitational mass. To estimate the stellar fraction, , we adopt the optical luminosity function as obtained by Raychaudhury et al (1991) for the 9 clusters and 1 group in common with our sample. Assuming a mass-to-light ratio appropriate for elliptical galaxies of 2.46 (White et al 1993), we estimate the stellar mass using the Schechter luminosity function (1976) with a slope of . As the optical luminosity function is quoted at 2 Mpc, is interpolated to a value at , assuming a King profile for the mass distribution.
For those 3 clusters (A3556, A3559, A3560) and the SC1327-312 group lacking the information required to determine their optical luminosity functions, we adopt the median statistic as a robust estimator of the stellar fractions available. The median value of 2.1 per cent (note, the whole range is between 0.7–4.6 per cent) is used to determine in these four objects. The results on and , with the total baryon fraction , appropriate for individual values of , are shown in Fig. 3.

In this figure, a significant disagreement between the maximum value for obtained from primordial nucleosynthesis analysis (dot-dashed line) and that determined from X–ray observations of clusters is evident. This is primarily due to , which increases with radius, as the contribution of is almost radially independent and consistent with all nucleosynthesis constraints (the dispersion around the average value of 0.023 is 0.012). This emphasizes the problem that any reasonable , that is times in our sample, would result in a baryon catastrophe.
In order to compare the values within a consistent region for all clusters, we extrapolate the matter distributions to a density contrast equal to 500. The density contrast, , corresponding to a comoving region of radius , is defined as:
| (1) |
where is the expected mass in the same region in a homogeneous universe where the density is equal to :
| (2) |
The overdensity value of 500 is chosen as representative of the cluster region where the assumption of hydrostatic equilibrium used in deprojection is still valid. In fact, various numerical simulations (cf. Evrard et al 1995, Bartelmann & Steinmetz 1996) show the gas to be largely thermalized inside the relaxed regions characterized by this overdensity, with outer envelopes that accret and/or merge on the cluster at lower density contrast.
Thus, to determine the baryon fraction , we need to extrapolate , and to the radius , where . The resulting values of have a median value of 1.54 Mpc and lie between 1.00 (A3559) and 1.99 (A3571) Mpc. The extrapolated , (cf. 11th column in Table 2), is obtained using an isothermal profile with the and as given in Table 2; the baryonic mass at is calculated (i) by fitting a corrected King model with equal to 2/3 to the deprojected density profile and integrating the best–fit to obtain the gas mass, and (ii) extrapolating the stellar mass as discussed above. The last column in Table 2 quotes the calculated values of at the same density contrast for each cluster (cf. also Fig. 4). We obtain a median estimate of , for the extrapolated gas and stellar fraction, respectively, with a range extending from 0.060 (A1631) to 0.176 (A3558).

3.1 The Uncertainties in the Baryon Fraction
The uncertainties inherent in the single-phase deprojection analysis are discussed by White & Fabian (1995). We note that the method gives direct and tight constraints on the gas mass through the comparison with the observed emission-weighted temperature. Also, any multiphase analysis of the ICM in a cooling flow will not lower the estimated baryon fraction at radii larger than the cluster core (Gunn & Thomas 1996). Therefore, the main uncertainties arise from the determination of the total gravitational mass.
Our estimates of the total mass as extrapolated values at density contrast of 500, , were obtained using optical velocity dispersions (and X-ray temperatures) measured within and adopting the isothermal assumption valid on the so-defined regions. However, given the complexity of the Shapley Supercluster because of the great number of extended sources present in the field, some uncertainties could arise on the total amount of mass present in each cluster. To limit this uncertainty, we check the cluster masses against optical constraints. Quintana et al (1995) have applied the Virial Theorem to 8 of the 12 clusters and 1 of the 2 groups in our sample (cf. their Table 7 for estimates on from galaxies within 2 Mpc, which is an acceptable limit for the thermalized region as above shown). Using a linear dependence of mass with radius, we compare our values of with their rescaled . Generally, the optical value is subject to large errors, both because of the unknown shape of the 3–dimensional tensor of the velocity dispersion and because of projection effects. In fact (e.g. see David et al 1995), there may be discrepancies of order a factor 2 between the cluster mass determinations from the application of the Virial Theorem to optical data and the results from X-ray analysis. Assigning a gravitational radius equal to , we determine a median ratio, with respect to the X–ray value, of 1.2 (5th and 95th percentile: 0.7 and 2.3). The extreme cases (A3530, A3559, A3560 at the lower end, and A3556 and A3562 at the upper end) reflect the disagreement between the velocity dispersion obtained optically and that inferred from .
Here we note, and then show in Fig. 5, that only by a correction factor larger than 1.5 on the gravitating mass, can the baryon fraction drop down to the upper limit from the nucleosynthesis calculation (1.48=0.130/0.088, for ; for the factor increases till to 3.82 for km s-1 Mpc-1).
In Fig. 5, we consider corrections that could theoretically reconcile the estimates of as measured in clusters with the value from the primordial nucleosynthesis calculations: (a) a contribution to the gravitating mass, although it appears unable to make the necessary correction (when it is less or equal to a factor 1.5 as discussed above); (b) , which allows agreement within the constraints on , for all values of in the range 50–100 km s-1 Mpc-1; (c) a combination of the 2 above corrections, requiring km s-1 Mpc-1 to be consistent with the .
However, note that any conclusion on the median values observed in our sample become more dramatic when the more luminous clusters such as A3558 and A3571 are considered. Fig. 4 emphasizes that there is a real dispersion in the baryon content of the clusters.

4 DISCUSSION
Using the isothermal gravitational mass profiles, extrapolated to the density contrast of 500, , we attempt to find how much of the Shapley Supercluster is bound. Then, the baryonic component of the structures are studied and the significance of their total mass assessed in terms of Gaussian random fluctuations in the universal mass density field.

In this analysis on the mass component distribution inferred from X-ray observations of clusters, we use the sample defined above and collect all the data relevant to this aim. Furthermore, to provide information on the completeness of our sample, all the clusters present in the Shapley region, as obtained by cross–correlating the lists from Zucca et al (1993), Einasto et al (1994) and Quintana et al (1995), are binned with respect to their comoving separation from A3558 and shown in Fig. 6. The comoving radius is defined as
| (3) |
where is the angular apparent separation on the sky between A3558 and the cluster , and is the respective comoving distance.
As it is clear from this figure, not all the clusters in the Shapley region were detected or observed in X-ray band. Within 30 Mpc of A3558, there are 5 clusters undetected: 3 from PSPC observations (A3554, A3564, A3566) and 2 (A3552, A3555) from GINGA scan of the region (Day et al 1991). On the other hand, beyond 30 Mpc, 8 out of 10 clusters were not observed; the other 2, A3572 and A3575, were, but remain undetected.
We also checked for any feature of the X-ray emission from these 15 clusters in the ROSAT All-Sky Survey Bright Source Catalogue (Voges et al 1996). Within 0.5∘ of the optical centre as reported in ACO catalogue, three (A3524, A3557, A3572) have a suspected hard and extended counterpart, an other two (A3564 and A3577) have a hard but not-extended nearby source. From the respective counts rate as quoted in the catalogue, and a conversion factor of erg cm-2 s-1 for 1 count s-1, we obtain only for A3572 a luminosity of about 3.5 erg s-1 (corresponding to around 2.5 M⊙ in Mgas, when its luminosity is scaled to the Coma cluster), whereas the other 4 clusters have an estimated luminosity of 0.1–0.3 erg s-1, equivalent to M 0.6–0.9 M⊙.
To summarize, we do not expect a significant contribution from X-ray detectable baryonic matter extra within radii less than 30 Mpc from A3558. Some conclusions on related topics, such as possible corrections to our estimates of the baryonic and total mass on scales larger than 30 Mpc, will be discussed in section 4.1 and 4.2, respectively.
We analyse the distribution of matter that we observe in 4 hierarchical spherical structures, increasing in size from the core (A3558, A3556, A3559, A3560, A3562, SC1327-312 and SC1329-313; Fig. 7) to the whole supercluster, of comoving radius centred on A3558 and given by eq. (3).
We see that the core, structure (1), has a total mass of equal to the sum of for the 5 clusters and 2 groups enclosed within a scale of 13 Mpc. The next structure, (2), is defined as the core and A1736, with a total mass of 4.3 within 28 Mpc. On a scale of 54 Mpc, structure (3), which contains the core, A1736, A3571 and the western extension (A3528–A3530–A3532), has a total mass is . Finally, the Supercluster as a whole, structure (4), extends to a scale of 88 Mpc, with a total mass of . Note that these mass estimates are highly conservative limits on the total mass in each cluster. No account has been made of the mass in the outer region of the clusters, where either the isothermal or the hydrostatic equilibrium assumption could fail. Extrapolating to (where the cluster reaches virialization), increases the masses by a median factor of 1.49 (in a range 1.40 – 1.93) with respect to , enlarging by the same factor the mass estimates for each of the 4 structures.
A different approach for estimating the expected mass in these structures, considered as self-gravitating systems, is to apply the Virial Theorem (Heisler et al 1985) on the clusters. As shown by Raychaudhury et al (1991), the region is retarded from the cosmic expansion through mutual attraction. Assuming the extreme condition that each part of the Supercluster is virialized, enables us to calculate the velocity dispersion as a measure of the gravitational energy; we obtain 395, 482, 1212 and 1121 km s-1, for the core, the structures (2), (3) and (4), respectively. The harmonic radius in each system is also determined, and gives Virial masses of 19, 35, 367, 400 , respectively. Again it appears that the core has enough gravitating mass to account for the Virial value, as does structure (2). For the structures (3) and (4), the Virial mass is about 5 times larger than the respective .
Adopting the value of as an estimate of the mass in the whole supercluster, we find a contribution of almost 30 km s-1 to the component towards the Shapley Supercluster optical dipole, which is around 520 km s-1 (Smoot et al 1991). This is less than 6 per cent of this total, in a flat Universe with , and requires an increase in the cosmological factor (i.e. a low density universe and/or higher Hubble constant) if it is to be more significant (cf. Quintana et al 1995).
| structure | Ncl | |||||||
|---|---|---|---|---|---|---|---|---|
| # | Mpc | |||||||
| (1) | 7+0+0 (7) | 13.4 | 35 | 87 | 19 | 7 | 4.05–11.47 | |
| (2) | 8+4+0 (12) | 27.8 | 43 | 104 | 35 | 62 | 0.66 | |
| (3) | 12+6+3 (21) | 54.2 | 74 | 167 | 367 | 463 | … | |
| (4) | 14+7+8 (29) | 88.0 | 85 | 186 | 400 | 1982 | … |
4.1 On the distribution of the baryonic matter
When we consider the sum of the stellar, gas and gravitating masses contributed by each cluster (cf. Table 3), then for each of the 4 structures we obtain a baryon fraction greater than and, in particular, almost 15 per cent within 28 Mpc. Although this result disagrees with the predicted range according to the relaxed constraint from the standard big–bang nucleosynthesis model adopted here (Fig. 5), it is approaching reasonable agreement with the low deterium abundance detection recently reported by Tytler et al (1996) of . To improve on the previous estimations of the baryon content for the Shapley core (cf. Fabian 1991, Makino & Suto 1993), we place tighter limits on the stellar contribution and avoid the use of any empirical relationship among the X-ray quantities by modelling each cluster separately.
So far we have neglected any contribution from an intrasupercluster medium (ISCM). If we consider the 1 limit on the diffuse X–ray surface brightness erg cm-2 s-1 ster-1 (from the GINGA Large Area Proportional Counter; Day et al 1991), we obtain a 1 upper limit on the ISCM mass, , of 0.5, 1.7, 3.6 and 5.0 for structures (1), (2), (3) and (4), respectively (using the thermal bremsstrahlung relation, , and a King model density distribution with a core radius , from structure (1), of 13 Mpc and a temperature of 1 keV). These estimates are between 1 and 6 per cent of the corresponding total gravitating mass, and between 11 and 52 per cent of the total gas mass observed in clusters. Given this result, if the detection of intrasupercluster gas were confirmed, the baryon catastrophe in these structures (i.e. on scale enclosed between 10 and 90 Mpc) would become more severe, increasing the gas component by a factor of 1.1–1.5. We note that GINGA cannot place limits on any plausible intergalactic medium of temperature much below 1 keV.
In Fig. 8, we show the dependence with radius, as measured in the different structures, of the baryon parameter, . This parameter, on scales where the overdensity produced by with respect to the background mass M is still important, retains information on both the baryon fraction and the overdensity . Hence, the large baryonic overdensity in the Shapley core indicates accumulation in a clearly defined potential well, whereas a deficiency is evident on a scale larger than 30 Mpc. It is difficult to accept that there has been accretion of baryons from the outer part to the supercluster core (the crossing time permits such motion on scales 10 Mpc). Thus, part of the observed relative deficit of baryons outside 30 Mpc could be due to the incomplete detection in the X-ray band of the total gas present. If we consider the median values observed in our sample of 6, for Mgrav, and 0.13, for fb, and a further contribution of a factor 1.5 on the total mass when extrapolated at , we are able to increase the values in Fig. 8 to 1.19, 0.23, 0.05 and 0.02 for structure (1), (2), (3) and (4), respectively.

4.2 On the cosmological consequences
In Table 3 the mass estimates in a homogeneous universe expected from eq. (2) are compared with the total masses extrapolated from the X–ray analysis. We note again that our mass estimates using are conservative, since we restricted the determinations to . A reliable extrapolation to gives an increase of 50 per cent to the cluster masses, and thus also to the structures we define. Here, we consider another way to constrain the total mass present in these structures, assuming that all the observed baryons correspond to the fraction expected from the primordial nucleosynthesis, i.e.
| (4) |
In other words, this is the gravitational mass associated with a baryonic mass for an abundance equal to in the structures defined above ( is calculated through observations of the gas and stellar matter, and the value for is assumed here to be 0.06, an average value of the 2 limits from Copi et al 1995 and within the 2- range provided by Tytler et al 1996). In Table 3 we quote for each structure, assuming . (Again, an extrapolation to increases by a factor ).
Using , and as reasonable mass estimates, we try to assess the probability of obtaining the density fluctuations related to the structures defined above. The initial distribution of these fluctuations is assumed to be Gaussian in an Einstein–de Sitter universe. Using a spherical collapse model (cf. Appendix A), the initial comoving radius of the sphere that contains at the present time the mass observed with overdensity within a comoving radius is given by: . The power observed on this scale , written with its dependence on (Peacock & Dodds 1994, eq. 41), is
| (5) |
where is the wavenumber in units of Mpc-1, is a step window function that averages out fluctuations on scales smaller than , and the functional form of is the CDM-like power spectrum described by Peacock & Dodds (1994), normalized to the averaged contribution of different classes of galaxy and galaxy clusters. It includes corrections for bias, non-linear evolution and redshift-space distortion effects and shows good agreement with the datasets and the COBE results on scales larger than 20 Mpc. The same results in the following discussion can be argued using a more physical CDM power spectrum, as approximated in the literature (see e.g. Bardeen et al 1986) with a normalization of Mpc), whereas a forced large-scale normalization to the COBE result gives lower values for the power by a factor 2, at least on the scales discussed below (cf. Peacock & Dodds 1994).
To compare the CDM-like power prediction with the overdensities observed in the Shapley region, we extrapolate from the non-linear overdensity to the corresponding present linear value (see for details Appendix A). Then, the probability that at some point a density fluctuation , with respect to the power on the same scale, exceeds the observed is given by:
| (6) |
where and .

Using the total mass , the core is the only structure with a very significant overdensity of at least 4.05 and a probability of per cent (i.e. 2.0 times , the r.m.s. power value). Using the overdensity upper limit value of 11.47 (from ), structure (1) increases its significance to per cent (3.2 times the corresponding r.m.s. power). These overdensities suggest that the core region is close to the turnaround point, where the perturbed region ceases to expand according to the Hubble flow and begins its collapse. The perturbation has evolved to its maximum expansion in Gyr (the age of the universe in the present scenario is 13 Gyr) and its collapsing period will last for almost 10 Gyr more, under the cosmological assumptions discussed above.
Structure (2) shows an overdensity of 0.66 within a radius of 28 Mpc from A3558, based on . This corresponds to a probability per cent (1.1 ) and indicates structure (2) as a system reaching the turnaround point in about 50 Gyr, before collapsing.
The dependence of and is linear, whereas is independent of it (i.e. only provides a value of the overdensity that does not depend upon any assumed cosmological model). Thus, in a low density universe (e.g. 0.3) the overdensities associated with increase considerably: in the core and in structure (2) is equal to 15.8 and 1.3, respectively, when measured with (cf. Table 4); structure (3) has an overdensity of 1.6, estimating it by . For , the qualitative description discussed above on the state of the evolution of the 4 structures is still valid, given the collapse condition that for (the corresponding condition for is ).
Neither structure (3) or (4) exhibits a significant density peak, when we use . Similar results can be obtained from the catalogue clusters counts (Zucca et al 1993, Vettolani et al 1990). They describe the Shapley concentration as the richest supercluster known, with an overdensity, with respect to the average density of ACO clusters, of within a region of 1.4 Mpc3 enclosing 25 clusters, to for the 9 clusters contained in the core (as defined by Vettolani et al 1990). This overdensity of counts can be translated in mass overdensities using the median value for calculated in our sample, obtaining values in agreement with our estimates as shown in Fig. 9.
We now return to the issue of the mass of each cluster and of the structures, which are underestimated. Reworking Table 4 using an extrapolation to , we find that the core is a 3.7 and 3.5 fluctuation for and 0.3, respectively, using . Only if does it become less than a 3 fluctuation. The 15 undetected clusters (within 90 Mpc) may provide a further contribution of the order of the observed , increasing by a factor 2 the lower limit on the overdensity (using the median value for of about 6 ). We emphasize that we are assuming the structures to have a spherical shape, which is unlikely for large scale collapsing structures (cf. Peebles 1993; see also the conclusion on a “cigar-like” shape of the Supercluster by Quintana et al 1995 and the recent evidence for a “bridge” in the distribution of galaxies between the core and the western extension; Bardelli, private communication).
| structure | |||||||
|---|---|---|---|---|---|---|---|
| # | Mpc | Mpc | Gyr | ||||
| Gyr | |||||||
| (1) | 13.4 | 11.47 | 29.7 | 1.29 | 0.41 | 9.7 | |
| (1) | 13.4 | 4.05 | 21.9 | 1.03 | 0.53 | 13.7 | |
| (2) | 27.8 | 0.66 | 31.4 | 0.44 | 0.39 | 49.4 | |
| Gyr | |||||||
| (1) | 13.4 | 15.83 | 32.8 | 1.33 | 0.45 | 13.9 | |
| (1) | 13.4 | 11.47 | 29.7 | 1.28 | 0.49 | 15.9 | |
5 CONCLUSION
From our analysis of 12 ACO clusters and 2 groups observed with the ROSAT PSPC and Einstein Observatory IPC, we have estimated the baryon and total gravitating mass distribution in the Shapley Supercluster. At a density contrast, with respect to the expected background matter, of 500 we find that the median baryon fraction observed in the individual clusters is . This is inconsistent with the standard nucleosynthesis model, unless or the low deuterium abundance is confirmed (from Tytler et al 1996, the 1- upper limit on is 0.120). Cluster to cluster, there are also a significant difference in . In the Shapley Supercluster region, we observe a baryon fraction of 15 per cent within 30 Mpc; a deficiency beyond this scale is probably due to an undetected warm intergalactic medium.
The gravitating masses , calculated as the sum of the cluster masses within various structures, range from 3.5 to 8.5 , which are lower than the minimum necessary to bind the structures (i.e. , for ; , for ) except the core (A3556, A3558, A3559, A3560, A3562, SC1327-312, SC1329-313). Applying the Virial theorem to the structure does not indicate masses equal the critical one . Then, on scales of 50 Mpc and larger, i.e. for structure (3) (core–west–A1736–A3571) and (4) (the whole supercluster), we compute a mass similar to that estimated in a different way by Fabian (1991) and Quintana et al (1995), i.e. . Assuming, from primordial nucleosynthesis, a baryon density parameter of 0.06, we expect a total mass of 0.9 in the core, increasing to 1.8 for the whole Supercluster. These indicate that either structures (3) and (4) are actually not bound by a factor of 3 and 10, respectively, or that we underestimate the total gravitating mass on scales larger than 30 Mpc (cf. Fig. 9).
We have used our cluster mass estimates (within ) to assess the probability that the various structures within the Shapley Supercluster arose from gaussian fluctuations in the primordial power spectrum. Adopting the CDM-like power spectrum of Peacock & Dodds (1994) and , we find that the supercluster core, which has an overdensity of between 4 and 11, is a fluctuation exceeding 3 which is approaching the turnaround point. If , which allows the baryon fraction in the clusters to equal that of the rest of the Universe, then the significance of the supercluster core approaches 3 with respect to the power expected on the same scale. These significance levels increase to 3.7 and 3.5 (for and 0.3, respectively) if the mass estimates are extrapolated to . If the significance of the fluctuations are required to be , then . Otherwise, non-gaussian fluctuations need to be considered, or the power spectrum normalization to be increased on supercluster scales.
Further data are needed to make this extrapolation with confidence, but the probabilities implied for the structures emphasize the remarkable nature of, at least, the core of the Shapley Supercluster.
ACKNOWLEDGEMENTS
We are grateful to Harald Ebeling for his IDL support and to the members of the IoA X-ray Group. It is a pleasure to thank our referee, Gianni Zamorani, who has improved this work with his suggestions. ACF acknowledges the support of the Royal Society and DAW that of PPARC. This research has made use of data obtained through the High Energy Astrophysics Science Archive Research Center Online Service, provided by the NASA-Goddard Space Flight Centre.
References
- [] Abell, G., Corwin, H.G. & Olowin, R., 1989, ApJS, 70, 1 (ACO)
- [] Bardeen, J.M., Bond, J.R., Kaiser, N. & Szalay, A.S., 1986, ApJ, 304, 15
- [] Bardelli, S., Zucca, E., Vettolani, G., Zamorani, G., Scaramella, R., Collins, C. & MacGillivray, H.T., 1994, MNRAS, 267, 665
- [] Bardelli, S., Zucca, E., Malizia, A., Zamorani, G., Scaramella, R. & Vettolani, G., 1995, A&A, 305, 435
- [] Bartelmann, M. & Steinmetz, M., 1996, MNRAS, 283, 431
- [] Beers, T.C., Geller, M. & Huchra, J.P., 1982, ApJ, 257, 23
- [] Breen, J., Raychaudhury, S., Forman, W. & Jones, C., 1994, ApJ, 424, 59
- [] Binney, J. & Tremaine, S., 1987, Galactic Dynamics, Princeton University Press
- [] Briel, U.G., Henry, J.P. & Böhringer, H., 1992, AA, 259, L31
- [] Carroll, S.M., Press, W.H. & Turner, E.L., 1992, ARAA, 30, 499
- [] Copi, C.J., Schramm, D.N. & Turner, M.S., 1995, Science, 267, 192
- [] David, L.P., Slyz, A., Jones, C., Forman, W. & Vrtilek, S.D., 1993, ApJ, 412, 479
- [] David, L.P., Jones, C. & Forman, W., 1995, ApJ, 445, 578
- [] Day, C.S.R., Fabian, A.C., Edge, A.C. & Raychaudhury, S., 1991, MNRAS, 252, 394
- [] Dressler, A. & Shectman, S.A., 1988, AJ, 95, 985
- [] Edge, A.C., Stewart, G.C., Fabian, A.C. & Arnaud, K.A., 1990, MNRAS, 245, 559
- [] Einasto, M., Einasto, J., Tago, E., Dalton, G.B. & Andernach, H., 1994, MNRAS, 269, 301
- [] Evrard, A.E., Metzler, C.A. & Navarro, J.F., 1996, ApJ, 469, 494
- [] Fabian, A.C., Hu, E.M., Cowie, L.L. & Grindlay, J., 1981, ApJ, 248, 47
- [] Fabian, A.C., 1991, MNRAS, 253, 29p
- [] Gunn, K.F. & Thomas, P.A., 1996, MNRAS, 281, 1133
- [] Hata, N., Steigman, G., Bludman, S. & Langacker, P., 1996, astro-ph/9603087
- [] Henry, J.P., Briel, U.G. & Nulsen, P.E.J., 1993, A&A, 271, 413
- [] Kaiser, N. & Davis, M., 1985, ApJ, 297, 365
- [] Klemola, A.R., 1969, AJ, 74, 804
- [] Lacey, C. & Cole, S., 1993, MNRAS, 262, 627
- [] Makino, N. & Suto, Y., 1993, PASJ, 45, L13
- [] Melnick, J. & Moles, M., 1987, Rev Mex AA, 14, 72
- [] Mo, H.J. & White, S.D.M., 1996, MNRAS, 282, 347
- [] Padmanabhan, T., 1993, Structure formation in the universe, Cambridge University Press
- [] Peacock, J.A. & Dodds, S.J., 1994, MNRAS, 267, 1020
- [] Peebles, P.J.E., 1980, The Large-Scale Structure of the Universe, Princeton University Press
- [] Peebles, P.J.E., 1993, Principles of Physical Cosmology, Princeton University Press
- [] Postman, M., Huchra, J.P. & Geller, M.J., 1992, ApJ, 384, 404
- [] Quintana, H., Ramirez, A., Melnick, J., Raychaudhury, S. & Slezak, E., 1995, AJ, 110, 463
- [] Raychaudhury, S., 1989, Nature, 342, 251
- [] Raychaudhury, S., Fabian, A.C., Edge, A.C., Jones, C. & Forman, W., 1991, MNRAS, 248, 101
- [] Scaramella, R., Baiesi-Pillastrini, G., Chincarini, G., Vettolani, G. & Zamorani, G., 1989, Nature, 338, 562
- [] Schechter, P., 1976, ApJ, 203, 297
- [] Schindler, S., 1996, AA, 305, 756
- [] Schramm, D.N. & Turner, M.S., 1996, Nature, 381, 193
- [] Shapley, H., 1930, Harvard Obs. Bull., 874, 9
- [] Snowden, S.L., McCammon, D., Burrows, D.N. & Mendenhall, J.A., 1994, ApJ, 424, 714
- [] Stark A.A. et al , 1992, ApJS, 79, 77
- [] Stewart, G.C., Fabian, A.C., Jones, C. & Forman, W., 1984, ApJ, 285, 1
- [] Tytler, D., Fan, X.M. & Burles, S., 1996, Nature, 381, 207
- [] Vettolani, G., Chincarini, G., Scaramella, R. & Zamorani, G., 1990, AJ, 99, 1709
- [] Voges. W. et al , 1996, AA, in press
- [] Walker, T.P., Steigman, G., Schramm, D.N., Olive, K.A. & Kang, H.S., 1991, ApJ, 376, 51
- [] White, D.A. & Fabian, A.C., 1995, MNRAS, 273, 72
- [] White, D.A., Jones, C. & Forman, W., 1996, MNRAS, submitted
- [] White, S.D.M. & Frenk, C.S., 1991, ApJ, 379, 52
- [] White, S.D.M., Navarro, J.F., Evrard, A.E. & Frenk, C.S., 1993, Nature, 366, 429
- [] Zabludoff, A.I., Huchra, J.P. & Geller, M.J., 1990, ApJS, 74, 1
- [] Zucca, E., Zamorani, G., Scaramella, R. & Vettolani, G., 1993, ApJ, 407, 470
Appendix A A recipe to extrapolate the linear overdensity when
In order to calculate the linear overdensity at the present time and compare it with the observed non-linear overdensity both in an open Friedman-Robertson-Walker universe and in an Einstein-de Sitter universe with cosmological constant equal to 0 and adopting a spherical collapse model, we refer to sections 11 and 19 of Peebles (1980, hereafter Pe), section 8 of Padmanabhan (1993, Pa) and appendix A in Lacey & Cole (1993, LC).
The collapsing region is described in the evolution of its physical radius during the time by the parametric equations
| (7) |
| (8) |
| (9) |
where will be ignored for a pure growing-mode perturbation (cf. Pa eq. 8.21).
In the case of , the combination of the 3 equations (A1-3) with the exact solution of the evolution of the background universe (cf. Pa eq. 8.23) and the extrapolated overdensity in the linear regime (i.e. small ) provides the evolution of a spherical overdense region (cf. Pa 8.32-34):
| (10) |
| (11) |
| (12) |
Of these quantities, the observable at present time are the non-linear overdensity and the comoving radius allowing the detemination analytically of and numerically of and . Their values are quoted in Table 4.
The case for is discussed by Pe and a useful summary is provided by LC. We present here the corresponding equations to (A4-6). In a open universe, the background with respect to a collapsing region that evolves according to (A1-3) is described by the parametric equations (cf. Pe eq. 19.12)
| (13) |
| (14) |
| (15) |
Applying the two conditions that we are comparing to a perturbated overdense region and a section of the background universe containing the same mass and following the same time , we obtain the relations
| (16) |
| (17) |
Then, following LC for extrapolation under linear conditions, we can write the linear overdensity as
| (18) |
Thus, a growing density contrast can be described using (A10-11) by
| (19) |
| (20) |
| (21) |
which represent the equations (A4-6) for . Furthermore, it can be shown that the approximation , i.e. , provided by Taylor expansion of the hyperbolic functions in (A13), gives the factor 9/2 as required for the case of a flat universe, i.e. (A4). To estimate the values quoted in Table 4, we calculate numerically at the present time , given and .
Finally, the time of maximum expansion (i.e. the turnaround point) can be estimated using (A5) and (A14), for and less than 1 respectively, with .