Abstract
Using the archival ROSAT PSPC observations, AB Dor is found to be variable in X-rays. The periodic variations are consistent with previously reported rotational period of 0d.514. The average spectrum of AB Dor is best represented with two-temperature Raymond-Smith model with kT values of 0.190.07 and 1.170.02 keV. The quiescent luminosity of the system is found to be 4.360.61030 ergs s-1. A flare with a rise time of 350 seconds is detected during which X-ray luminosity rises from 5.81.61030 to 15.84.91030 ergs s-1. We conclude that AB Dor is very similar to the active components of RS CVn binaries and other active classes. In view of the wide separation from the binary companion Rst 137B, this activity must be intrinsic to the active star.
Key words: Stars: activity, flare - Binaries: visual - X-rays: stars
Section 1 Introduction
AB Dor is a very active K type star in the southern hemisphere. From the proper motion and radial velocity measurements, its distance is estimated to be 277 pc (Collier Cameron et al., 1988) so that it is a foreground star in LMC region. The star was classified as an RS CVn type binary by Pakull(1981) because of its photometric variability. AB Dor is a member of a wide visual binary system with its companion Rst 137B, a dMe type 13.6 magnitude star. Both stars have common proper motions and radial velocities. Thus they are probably the members of the Local Association Pleiades moving group (Vilhu et al., 1993). The wide separation of the binary makes AB Dor an interesting candidate for comparison with active close binaries, as the activity must arise from the dynamics of the single star. AB Dor is a rapidly rotating star. From the broadening of absorption lines (Collier, 1982), its equatorial velocity is found to be 705 km s-1. Because of its relative proximity and brightness (V=6.8 mag), AB Dor has been observed photometrically by various observers (Pakull, 1981; Rucinski, 1983; Innis et al., 1988; Banks et al., 1991; Jetsu et al., 1990; Rucinski et al., 1995). In a photometric history study by Innis et al.(1988) which shows compiled light curves between 1978 and 1987, the rapid changes in the shape and range of light curves have been noted. Light curves of AB Dor show significant changes even in time intervals as short as only a few rotational periods of the star thus making it difficult to combine the photometric data taken a few months apart to obtain a consistent light curve. These changes are thought to originate from the rapid rearrangements of spotted areas (Jetsu et al., 1990).
During an X-ray survey of the Large Magellanic Cloud with the imaging X-ray telescope of the Einstein Observatory, AB Dor was identified to be one of the brightest X-ray point sources in the foreground region in 0.15-4.5 KeV band (Long et al., 1981). A subsequent three hour observation has revealed clear indications of variability. A flare of two-hour duration, with nearly five-fold increase in the x-ray flare count rate, has been detected with the Einstein Observatory (Pakull, 1981). AB Dor was also observed by low and medium energy detectors of EXOSAT spacecraft in late 1984 and early 1986. In each observation covering nearly one rotational period of the star, X-ray flares with long rise times () were detected (Collier Cameron et al., 1988). From the long rise times of the observed X-ray flares, it was suggested that the flares occurred in loop structures of several stellar radii. In 1990, AB Dor was observed by Large Area Counter Instrument of the GINGA satellite (Vilhu et al., 1993). During the period covering nearly five stellar rotations of the star, four flares were detected. Mean flare energies were found to be ergs with peak luminosities of ergs s-1. The flare spectra were seen to be best-fitted by thermal Bremsstrahlung model with kT 4.6 keV. Due to the low sensitivity of the instrument no clear modulation at the 0d.514 rotation period was reported in the X-ray light curve. Molonglo Observatory Synthesis Telescope (MOST) observations of AB Dor since 1985 have revealed a quiescent level of radio emission with occasional flare-like increases in the 843 MHz band (Beasley et al., 1993). AB Dor is thoroughly investigated in a multi-wavelength campaign in 1994. A summary of ROSAT observations of AB Dor is presented in the International Conference on X-ray Astronomy and Astrophysics held in Wuerzburg (Kuerster et al, 1995)
In this work we examine the X-ray modulation and flaring structure of AB Dor with archival ROSAT Position Sensitive Proportional Counter(PSPC) data. In section 2 observations are summarized. In Section 3 X-ray spectra are discussed, modulation at the 0d.514 period is examined and folded light curves are given. Behavior of X-ray flares is also studied in this Section. A general discussion of X-ray behavior of the star is given in section 4.
Section 2 Observations
AB Dor was observed with the PSPC at the focus of the X-ray telescope of ROSAT.The PSPC is a gas filled proportional counter sensitive over the energy range 0.1-2.4 keV with an energy resolution E/E0.43 at 0.93 keV. Detailed descriptions of the satellite, X-ray mirrors, and detectors can be obtained in Trümper (1983) and Pfeffermann et al. (1986). The X-ray observations reported here were obtained during a time span of 2.7 years between Oct 28th, 1991 (JD 2448557.5) and Nov 3rd, 1993 (JD 2449294.5) with a total effective exposure time of 76210 sec. The journal of the observations is given in Table I.
| Obs. | Obs. Date | Eff. Exp. |
|---|---|---|
| (JD) | Time(s) | |
| 1 | 2448322.376414002 - 2448322.387212612 | 933 |
| 2 | 2448382.727635410 - 2448382.746524297 | 1632 |
| 3 | 2448558.053777050 - 2448564.042676994 | 45995 |
| 4 | 2448832.757550988 - 2448832.831312557 | 1263 |
| 5 | 2448862.506680543 - 2448862.522976838 | 1408 |
| 6 | 2448893.285972074 - 2448894.235462740 | 3430 |
| 7 | 2448923.594187312 - 2448923.605807682 | 1004 |
| 8 | 2448954.529682676 - 2448954.541407212 | 620 |
| 9 | 2448954.595226652 - 2448954.610284522 | 1301 |
| 10 | 2448984.068661906 - 2448984.211485968 | 2122 |
| 11 | 2449014.737230558 - 2449014.753341668 | 1392 |
| 12 | 2449044.272980702 - 2449044.284716812 | 1014 |
| 13 | 2449075.137226107 - 2449075.211253880 | 1369 |
| 14 | 2449104.733902202 - 2449104.749909145 | 1383 |
| 15 | 2449135.692557362 - 2449135.925948549 | 1891 |
| 16 | 2449165.298955668 - 2449165.460830656 | 2122 |
| 17 | 2449196.169694188 - 2449196.184011316 | 1237 |
| 18 | 2449225.694865734 - 2449225.741682861 | 989 |
| 19 | 2449256.684203886 - 2449256.734944623 | 1466 |
| 20 | 2449286.306991192 - 2449286.608171726 | 3639 |
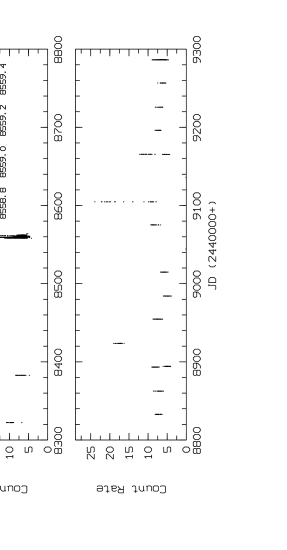
The third observation in the Table I was obtained during an observation of the Large Magellanic Cloud and covers 6 days with an effective exposure time of 45995 sec. Observation 14 in the list is a flare observation with a clear time history and observation 8 is another possible flare but its time history was not followed. The analysis of the ROSAT archival data has been performed with the EXSAS package (Zimmermann et al., 1993). The AB Dor source counts were extracted from a circle of radius which is expected to include of the photons from the source, according to the point spread function of the PSPC. The background was determined from a source free annular ring of radius . The mean background subtracted, vignetting and deadtime corrected count rate for the whole observation was 7.51.5 counts s-1. The total light curve of the source is given in Figure 1.
Section 3 Results
3.1 X-Ray Spectra
The large number of counts obtained from AB Dor allow spectral fits for various spectral models.
We mainly concentrated on spectral models for thermal plasma: Raymond-Smith thin plasma, or RS model (Raymond & Smith, 1977) and Mewe-Kaastra, or ”meka” model (Mewe, Gronenschild, & van den Oord ,1985; Kaastra, 1992). Spectral fits carried out by using EXSAS and XSPEC packages have yielded similar results. Single component models failed to represent the observed spectra; hence we tried two-temperature RS and ”meka”models . The input spectra is compiled from the long observation 3 in Table I. Count rate of the source was seen to be highly variable. For this reason, individual spectral fits of the intervals with high count rate and low count rate were obtained separately. In this section we discuss the spectra for the low count rate (quiescent) intervals. Total integration time for the compiled quiescent spectra is 20000 sec. Although residuals due to some lines in the fitted spectrum can be reduced by using RS variable abundance mode, RS quick mode is used in the analysis because of low energy resolution of ROSAT PSPC. The two-temperature ”meka” does not give acceptable values. The results of spectral fits are shown in Table II.
| Model | NH | (A1/A2)a | kT1/kT2 | |
|---|---|---|---|---|
| cm-2 | KeV | |||
| ”meka” | 1.330.09 | 7.090.12 | 0.17 | 7.90 |
| 1.970.27 | 0.870.08 | |||
| RS | 2.300.69 | 6.830.53 | 0.190.07 | 1.78 |
| 1.470.13 | 1.170.02 |
a A1 and A2 are the normalization coefficients,
10-14EM/(4D2)
where D is the source distance and EM is the emission measure,
in units of cm-5.
b Values of reduced for 34 degrees of freedom.
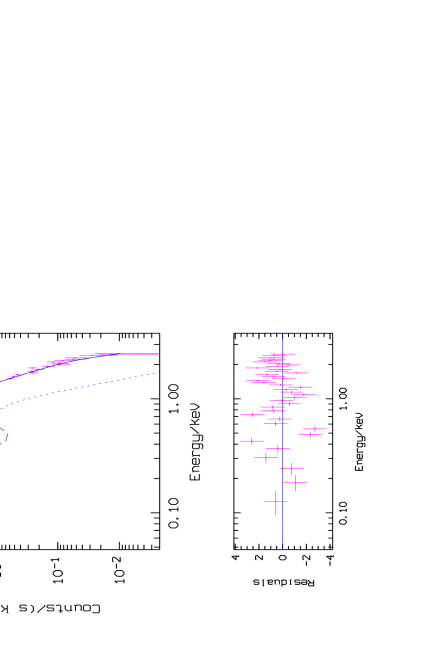
Figure 2 shows the best fit RS model to a typical low-count rate (quiescent) section. The time averaged quiescent luminosity is found to be 4.36 ergs s-1.
3.2 Rotational Modulation of X-ray Count Rates
In order to examine whether the X-ray light curve exhibits a periodic behavior similar to the optical light curves, the X-ray light curve is folded by the optical rotational period of 0d.51479 using the ephemeris given by Innis et al., 1988. The longest continuous observation of the source is the third observation in Table I, between JD 2448558 and JD 2448562, covering nearly 8 stellar rotations and hence dominates the whole data. Folding procedures are applied to this continuous part of the data and to the rest separately in order to delineate the effects of phase drifts. Variability in count rate with rotational phase is clearly seen in the continuous part of the observation in the upper panel of Figure 3.
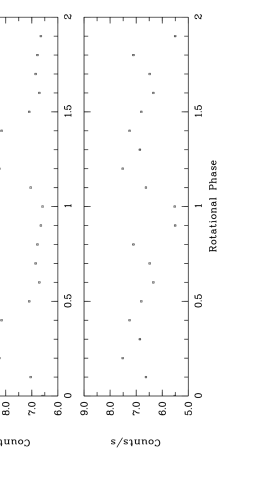
The X-ray count rate is modulated at about 23 level around the mean count rate of 7.5 counts s-1. The count rate changes smoothly between the phases 0.0 and 0.5, and after phase 0.5 the count rate remains almost constant within error limits. Due to the large number of photons from the source the errors on the phase bins are very small. On the other hand, a similar behavior does not exist in the rest of the data which is unevenly sampled covering 2.7 years (Figure 3, lower panel). A subtler variability seen might be the result of the fact that although the total time span of the observation is as long as 2.7 years, the effective exposure time for this part of the data is only 30000 seconds distributed in many windows in the 2.7 years, smearing out the basic modulation at 0d.514.
3.3 X-ray flares
In the light curve covering nearly a time span of 2.7 years, a few probable X-ray flares were detected. The time evolution of the flare can be traced clearly in only one flare. We concentrate on this single flare whose rise time is approximately 350 seconds. A steep rise in the flux is followed by a rather gentle, slow decline (Figure 4 upper panel).
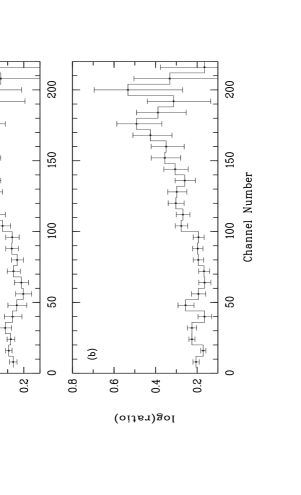
The decline could not be fully observed, but continued for at least 300 seconds, till the end of the exposure. In the flare the count rate increases almost three-fold (from 9 to 24 counts s-1). The phase of the flare is about 0.06 following the ephemeris given by Innis et al. (1988). To examine the changes in spectra during the flare, the ratio of flare to quiescent photons is computed as a function of time. A quiescent spectrum is compiled from the first 500 seconds of the observation prior to the flare. It is seen that the counts in channels at larger energy (channel numbers larger than 100) increase during the flare by a factor of 4 and an increase of 2 fold on the lower channels is also evident (Figure 5).
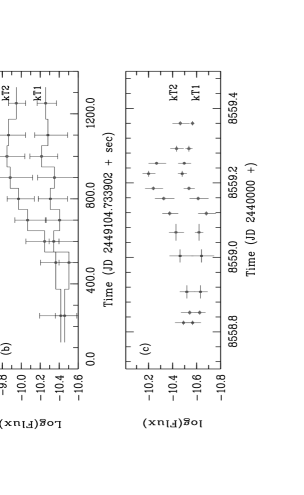
The flare is best-fitted by a two-component Raymond-Smith model. The time evolutions of the two fit fluxes are given in Figure 4 middle panel. The low energy component (changes between kT=0.16-0.24 keV) can be seen to increase very slowly whereas the increase in high energy component (kT=1.25-2.34 keV) is much more pronounced. No decline can be observed for either component within error limits after the peak of the flare is reached.
A sample segment from the light curve of observation 3 showing the transition from low to high count rate is given in the inset of Figure 1. The section covers a time span of 50000 seconds, from JD 2448558.8 to JD 2448559.4 and the maximum count rate coincides with phase 0.36 according to the ephemeris given by Innis et al. (1988). The rise time from low count rate to the peak is approximately 15000 seconds and a similar decline time is also observed. The time structure of the flux obtained by the two-component Raymond-Smith model is shown in the lower panel of Figure 4. Although the change in the count rate is about two fold as it is seen from Figure 1, the timestructure of the components with energies of kT1 and kT2 show similarities with the flare event discussed above. The high energy component in this case shows a constant slow increase well before the increase in the count rate whereas the low energy component follows the count rate on rise. After the maximum count rate is reached, the high energy component follows the count rate on decline, whereas the low energy component declines rather slowly.
Section 4 Discussion
AB Dor is a wide visual binary with an active dMe type dwarf secondary Rst 137B (Vilhu & Linsky, 1987; Vilhu et al., 1989). The angular separation between companion stars is quite large (10 arcsec. at a distance of nearly 27 parsecs) and the orbital velocity changes of AB Dor is limited to 2 km s-1 (Vilhu et al., 1993). Although angular resolution of ROSAT PSPC is better than EXOSAT and GINGA, and both AB Dor and Rst 137B are in the field of view, it is still impossible to resolve the companions with PSPC, during the observations. The expected X-ray flare peak luminosities from dMe stars is around 1028-30 erg s-1 (van den Oord et al., 1988), substantially less than the quiescent X-ray luminosity, 4.361030 ergs s-1 mentioned above. Therefore, contamination due to Rst 137B likely to be extremely small and its effect can be neglected. The average spectrum of AB Dor, compiled from the quiescent (or the low count rate) regions, reveals two distinct regions with temperatures kT1=0.19 keV and kT2=1.17 keV. Column density in 0.1-2.4 keV band is calculated as NH=2.30 cm-2. This value is higher than 1018 cm-2 which is an assumed value used in spectral fits to EXOSAT data (Collier Cameron et al., 1988).
In the X-ray band, several flares have been obseved by Einstein (Vilhu & Linsky, 1987), EXOSAT (Collier Cameron et al., 1988) and GINGA (Vilhu et al., 1993). The flare detected in ROSAT data has about 350 seconds of rise time, which is much shorter than the rise time of the flares observed by EXOSAT but comparable to the flares observed by GINGA. The total luminosity changes from about 5.81.6 ergs s-1 at the pre-flare phase to 15.84.9 ergs s-1 at the flare peak. The average peak luminosities of EXOSAT and GINGA flares are (4-8) ergs s-1 and (4-6) ergs s-1 respectively within an energy range of 2-10 keV. While a direct comparison of flare luminosities is not possible since the energy range of ROSAT PSPC is 0.1-2.4 keV and both EXOSAT(ME) and GINGA are sensitive to an energy range of about 2-10 keV, it can be inferred that AB Dor flares must be soft in character, with most of the luminosity below 2 keV. It seems that the flare develops first with relatively high energy photons. During the flare development the low energy photon flux keeps increasing while the high energy photon flux reaches to a maximum value. The initial phase of the flare may be due to the breaking of magnetic loops which deposit their energy to a limited volume giving rise to the initial high energy photon flux. As the energy deposited is dissipated in the medium an increase in low energy photons follows. This is characteristic of the thermal structure of the coronal plasma observed during the flares as observed for the solar corona (Sylwester, 1990). The higher temperature or hot component is present only during the flares whereas the lower temperature or quasi-hot component might arise from the background emission within the active region.
A similar lead of high energy photons, followed by low energy photons may be present in the observation of the rotational variability. As seen from the lower panel of Figure 4, both low and high energy photons are present during the rotational time history of AB Dor. On the active region of the surface of the Star, several small size flares may be present giving rise to production of low and high energy photons. But the contributions of these small size flares or activity is integrated to a more gradual increase in count rate, producing the observed rotational periodicity in X-rays (Figure 3). The GINGA light curve has been folded by the same period and it has been seen that although a broad peak is observed around phases 0.5-0.6, all the variability seen was at the 1 level (Vilhu et al., 1993). Figure 4 lower panel also shows that the increase in high energy flux precedes that in the low energy flux. Duration of the high count rate phases indicate that for that particular observation time the size of the active region on the star surface can be as large as of the total surface area. The rise times for the count rate increase in turn may be as large as 8000 seconds. Hence, the ”flares” with rise times 6000 seconds as observed by EXOSAT and GINGA in our view represents segments of the X-ray light curve corresponding to the passage of the active region of the stellar surface of AB Dor through the line of sight. A true flare event is an individually distinguished event with much smaller rise times, 100-1500 s, as depicted in GINGA data as well as the ROSAT data analyzed here. ROSAT flare at phase 0.06 seems to obey the clustering trend of AB Dor flares around phases 0.1-0.25 suggested by Vilhu et al., (1993) for the GINGA data. The two cool spots on the stellar surface, proposed by Innis et al. (1988), are mostly visible around the phases 0.0 and 0.5. Both small and large sized X-ray flares from the corona are most likely linked with the same photospheric regions.
We note that AB Dor is similar to RS CVn binaries and other active classes in many respects. Chromospherically active binaries with F and later spectral classes are known to have X-ray luminisities typically of the order of ergs s-1 (Pasquini et al., 1989, Dempsey et al., 1993) which is comparable to the X-ray luminosity of AB Dor. Additionally, flare rise times and the peak luminosities of AB Dor and other active classes are comparable. The rise times are 180 and 1000 seconds and peak flare luminosities are 9.4 and ergs s-1 for the RS CVn binaries CrB and HR1099 respectively. While the properties of AB Dor discussed above are typical of the active component of RS CVn binaries, it is very different from the typical RS CVn binaries in that it is practically a single star, being the active component of an extremely detached binary system ( 250 A.U. at at distance of 27 pc giving rise to a period of 3000 years in contrast to RS CVn binaries having periods 100 days.) The high level of X-ray activity of AB Dor can not be attributed to any influence from its companion. Hence the X-ray activity at the level observed in AB Dor should be intrinsic to the active star. The source of the activity is probably linked to the high equatorial rotation rate of AB Dor and thus does not require tidal maintenance in a binary. We note that in the ROSAT survey of RS CVn binaries Dempsey et al. (1993), it was found that X-ray activity is not correlated with binary parameters implying that the secondary does not affect the activity level.
Section 5 Acknowledgements
We thank Hakkı Ögelman for his valuable suggetions, comments and discussion. This work is supported by The Scientific and Technical Research Council of Turkey, under High Energy Astrophysics Unit.
References
- Banks T., Kilmartin P.M.,and Budding E. 1991, Astronomy and Astrophysics, Supplement Series 183, 139
- Beasley A.J.,and Cram L.E. 1993, Monthly Notices of the RAS 264, 570
- Collier A.C. 1982, Monthly Notices of the RAS 200,489
- Collier Cameron A., Bedford D.K., Rucinski S.M., Vilhu O., White N.E. 1988, Monthly Notices of the RAS 231, 131
- Dempsey R. C., Linsky J. L. Fleming T. A. et al., 1993, Astrophysical Journal, Supplement Series 86, 599
- Innis J.L., Thompson K., Coates D.W., and Lloyd E.T., 1988, Monthly Notices of the RAS 235, 1411
- Jetsu L., Vilhu O., and la Dous C. 1990, Astrophysical Journal, Supplement Series 85, 1127
- Kaastra, J.S. 1992, An X-ray Spectral Code for Optically Thin Plasmas (SRON-Leiden Report, Updated version 2.0)
- Kuerster, M. 1995, To be published in the Proceedings in the International Conference on X-ray Astronomy and Astrophysics in Wuerzburg
- Long K.S., Helfand D.J., and Grabelsky D.A. 1981, Astrophysical Journal 248, 925
- Mewe, R., Gronenschild, E.H.B.M., and van den Oord, G.H.J. 1985, Astronomy and Astrophysics 62, 197
- Pakull M.W. 1981, Astronomy and Astrophysics 104,33
- Pasquini L., Schmitt J. H. M. M., Pallavicini R., 1989, Astronomy and Astrophysics 226, 225
- Pfefferman E. et al. 1986, SPIE 733, 519
- Raymod, J.C. and Smith, B.W 1978,Astrophysical Journal, Supplement Series 35, 419
- Rucinski S.M. 1983, Astronomy and Astrophysics 52, 281
- Rucinski S.M., Garrison R.F., and Duffee B. 1995, IBVS 4156
- Sylwester J., 1990, in The Dynamic Sun, proc. EPS 6th European Solar Meeting, Pub. Dedrecen Heliphysical Obs., 7, 212
- Trümper J. 1983, Adv. Spa. Res. 2, 241
- Vilhu O., Tsuru T., Collier Cameron A., et al. 1993, Astronomy and Astrophysics 278, 467
- Vilhu O., Linsky, J. L., 1987, Publications of the ASP, 99, 1071
- Vilhu O., Ambruster J. W., Neff J.E. et al., 1989, Astronomy and Astrophysics 22,179
- van den Oord G. H. J., Mewe R., Brinkman, A. C., 1988, Astronomy and Astrophysics 205, 181
- Zimmermann U. et al. 1986, MPE Report 244