Thick tori around AGN: the case for extended tori and consequences for their X–ray and IR emission
Abstract
Two families of models of dusty tori in AGNs (moderately thick and extended versus very thick and compact) are tested against available observations. The confrontation suggests that the former class better explains the IR broad–band spectra of both broad and narrow line AGNs, the anisotropy of the emission deduced by comparing IR properties of Seyfert 1 and 2 nuclei, the results of IR spectroscopy and those of high spatial resolution observations. There is however clear evidence for a broad distribution of optical depths. We also examine the relationship between IR and X–ray emission. The data support a view in which the matter responsible for the X–ray absorption is mostly dust free, lying inside the dust sublimation radius. The consequences of these results for the hard X–ray background as well as IR counts and background are discussed.
1 Introduction
Direct and indirect evidence of obscuring material around Active Galactic Nuclei (AGN) has been accumulated. High spatial resolution observations of emission from molecules and dust show that enriched gas is abundant around AGN on scales ranging from a fraction of parsec (see e.g. Miyoshi et al. 1995; Greenhill et al. 1995) to many tens of parsec (see e.g. Braatz et al. 1993; Jackson et al. 1993; Cameron et al. 1993; Tacconi et al. 1994; Genzel et al. 1995).
These results strongly support unified schemes of AGN, according to which the distinction of AGN in broad and narrow line objects is mainly due to orientation of circumnuclear dust structures. These schemes have been originally invoked to explain the results of spectropolarimetric observations, namely that NGC 1068 (the prototype of Seyfert 2 galaxies) and several additional narrow line AGN show broad line components in their spectra (see Antonucci 1993 for a comprehensive review). Direct view of the Broad Line Region (BLR) is blocked by an optically thick structure. The broad lines detected with spectropolarimetry are the result of the scattering into the line of sight of the radiation from the BLR by free electrons and/or dust particles above the nucleus. Moreover, in some optically narrow line AGN, broad lines have been detected with spectroscopy in the near–IR, where the absorption is less effective than in the optical bands (Rix et al. 1990; Ruiz, Rieke and Schmidt 1994; Goodrich, Veilleux and Hill 1994).
X–ray spectra of narrow line AGN exhibit absorption significantly larger than type 1 AGN, providing strong support for the obscuring hypothesis (see e.g. Nandra and Pounds 1994; Smith and Done 1996).
The anisotropy of the nuclear radiation (expected to be collimated in a cone with apex in the nucleus and opening angle determined by the absorbing structure) has been confirmed by images of emission lines of [O III], [N II], and other elements for a significant number of narrow line AGN (see Wilson 1996 for a review ) which show conical regions of high excitation emission–line extending from the active nuclei.
More recently, the presence of obscuring tori has been also invoked to explain the difference between narrow– and broad–line radiogalaxies (Barthel 1989). In this context the failed detection of CO J=1–0 absorption from Cygnus A was embarrassing (Barvainis and Antonucci 1994). However there are explanations which allow to keep the presence of a dusty and molecular torus. In particular, Maloney, Begelman and Rees (1994) showed that the nonthermal radio continuum may increase the excitation temperature of the lower rotational level thus reducing the optical depth. Therefore the lack of CO absorption may be a general property of the radio galaxies. Also photo–dissociation, ionization and heating by X-ray tend to decrease the CO absorption optical depth.
The energy absorbed by the obscuring structure must be reradiated in the infrared. IR broad–band spectra of nuclei of Seyfert galaxies can be fitted by models in which a significant fraction of the nuclear emission is reprocessed by an axisymmetric torus–like structure (Pier & Krolik 1992, 1993; Granato & Danese 1994; Efstathiou & Rowan-Robinson 1994). On the contrary non thermal emission mechanisms are not able to reproduce the extremely steep decline of the continuum observed between 100 and 1000 m (Hughes et al. 1993).
X–ray emission may also be affected by the presence of dusty molecular tori around the active nuclei. Madau, Ghisellini & Fabian (1993) and Krolik, Madau & Zycki (1994) have computed X–ray spectra emerging from nuclear region along directions with significant Thomson optical depths. Scattering and absorption significantly modify intrinsic spectra, yielding spectral shapes suitable to reproduce the 2–100 keV X–ray Background as integrated emission from partially covered AGN (Madau et al. 1993; Comastri et al. 1995).
The absorbing structures around the active nuclei have usually been modelled as axial symmetric tori (Pier & Krolik 1992, 1993; Granato & Danese 1994; Efstathiou & Rowan–Robinson 1994), though different geometries, like warped discs, have also been suggested (Sanders et al. 1989). Models proposed by Pier & Krolik (1992, 1993) are characterized by extremely large optical thickness ( in the UV, which entails at 10m and Thomson optical depth ) and compactness (radial dimension a few pc). By converse models proposed by Granato & Danese (1994) are based on tori with optical depths in the UV band ranging from 10 to 300 and with maximum radii ranging from tens to hundreds pc.
In Section 2 the two families of models (moderately thick and extended versus very thick and compact) are tested against observational information: IR broad–band spectra (Sect. 2.1) and its anisotropy (Sect. 2.2), IR spectroscopy (Sect. 2.3) and high spatial resolution observations (Sect. 2.4). In Section 3 we examine the links between IR and X–ray emission and we show that the data support the view that the matter responsible for most of the X–ray absorption is dust free and lies inside the dust sublimation radius. The consequences of these results for the hard X–ray background as well as IR counts and background are then discussed in Section 4), where we estimate in particular the dusty AGN counts in the IR bands relevant to ISO. The final Section is devoted to summarize our conclusions.
A Hubble constant and a deceleration parameter have been assumed whenever necessary.
2 Extended and compact tori and confrontation with the data
As mentioned above, extended models have been investigated by Granato and Danese (1994) (GD hereafter) and by Efstathiou and Rowan–Robinson (1994), while compact and extremely thick models ( and correspondengly ) have been investigated by Pier and Krolik (1992, 1993) (PK hereafter).
GD discussed a numerical code which solves the radiative transfer equation in a circumnuclear dust distribution. This step is required since in the tori predicted by unified models the dust emission is self–absorbed at least in the near– and mid–IR. The code is quite flexible concerning the geometry and composition of the dusty medium, the only restriction being axial simmetry, and thus allows a wide exploration of the parameter space, including both classes of models under discussion.
In the computations a standard galactic dust composition is assumed. The inner radius of the dust distribution is set by the grain sublimation condition, above for graphite and for silicates. This translates into pc, where is the luminosity of the primary optical–UV emitter in units of erg .
The details of the model, as well as the effect of various free parameters, have been already discussed by GD. In this paper we wish to focus mainly on the radial extension of the dust distribution, measured by the ratio between the outer and inner radii , and on the absorption along typical obscured directions. In Fig. 1 we report representative SEDs predicted by our code for a broad range of . The average SED of the GD Seyfert 1 sample requires values for of several hundreds and . Roughly speaking, the first parameter is related to the broadness of the IR bump arising from dust reprocessing, whilst the latter controls mainly the near-IR slope of the SEDs as observed from obscured directions as well as its anisotropy. Therefore is in principle constrained by the SEDs of obscured AGNs (Sect. 2.1) or by testing the anisotropy of mid–IR emission (Sect. 2.2)
2.1 IR broad band spectra
In Fig. 2 we present a good fit to the overall IR spectrum of NGC 1068, obtained with an extended and moderately thick torus characterized by an optical thickness smoothly dependent on the line of sight. In this model we used along the line of sight, while the absorption is in the equatorial plane. Assuming a distance Mpc, the required primary optical–UV luminosity is erg/s, in nice agreement with the value obtained by UV spectropolarimetry with HST (Antonucci et al. 1994). The total dust mass involved is , consistent with the estimates of gas masses () coming from CO observations. Though it is possible to obtain similar fits with different combinations of the free parameters and/or dust density laws, the extension and the optical depth, particularly along the line of sight, are reasonably well constrained to and .
The information on IR nuclear spectra of Seyfert 2 galaxies other than NGC 1068 remains rather scanty. Attempts of evaluating near IR nuclear fluxes are hampered by low fluxes of the nuclei with respect to the host galaxies. Moreover, data on the IR spectra of the nuclear regions have been collected through observations at various frequencies with significantly different spatial resolution. As a consequence, we must be cautious when referring to data collections as “nuclear SEDs”. Actually, only in a few cases of nearby Seyferts the data have angular resolution good enough to allow an estimate of the nuclear fluxes. Therefore here we restrict ourselves to objects within a distance of 50 Mpc, where an angle of 2 arcsec subtends about 0.5 Kpc.
Nine out of these galaxies have been observed within a small aperture both in the near–IR () as well as at 10.6 m () and clearly detected. In Table 1 we report the ratio between the L and the N bands emission for these narrow–line objects. In Fig. 3 the same ratios, predicted by the GD models, are plotted as a function of the optical thickness and for two values of . It is clear that the observed IR spectral slopes imply optical depths along the line of sight . Although the sample is not a fair one and the data are likely to be affected by contributions from contaminating components, the result suggests that, at least for nearby objects, the optical depths are broadly distributed but never huge, far below the value corresponding to Thomson thick matter with a standard dust to gas ratio. It is apparent from Fig. 3 that would correspond to a ratio of the near-IR to mid–IR emission a factor lower than found in our sample.
A large spread of the optical depths, possibly associated with a dependence on the luminosity, has been invoked to reconcile the predictions of unified models to the observed statistics (Lawrence 1991). As noted by Granato, Danese and Franceschini (1996), typical IR SEDs of high-luminosity UVX QSOs are fitted by assuming reprocessing by dusty tori with equatorial optical thickness 310, while for Seyfert 1 galaxies the equatorial optical depths are found in the range 560. However the equatorial optical depths of Type 1 objects are weakly constrained by the available IR and optical data.
This might suggest an anticorrelation of the typical optical depths and of the covering factors with luminosities, although significant ranges of thickness and of covering factor are present at all luminosities. However Granato et al. (1996) showed that the SEDs of hyperluminous IR high redshift objects and the Cloverleaf, a BAL QSO, can be fitted under the assumption that the emission is powered by an active nucleus surrounded by a torus with large equatorial optical depths 60300. This cleary breaks down the trend for a decreasing optical depth with increasing luminosity, but may well be linked to a transient phase when a young nucleus is wrapped in the gas of a young galaxy (Granato et al. 1996).
In summary, only a large range of optical depths can explain the observed IR spectra of narrow and broad lined AGN. There is no evidence in these data for circumnuclear tori with extremely large optical depths ().
2.2 Anisotropy of near- and mid-IR emission
Heckman (1995), Maiolino et al. (1995) and Giuricin et al. (1995) have examined the mid–IR emission of Seyfert 1 and 2 galaxies. Although the analyses were performed with different methods a general consensus emerged that narrow–line (Seyfert 2) nuclei are weaker emitters than broad–line (Sey 1) nuclei. This may be interpreted as anisotropy resulting from the presence of the obscuring torus.
In particular Heckman (1995) showed that the average ratio of 10.6 m flux (within small aperture) to radio continuum at 1.4 GHz is about 4 times larger in Seyfert 1 than in type 2 Seyferts. Assuming that the radio emission is indicative of the nuclear power, he concluded that the putative torus is only mildly anisotropic. Since the data used by Heckman are rather heterogeneous, the basic assumption may be not completely safe. Actually Giuricin, Fadda & Mezzetti (1996) found that the total radio fluxes of Seyfert galaxies correlate with the radio core fluxes, but the total fluxes are about a factor 6 larger. Moreover the ratio may be influenced by higher level of star formation in Sey 2 hosts (Maiolino et al. 1995), which entails an enhanced radio emission.
On the other hand Heckman (1995) also examined the ratio of 10.6 m emission to the flux in the [OIII] 5007 emission line. The average 10.6 m emission, normalized to [OIII] flux, of Sey 1s is larger than that of Sey 2s by a factor of 2. Although in this case the result may be affected by absorption and by possible bias in favour of small opening angles for Sey 2s, nevertheless we can conclude that the luminosity at 10m is higher by a factor ranging from 2 to 4 in Sey 1s respect to Sey 2s with the same nuclear luminosity.
The samples examined by Heckman (1995), namely the RMS sample (Rush et al. 1993), the CfA sample (Huchra & Burg 1992), and a far-IR selected sample all exhibit the same difference between Seyfert 1s and 2s.
For 8 Sey 2s and 9 Sey 1 of the RSA sample, which can be thought as a volume limited sample, 10m fluxes taken within small aperture as well as radio and [OIII] fluxes are available. Although this is a small subsample, nevertheless the analysis confirms that the 10m luminosity of the Sey 1s is only a factor 2–4 higher than that of Sey 2s with the same nuclear luminosity.
As it is apparent from Fig. 4, the extended model predicts that Sey 1s are stronger emitters at 10 m than Sey 2s by an average factor 2-4, provided that the average absorption along the line of sight falls in the range , in full agreement with the fits to available spectral data (see Sect. 2.1 above). Also figure 4 shows that would imply an anisotropy 8–10 times larger than that observed in the analysed samples. The angle between the torus axis and line of sight toward the nucleus is expected to be randomly distributed in the RSA sample and in the CfA sample, though in the latter some bias against very faint nuclei may be present, affecting the randomness of the inclination. For a random distribution half of the nuclei should be seen with an inclination , much larger than the average half opening angle inferred from the ionization cones . Therefore for a significant fraction of Sey 2s of the RSA and CfA samples the line of sight is expected to lie quite close to the equatorial plane of the torus and, as a consequence, to exhibit the largest absorption.
The GD torus model predicts that the anisotropy is rapidly decreasing with increasing wavelengths and, for the typical values of inferred from the above considerations, practically vanishes at around 30 m (see Fig. 1). Indeed Mulchaey et al (1994) found that the distribution of the ratio of the integrated IR flux between 25 and 60 m to the [OIII] flux is rather similar for Seyfert 1 and 2 galaxies, with Sey 2s showing larger variance and a tail of higher IR to [OIII] ratios, possibly due to starburst components (see Sect 2.4).
In conclusion the mild anisotropy estimated in various samples of Seyfert nuclei is well reproduced by the extended and moderately thick tori suggested by the fits to available broad band spectral data (Sect. 2.1). By converse, in order to explain the observed anisotropy, the compact and very thick tori require a fine tuning of the fraction of inner torus walls directly seen by the observer, as well as additional emission of extended dust, possibly associated to the NLR.
2.3 Infrared spectroscopy of the narrow–line nuclei
Infrared spectroscopy can potentially penetrate an obscuring torus and give direct evidence of the presence of a broad line region completely obscured at optical wavelengths, where absorption is larger. Broad components of Pa and Pa hydrogen lines have been searched for in active galaxies. Actually, the extinction at their near–IR wavelenghts is a factor of 3–5 below that at H. Clear detection has been obtained for several narrow–line galaxies (Rix et al. 1990; Ruiz, Rieke and Schmidt 1994; Goodrich, Veilleux and Hill 1994). The relevant result is that there are optically narrow-line active nuclei exhibiting broad–lines when observed in the IR domain.
In 3 out 15 Sey 2 nuclei, selected with no particular criterium, Goodrich et al. (1994) were able to detect the broad component of the Pa line, though their sensitivity limited possible detection to cases with 11. In the sample selected by Ruiz et al. (1994) on the basis of the relatively strong emission at 3 m there are six out nine nuclei with BLRs.
The detection of a broad component of the Pa in the spectrum of the 1.9 Seyfert galaxy NGC 2992 suggests 5–8 (Goodrich et al. 1994; Rix et al. 1990). Similarly in the case of NGC 5506 reddenings 5–11 from IR broad lines have been reported (Gooodrich et al. 1994; Rix et al. 1990). These reddenings agree reasonably well with those inferred from the IR colors of the nuclei (Table 1).
The existence of tori with modest optical depth is confirmed by observations of Pa lines in a complete sample of radio galaxies (Hill et al. 1996). In three out of eight objects the broad component of the Pa has been clearly detected. The values of the reddening inferred from line ratios are in the range 2.77.
On the other hand larger reddenings of BLRs are surely present in narrow–line nuclei such as Cygnus A, exhibiting 24 (Ward et al. 1991), and NGC 1068.
These results are the most relevant in discriminating between extremely and mildly thick models, thanks to their rather different predictions. At the most basic level for extremely thick models, such as those presented by PK, the optical depth at near–IR, where BLRs have been detected, is so large 100 to prevent detection of any IR broad line. In the case of extremely high optical depths the problem can be solved by assuming that the observed broad-lines are scattered in the line of sight by a screen. In this hypothesis the lines are expected to be strongly polarized, whilst low level of polarization is predicted for GD models. Thus IR-spectropolarimetry can discriminate between the two possibilities. In addition, in the case of GD model we expect that narrow-line nuclei with significant emission at near IR are objects seen along less obscured line of sight and, as a consequence, with a more easily detectable BLR in the IR. By converse in the PK model there is no expected correlation between near IR flux (attributed to the visible portion of the inner walls) and the detectability of the BLR in the IR domain.
2.4 High spatial resolution observations and obscuring matter around AGN
Valuable information concerning the spatial extent of obscuring matter and, to a lesser extent, also its column densities, has come in the last few years from high spatial resolution observations, performed with different techniques.
On one hand, water maser line emission observed in the nucleus NGC 4258 at 22 GHz on a subparsec scale (Watson & Wallin 1994; Miyoshi et al. 1995; Greenhill et al. 1995) yields clear evidence of the presence of molecular gas very close to the active nucleus. On the other hand the images obtained by the Planetary Camera of HST of the active galaxy NGC 4261 clearly show an unresolved ( pc) source surrounded by a dusty disc extending on a scale of 100 parsecs (Jaffe et al. 1993). This observation is a rather direct support to the idea of the existence of extended dusty tori around AGN. Also imaging in [OIII] and +[NII] lines with the Hubble Space Telescope has revealed an unresolved region of very strong reddening within 23 pc of the nucleus of NGC 2110, a faint Seyfert 2 galaxy (Mulchaey et al. 1994).
maps of the nuclear region of NGC 7469 present evidence of the presence of molecular gas in a Seyfert 1 galaxy (Genzel et al. 1995). With standard assumption a total gas mass of is found to be within pc from the galaxy centre. This amount is comparable to that found in a similar volume in NGC 1068 (Genzel at al. 1995).
High spatial resolution observations of molecular emission in NGC 1068 are available at various wavelengths (Planesas et al. 1991, Jackson et al. 1993, Tacconi et al. 1994, Blietz et al. 1994). These observations show that the molecular gas extends over 100-200 pc far from the nucleus with a similar scale height. The associated total extinction may vary from up to 200.
In Figure 5 we present the maps at 2.2, 3.5, 10.5 and 25 m of NGC 1068 predicted by the GD model. The size of the torus emission increases with increasing : the typical radius of the isophote at 10% of the peak runs from pc in the near–IR to more than 20 pc in the mid–IR. Bear in mind anyway that the peak–normalized isophotes depend on the adopted PSF. The isophotes are elongated along directions with less absorption, in nice agreement with observations (Braatz et al. 1993; Cameron et al. 1993). However our model extends over only 0.6′′, whereas these observations suggest significant emission up to 1.5–2′′ at around 10 m. Cameron et al. (1993) and Pier and Krolik (1993) envisaged the possibility that the extended mid–IR emission is due to dust located in the NLR. However, as pointed out by Cameron et al., this dust, if diffuse, would produce large absorption –4, while measured values toward the NLR of NGC 1068 are (Inglis et al. 1995).
On the other hand, high angular resolution observations also showed that the star formation rate is significant in circumnuclear regions of a large majority of AGNs. Evidence of OB star associations in the very central regions (”) of NGC 1068 has been found with COSTAR by Macchetto et al. (1994). Also in NCG 7469 robust star formation is present (Genzel et al. (1995) and in MKN 348 (Simpson et al. 1996). Thus there might be a smooth transition of the mid- and far-IR emission from an inner dusty torus with typical dimensions pc, illuminated by the nucleus and responsible for most of the nuclear extinction, to a broader dusty region extending over several hundreds of parsecs, in which the dust is mainly heated by young stars.
The observations summarized in this section therefore confirm that the dense dusty medium is spread in the nuclear region from a fraction of pc up to hundreds of pc, yielding absorption .
3 Relationship of the torus with the X–ray absorption
Seyfert 1 galaxies often exhibit X–ray absorption in excess over the Galactic column density, although observed hydrogen column densities are usually with a median value (Nandra and Pounds 1994). This agrees with the commonplace that in the case of broad–line AGN the line of sight is relatively free of absorbing material. By converse hard X–ray spectra of Seyfert 2s show evidence of larger absorption, as expected in the unification scheme.
Spectra detailed enough to allow good estimates of the absorbing column density are available for 21 narrow–line active nuclei (see Smith and Done 1996; Iwasawa 1995). For this sample, admittedly not a complete one and presumably biased toward low values of , the column density distribution ranges over 21.525 with a median value 23.3, larger than that of Sey 1s by a factor 200.
Although we assume that a fraction of objects with has been missed, nevertheless these results show that many of Sey 2s have tori optically thin to electron scattering (Thomson depth =1 corresponds to and =750).
Can the X–ray absorbing hydrogen column be associated to the dusty torus responsible for the UV and optical absorption and for the IR emission? Assuming standard dust over hydrogen abundance, the median 23.3 translates into a median reddening 100. This would imply that the Seyfert 2s on the average should be fainter at 10m than Sey 1s by a factor of (see figure 4), much larger than the factor 2–4 found by Heckman (1995). Indeed in Sect. 2.2 we have shown that this lower anisotropy of the torus emission, confirmed by our analysis of the RSA sample, requires . Host galaxy can not help much in accounting for this discrepancy, since the objects have been observed with small aperture (a few arcseconds). Defining as the absorption in the V band that associated to the X–ray absorbing column density under the assumption of normal gas–to–dust ratio, and the absorption derived from the IR spectra, we may infer that on the average .
The discrepancy is confirmed by the analysis of a sample of objects with accurately determined X–ray spectra, O[III] line fluxes and 10 m fluxes. The relevant data are reported in Table 2. The twelve Sey 1s of the sample show a rather narrow distribution of the ratios of the X–ray to [OIII] flux, (fluxes expressed in erg s-1 cm-2), smaller values being associated with higher column densities. For the same objects the spread of the distribution of is limited to a factor of 9, which is smaller than the factor of 40 found by Heckman (1995). The effect is attributable to the fact that the contamination by underlying galaxy is lower in our sample, since the objects are relatively nearby. These results confirm that the normalization to the intrinsic nuclear luminosity through the [OIII] emission is appropriate, though absorption and use of different apertures in the observations clearly introduce noise.
The median value for the 12 Seyfert 1s is , larger than that of the 11 Seyfert 2s by a factor 2. With a numerical code which solves the transport equation for X–rays, taking into account both photoelectric absorbtion as well as Compton scattering (Granato 1997, in preparation), we found that a decrease of a factor 2 implies an average column density for the obscured objects, only a factor 2 smaller than the median column density found in the Sy 2s sample.
If the material responsible for the X–ray absorption had a normal gas–to–dust ratio, we would expect and a ratio of IR to [OIII] fluxes which is at least a factor of 4 smaller for narrow–line active galaxies, while the ratio of the IR to [OIII] fluxes is rather similar for the broad and narrow–line galaxies of the sample.
Good correlation exists between the ratio of 2–10 keV flux to the O[III] line flux and the X–ray absorbing column density of the Sy 2s sample (see Fig. 6). Similar level of correlation is also present between the column density and the ratio of the 10m fluxes to for the 8 objects for which IR measurements are available. This result is understood if we assume some degree of correlation between the X–ray absorbing column density and the optical depth due to the dust.
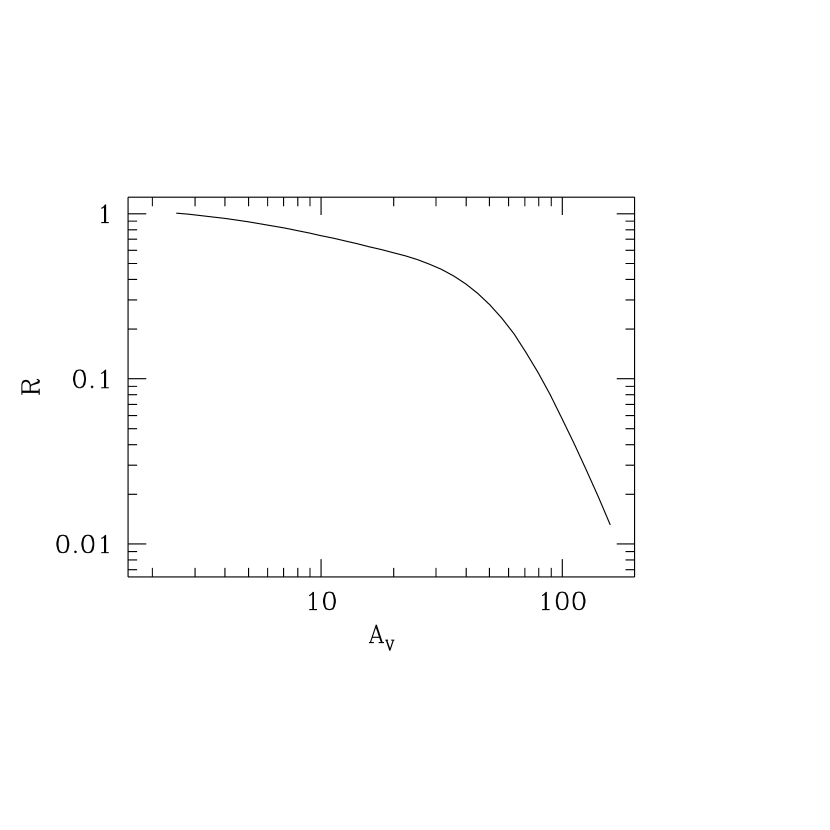
The 15 Seyfert 1 galaxies of the sample in Table 2 exhibit ratios with a median value 0.5, while for the 8 Seyfert 2s the ratios are significantly clustered around 0.2. Hence the Seyfert 1 galaxies have an X-ray to mid-IR average ratio larger by a factor of about 2 than that of Seyfert 2s. On the other hand in any reasonable model in which is forced to be equal to the ratio
turns out to be well below 1 (Fig. 7). In particular with (the median ), our radiative transfer codes predict . Once more, the discrepancy is solved if
The link of the X–ray to the mid–IR emission in AGNs has been investigated also by Barcons et al. 1995), who measured the X–ray intensities in the nominal band 2–10 keV, as observed by the experiment A2 on board of HEAO–1 satellite, at the positions of the RMS sample of AGNs selected at 12 m by IRAS. After subtracting the ”blank sky” they found that the ratio of the flux at 5 keV to the flux at 12 m for the 54 Seyfert 1s and for 59 Seyfert 2 galaxies a factor of 7 lower. The low angular resolution of the IRAS data implies that the host galaxies contributes to the 12 m fluxes, in a way depending on the relative strength of the galaxy to the nucleus as well as on distance. Maiolino et al. (1995) claim that the typical host galaxy of a Seyfert 2 nucleus is 5 times more luminous that the typical Sey 1 host galaxy. Thus part of the factor of 7 found by Barcons et al. (1995) as difference in the X–ray to IR ratio may be accounted for by this effect. However also for this IR selected sample the ratio of the X-ray to the mid-IR emission is larger for type 1 Seyferts, while, assuming , the opposite is expected.
It is worth noticing that the median value found for the Seyfert 1 galaxies of Table 2 translates into , a factor about 4 larger than the value given by Barcons et al. (1995). On the other hand the sample of Table 2 can be thought as X-ray selected and thus is biased toward larger X-ray to IR ratios. If the parent population has a dispersion in the distribution of the logarithms of the infrared to X-ray luminosity ratios, the factor 4 is easily recovered (see eq. 14 of Barcons et al. 1995).
For an handful of objects the absorption in the visual band , calculated under the assumption that the X–ray absorbing gas has a normal gas–to–dust ratio, can be directly compared to that derived from the IR spectrum and/or to the absorption derived from IR broad lines . NGC 2992 has low 11 and is not well determined but possibly small, 5–11. It is worth mentioning that Weaver et al. (1996) proposed that the Fe fluorescence line in this source is reprocessed at distance of 104 l.y. from the central source in a region with 2–4. The argument is based on long term variability of the line equivalent width of a factor 3, compared to a continuum variation of a factor 20. However the poor time statistic does not exclude a significantly smaller distance of the reprocessing material. Similarly in NGC 5506 19, the IR broad band spectrum demands low absorption, and 5–11. A significant change in the relationship between X–ray and IR absorptions is apparent at higher X–ray column density. Indeed, NGC 4388 190, while and IR broad–lines have not ben detected. The IR spectrum of MKN 348 suggests 7–10 (Roche et al. 1991) and indeed the broad component of He I (1.083 m) line has been detected (Ruiz et al. 1994).
For the same object Smith and Done (1996) estimated , corresponding to 70. In NGC 1068 the GD model of the IR spectrum requires along the line of sight, while X-ray spectral observations suggest , almost 500 times larger. Similar conclusions holds for Circinus: the beautiful spectrum obtained with the SWS on board of ISO by Moorwood et al. (1996) demands , while the X–ray spectrum obtained by Matt et al. (1996) with ASCA implies at least and thus .
Therefore for the objects of Table 2 for which reliable determinations of X–ray and IR absorption are available, we find , the equality holding only for objects with low .
This behaviour is confirmed by high luminosity objects, which can be identified with type 2 QSOs. The IR and optical spectrum of IRAS 09104 is nicely fitted by a GD torus with an absorption along the line of sight (Granato et al. 1996), whilst the X–ray spectrum indicate that only scattered radiation is seen with ASCA (Fabian et al. 1995), implying and, as a consequence, 800. For IRAS 10214 the line of sight absorption is while X-ray upper limits suggest (Granato et al. 1996).
In conclusion available data, combined with GD model, implies that at low X–ray column density , while when we have . Finally for the largest measured column densities
3.1 Interpretations
Although the overall picture may be quite complex and data may be plagued by systematic effects such as X–ray variability, nevertheless there is evidence that the gas responsible for the X–ray absorption is in general dust free and that the dusty torus in Seyfert 2 galaxies is not the site wherein the bulk of the X–ray absorption occurs. Only in the least absorbed objects we find that . Moreover in the data there is no significant trend of the ratio of the X-ray to IR absorption in type 2 AGN on the luminosity. The increasing number of claimed detections of type 2 QSOs (see e.g. Boyle et al 1995; Almaini et al 1995; Ohta et al. 1996) is suggestive of a weak, if not null, correlation of the absorptions themselves with luminosity.
The most natural explanation of these results is that the X-ray absorption occurs in gas which lies inside the dust sublimation radius. The nuclear activity implies a reservoir of ISM, which flowing toward the nucleus fuels the central BH. We identify the reservoir with the dusty extended torus and we relate the X–ray absorbing structure with the material which, on the way from the reservoir to the accretion disc, is already beyond the dust sublimation radius. Assuming that inside this radius the gravity is dominated by the central BH and that a quasi steady–state is established, we can derive the expected density by mass conservation
where is the accretion rate and is the radial drift velocity. If we introduce the ratio of the drift to the circular velocity (see e.g. Blackman and Yi 1996; Krolik and Begelman 1988) and we assume that the circular velocity is nearly keplerian, we get for the hydrogen number density
The sublimation radius is pc, about a factor 2–3 larger than the BLR typical radius. In the intermediate region dust is disrupted, but the metal rich gas absorbs the X–ray flux coming from the nucleus. Let this region extend from to and . Then the expected column density of this region is
where is the efficiency of mass into radiation conversion normalized to 0.1 and the radial integration assumes a constant . Inserting the reasonable values and we get for Seyfert nuclei with luminosity in the range and emitting near the Eddington limit for . Although this view is admittedly crude, we expect that at about the sublimation radius radiation pressure, differential rotation, viscosity and gravitational field are arranged in a way to allow gas feeding the central black hole (see e.g. Krolik and Begelman 1988; Yi et al. 1994; Blackman and Yi 1996; Granato et al. in preparation).
Interestingly enough the dependence on the total luminosity is relatively weak, while it is more pronounced that on . The column densities observed in Seyfert 2 galaxies suggest that they are emitting at the Eddington limit.
In conclusion from the analysis of available IR and X–ray data, it is apparent that the X–ray absorption in type 2 AGN is chiefly due to matter free from dust, located at and just inside the dust sublimation radius and flowing toward the accretion disc.
4 AGN statistics and the X–ray and IR background
The relative fraction of broad–lined and narrow–lined AGN is extremely relevant to a number of problems such as the validity of the unified schemes (see Lawrence 1991), the origin of the X–ray background (see e.g. Setti and Voltjer 1989) and the contribution of the AGN to the IR background (Granato et al. 1995). Unfortunately the available statistics mainly refer to the local populations, while for the X–ray and IR backgrounds the relevant statistics concern objects at substantial redshift 1. On the other hand we may derive interesting clues also from local samples.
Lawrence (1991) showed that the fraction of local narrow–line AGN may range from 0.7 to 0.84 in optically selected samples, after corrections for bias. Of course the statistics is rather poor for faint objects even in the case of local samples. To overcome this bias Maiolino and Rieke (1995) examined the RSA sample and found that the fraction of type 2 nuclei may be as large as 0.8, with an important fraction of low luminosity objects.
Assuming that the relative number of AGN merely reflects the average opening angle of the dusty torus, the optical samples suggest , a range confirmed also by the observations of ionization cones.
The large RMS sample of 116 Seyferts selected at 12 m exhibits an almost identical fraction of type 1 and type 2 objects. To understand this result we have to take into account that on the average type 1 objects are brighter by a factor of 2–4 (Heckman 1995) and that the host galaxy contribution is not negligible for the objects in the RMS sample, because of the poor angular resolution of IRAS. Indeed under the assumptions that locally the host galaxy is as luminous as the active nucleus in type 1 objects at 12 m and three times more luminous in type 2 objects, and that type 2 objects are four times more numerous than type 1, we predict almost the same number of the two types at the IRAS 12 m survey flux limit.
The statistics on the X–ray absorption is still rather poor. The distribution of the Seyfert 2s detected in hard X-ray bands (Smith & Done 1996) shows that a significant fraction of about 40 of the objects has and only 15 has . This result must be taken with caution, as it is surely plagued by bias against highly absorbed objects. However, following the conclusions of the previous section, surveys in the mid–IR bands will not miss many of the higly X–ray absorbed AGN and will be extremely helpful in settling down the relative fraction of type 1 and 2 objects.
This fact is extremely relevant to the problem of the X–ray background. As proposed by Setti and Voltjer (1989) the hard X–ray background from 3 to 100 keV (HXRB) can be fitted by the integrated emission of heavily absorbed AGN (see also Zdziarski, Zycki and Krolik 1993; Madau, Ghisellini and Fabian 1993; Comastri et al 1995; Celotti et al 1995). Although with some differences, all these authors concluded that the HXRB can be produced by an evolving population of obscured AGN, characterized by local luminosity function and local volume emissivity within the observational boundaries, and endowed with a significant cosmological evolution up to 2.5-5 ( with ). The obscured AGN are required to be 2–4 times more numerous than the unobscured ones. About 50% of the obscured AGN are required to have and about 35% to have (see e.g. Celotti et al. 1995). These requirements are consistent with the limits imposed by observations, although not by a wide margin as for the column density distribution (see Smith and Done 1996).
A viable alternative solution for the HXRB has been worked out by Franceschini et al. (1993), who proposed, on the basis of the available X–ray source counts and related statistics, that the HXRB is mainly contributed by a population of AGN endowed with luminosity and spectral evolution (luminosity and column density increasing with increasing redshift). Although both schemes imply that a significant number of absorbed AGN contributing to the HXRB will be detected with the ISO surveys, nevertheless the different assumption about spectral evolution will be mirrored in the IR surveys with different redshift distribution of the type 2 AGN.
In Fig. 8 and in Table 3 we present the AGN counts at 15 m and 6.7 m, the two effective wavelengths of the ISOCAM surveys, computed with the prescription that they produce the HXRB. In order to work out IR count predictions the ratio of the 2–10 keV luminosity to the luminosity in the 10 m band of the unabsorbed objects must be specified. The 12 type 1 objects reported in Table 2 show an average value of 0.5 of this ratio. A similar value 0.4 may also be inferred by SED of the UVSX QSO sample reported by Elvis et al. (1994). We used the results of Sect 3 to infer the dust absorption in the torus at given hydrogen column density. In the total flux a contribution from a non evolving host galaxy is also included as described above.
From Table 3 it is apparent that the ISOCAM surveys will be extremely efficient in detecting the dusty AGN. They will provide very sound statistics allowing to understand both the relative number of type 1 and 2 in the local Universe as well as their respective evolution.
Using the IR counts we can compute the contribution to the IR background of the objects producing the HXRB, which turns out to be rather flat from several microns to 200 m at level of Watt//sr (see Fig. 9). This is only a lower limit to the AGN contribution, since it is based only on hard X–ray emitting objects. It is worth noticing that this corresponds to about 5 times the local energy density of the XRB from 1 keV to MeV and still is only a fraction of the IR background produced by normal galaxies (see e.g. Franceschini et al. 1995).
The request of modelling the HXRB spectrum summing up absorbed sources implies that only a small fraction of the total energy is stored in the HXRB. To illustrate the problem we can compute the BH mass density required to supply the XRB. This is rather easily done for the model proposed by Celotti et al. (1995), who proposed that absorbed AGN share the same 2–10 keV luminosity function and the same luminosity evolution of the unabsorbed ones, but are a factor around 2.5 more numerous. Using the 47 SEDs of the UVSX sample of QSOs (Elvis et al. 1994) the average bolometric correction of the 2-10 keV band is with very small dispersion. Since the sample includes 29 radio quiet and 18 radio loud objects the value found possibly underestimates the bolometric correction for radio quiet objects. Finally the mass density of the black holes associated to the X-ray background is
where is the mass to energy conversion efficiency normalized to 0.1. This value has to be compared to found by Chokshi and Turner (1992) for the optical selected AGN. By using the galaxy local luminosity function by Efstathiou et al. (1988) we find that the production of the XRB implies that almost all the galaxies with -17 should harbor a BH with . The consequences and implications will be examined elsewhere.
5 Summary and conclusions
The statistics of large samples of AGN (CfA, RSA, RMS and others) on the differences of 10 m nuclear emission between broad and narrow line AGN show that the anisotropy amounts to a factor of 2-4, implying that the narrow line objects of these samples have on average dust absorption in the range . The detection of broad components of IR permitted lines such as Pa in a number of narrow line active nuclei confirms that low optical depths are not an exception. Available data on IR spectra of AGN strongly support the same conclusion, adding evidence for a significant spread of in narrow line objects.
Since we would expect in the CfA and RSA samples also objects seen along lines of sight close to the equatorial plane, these results imply that the absorption due to dust in the torus is actually significantly smaller than predicted by PK torus models with and . GD extended torus models are naturally in agreement with these results. For instance the fit to NGC 1068 nuclear IR spectrum is obtained with along the line of sight. Moreover the predicted maps of the mid–IR emission are extended and thus in good agreement with the observation, though additional emission from the regions just outside the torus seems to be requested. This additional emission has been already observed in several cases, and attributed to the star formation activity, which is quite natural in these astrophysical settings.
Interestingly enough also the IR broad band spectra of broad line AGN can be fitted by models with dust absorption in the equatorial plane confined at . The largest values of dust absorption are required when fitting high redshift and high luminosity narrow line objects (but also broad line ones such as the Cloverleaf). These active nuclei plausibly are in a phase of high activity and have a large reservoir of mass available to the accretion, which is also responsible for a large covering of the nuclear region. These cases look rather extreme and notwithstanding they exhibit dust absorption significantly less than that implied by models with .
The emerging picture suggests that the strictly unified scheme does not hold. There is evidence for large spread in optical depth distribution in both type 1 and type 2 nuclei. Also the average covering factor may change from obscured to unobscured AGN. Dependence of these parameters on luminosity is not evident, while there are cases of objects with quite different luminosities exhibiting high absorption and high covering factors. We suggest that these parameters depend more on the conditions of the interstellar medium of the host galaxy than on the nuclear luminosity.
Since the IR observations can be fitted by GD torus models predicting a relatively low for the dust, the next question was about the origin of the X–ray absorption in narrow line AGN. The data show a rather strict relationship among the column density of the X–ray absorbing material and the dust absorption in the torus, for several cases in which we can observationally infer both of them. However we found that only for low hydrogen column densities , while for and for .
We propose that the X–ray absorption takes place mainly in the region just inside the dust sublimation radius, where dust is disrupted but a metal enriched gas exists. In this scheme the dusty torus reflects more the conditions of the reservoir of the material avilable for the accretion, while the X–ray absorbing column density reflects the conditions in a region which is dominated by the BH physics. Indeed we showed that the X–ray column density can be related to the ratio at which the nucleus is radiating, higher implying higher column density.
The conclusion that the dusty tori are not so thick to absorb the mid–IR nuclear radiation implies that mid–IR surveys should be able to detect a large number of narrow line AGN, particularly those with , which are supposed to be the main contributors to the HXRB. In particular we have shown that with the results of the ISO surveys, which are soon being completed, it will be possible to assess the problems of the local fraction and cosmological evolution of narrow line AGN. Also the problem of the contribution of the AGN to the IR background has been examined. We found that even in the case of a large number of absorbed sources as implied by the HXRB spectrum, the CIBR is still a fraction of that expected by normal galaxies. Nevertheless we predict significant correlation of the HXRB and the CIBR particularly at around 10–20 m, where the expected ratio between the background produced by the AGN and that due to galaxies is at a maximum. Also the assumption that the HXRB is produced by absorbed AGN implies a large mass density in residual black holes
References
- Almaini et al. (1995) Almaini, O., Boyle, B. J., Griffiths, R. E., Shanks, T., Stewart, G. C., & Georgantopoulos, I. 1995, MNRAS, 277, L31
- Alonso-Herrero et al. (1996) Alonso-Herrero, A., Ward, M. J., & Kotilainen, J. K. 1996, MNRAS, 278, 902
- Antonucci (1993) Antonucci, R. 1993, ARA&A, 31, 473
- Antonucci et al. (1994) Antonucci, R., Hurt, T., & Miller, J. 1994, ApJ, 430, 210
- Barcons et al. (1995) Barcons, X., Franceschini, A., De Zotti, G., Danese, L., & Miyaji, T. 1995, ApJ, 455, 480
- Barthel (1989) Barthel, P. 1989, ApJ, 606
- Barvainis & Antonucci (1994) Barvainis, R., & Antonucci, R. 1994, AJ, 107, 1291
- Blackman & Yi (1996) Blackman, E. G., & Yi, I. 1996, ApJ, 461, L21
- Blietz et al. (1994) Blietz, M., Cameron, M., Drapatz, S., Genzel, R., Krabbe, A., Werf, P. V. D., Sternberg, A., & Ward, M. 1994, ApJ, 421, 92
- Boyle et al. (1995) Boyle, B. J., McMahon, R. G., Wilkes, B. J., & Elvis, M. 1995, MNRAS, 272, 462
- Braatz et al. (1993) Braatz, J. A., Wilson, S., Gezari, D. Y., Varosi, F., & Beichman, C. A. 1993, ApJ, 409, L5
- Cameron et al. (1993) Cameron, M., Storey, J. W., Siebenmorgen, R., & Lee, T. J. 1993, ApJ, 419, 136
- Celotti et al. (1995) Celotti, A., Fabian, A. C., Ghisellini, G., & Madau, P. 1995, MNRAS, 277, 1169
- Chokshi & Turner (1992) Chokshi, A., & Turner, E. L. 1992, MNRAS, 259, 421
- Comastri et al. (1995) Comastri, A., Setti, G., Zamorani, G., & Hasinger, G. 1995, A&A, 296, 1
- Efstathiou & Rowan-Robinson (1994) Efstathiou, A., & Rowan-Robinson, M. 1994, MNRAS, 212, 218
- Efstathiou et al. (1988) Efstathiou, G., Ellis, R. S., & Peterson, B. A. 1988, MNRAS, 232, 431
- Elvis et al. (1994) Elvis, M., et al. 1994, ApJS, 95, 1
- Fabian & Crawford (1995) Fabian, A. C., & Crawford, C. S. 1995, MNRAS, 274, L63
- Franceschini et al. (1993) Franceschini, A., Martin-Mirones, J. M., Danese, L., & De Zotti, G. 1993, MNRAS, 264, 35
- Franceschini et al. (1994) Franceschini, A., Mazzei, P., De Zotti, G., & Danese, L. 1994, ApJ, 427, 140
- Franceschini et al. (1995) Franceschini, G. L., A. Granato, P., M., Danese, L., & G., D. 1995, in Unveiling the Cosmic Infrared Background – AIP Conference Proceeding 348, ed. E. Dwek (AIP Press), 159
- Genzel et al. (1995) Genzel, R., Weitzel, L., Tacconi-Garman, L. E., Blietz, M., Cameron, M., Krabbe, A., Lutz, D., & Sternberg, A. 1995, ApJ, 444, 129
- Giuricin et al. (1996) Giuricin, G., Fadda, D., & Mezzetti, M. 1996, ApJ, 468, 475
- Giuricin et al. (1995) Giuricin, G., Mardirossian, F., & Mezzetti, M. 1995, ApJ, 446, 550
- Goodrich et al. (1994) Goodrich, R. W., Veilleux, S., & Hill, G. J. 1994, ApJ, 422, 521
- Granato & Danese (1994) Granato, G. L., & Danese, L. 1994 (GD), MNRAS, 268, 235
- Granato et al. (1996) Granato, G. L., Danese, L., & Franceschini, A. 1996, ApJ, 460, L11
- Granato et al. (1995) Granato, G. L., Franceschini, A., & Danese, L. 1995, in Unveiling the Cosmic Infrared Background – AIP Conference Proceeding 348, ed. E. Dwek (AIP Press), 226
- Greenhill et al. (1995a) Greenhill, L. J., Henkel, C., Becker, R., Wilson, T. L., & Wouterloot, J. G. A. 1995a, A&A, 304, 21
- Greenhill et al. (1995b) Greenhill, L. J., Jiang, D. R., Moran, J. M., Reid, M. J., Lo, K. Y., & Claussen, M. J. 1995b, ApJ, 440, 619
- (32) Hauser M. 1994 in Examining the Big Bang and Diffuse Background Radiations, IAU symp. 168, The Hague, The Netherlands
- Heckman (1995) Heckman, T. M. 1995, ApJ, 446, 101
- Hill et al. (1996) Hill, G. J., Goodrich, R. W., & Depoy, D. L. 1996, ApJ, 462, 163
- Huchra & Burg (1992) Huchra, J., & Burg, R. 1992, ApJ, 90
- Hughes et al. (1993) Hughes, D. H., Robson, E. I., Dunlop, J. S., & K., G. W. 1993, MNRAS, 607
- Inglis et al. (1995) Inglis, M. D., Young, S., Hough, J. H., Gledhill, T., Axon, D. J., Bailey, J. A., & Ward, M. J. 1995, MNRAS, 275, 398
- Iwasava (1996) Iwasava, K. 1996, Ph.D. thesis, ISAS
- Jackson et al. (1993) Jackson, J. M., Paglione, T. A. D., Ishizuki, S., & Nguyen-Q-Rieu . 1993, ApJ, 418, L13
- Jaffe et al. (1993) Jaffe, W., Ford, H. C., Ferrarese, L., Van Den Bosch, F., & O’Connell, R. W. 1993, Nature, 364, 213
- Kotilainen et al. (1992) Kotilainen, J. K., Ward, M. J., Boisson, C., Depoy, D. L., & Smith, M. G. 1992, MNRAS, 256, 149
- Krolik & Begelman (1988) Krolik, J. H., & Begelman, M. C. 1988, ApJ, 329, 702
- Krolik et al. (1994) Krolik, J. H., Madau, P., & Zycki, P. T. 1994, ApJ, L27
- Lawrence (1991) Lawrence, A. 1991, MNRAS, 252, 586
- Macchetto et al. (1994) Macchetto, F., Capetti, A., Sparks, W. B., Axon, D. J., & Boksenberg, A. 1994, ApJ, 435, L15
- Madau et al. (1993) Madau, P., Ghisellini, G., & Fabian, A. C. 1993, ApJ, 410, L7
- Maiolino & Rieke (1995) Maiolino, R., & Rieke, G. H. 1995, ApJ, 454, 95
- Maiolino et al. (1995) Maiolino, R., Ruiz, M., Rieke, G. H., & Keller, L. D. 1995, ApJ, 446, 561
- Malaguti et al. (1994) Malaguti, G., Bassani, L., & Caroli, E. 1994, ApJS, 94, 517
- Maloney et al. (1994) Maloney, P. R., Begelman, M. C., & Rees, M. J. 1994, ApJ, 432, 606
- Miyoshi et al. (1995) Miyoshi, M., Moran, J., Herrnstein, J., Greenhill, L., Nakai, N., Diamond, P., & Inoue, M. 1995, Nature, 373, 127
- Mizutani et al. (1994) Mizutani, K., Suto, H., & Maihara, T. 1994, ApJ, 421, 475
- Mulchaey et al. (1994) Mulchaey, J. S., Koratkar, A., Ward, M. J., Wilson, A. S., Whittle, M., Antonucci, R. R. J., Kinney, A. L., & Hurt, T. 1994, ApJ, 436, 586
- Nandra & Pounds (1994) Nandra, K., & Pounds, K. A. 1994, MNRAS, 268, 405
- Ohta et al. (1996) Ohta, K., Yamada, T., Nakanishi, K., Ogasaka, Y., Kii, T., & Hayashida, K. 1996, ApJ, 458, L57
- Pier & Krolik (1992) Pier, E. A., & Krolik, J. H. 1992 (PK), ApJ, 401, 109
- Pier & Krolik (1993) Pier, E. A., & Krolik, J. H. 1993, ApJ, 418, 673
- Planesas et al. (1991) Planesas, P., Scoville, N., & Myers, S. T. 1991, ApJ, 369, 364
- Puget et al. (1996) Puget, J. L., Abergel, A., Bernard, J. P., Boulanger, F., Burton, W. B., Desert, F. X., & Hartmann, D. 1996, A&A, 308, L5
- Rieke & Low (1975) Rieke, G. H., & Low, F. J. 1975, ApJ, 199, L13
- Rix et al. (1990) Rix, H.-W., Rieke, G., Rieke, M., & Carleton, N. P. 1990, ApJ, 363, 480
- Roche et al. (1991) Roche, R. J., Aitken, D. K., Smith, C. H., & Ward, M. J. 1991, MNRAS, 606
- Ruiz et al. (1994) Ruiz, M., Rieke, G. H., & Schmidt, G. D. 1994, ApJ, 423, 608
- Rush et al. (1993) Rush, B., Malkan, M. A., & Spinoglio, L. 1993, ApJS, Nov 1
- Sanders et al. (1989) Sanders, D. B., Phinney, E. S., Neugebauer, G., Soifer, B. T., & Matthews, K. 1989, ApJ, 29
- Setti & Woltjer (1989) Setti, G., & Woltjer, L. 1989, A&A, L21
- Simpson et al. (1996) Simpson, C., Mulchaey, J. S., Wilson, A. S., Ward, M. J., & Alonso-Herrero, A. 1996, ApJ, 457, L19
- Smith & Done (1996) Smith, D. A., & Done, C. 1996, MNRAS, 280, 355
- Tacconi et al. (1994) Tacconi, L. J., Genzel, R., Blietz, M., Cameron, M., Harris, A. I., & Madden, S. 1994, ApJ, 426, L77
- Ward et al. (1991) Ward, M. J., Blanco, P. R., Wilson, A. S., & Nishida, M. 1991, ApJ, 382, 115
- Watson & Wallin (1994) Watson, W. D., & Wallin, B. K. 1994, ApJ, 432, L35
- Weaver et al. (1996) Weaver, K. A., Nousek, J., Yaqoob, T., Mushotzky, R. F., Makino, F., & Otani, C. 1996, ApJ, 458, 160
- Whittle (1992) Whittle, M. 1992, ApJS, 79, 49
- Wilson (1996) Wilson, A. S. 1996, Vistas in Astronomy, 40, 63-70 (1996), 40, 63
- Yi et al. (1994) Yi, I., Field, G. B., & Blackman, E. G. 1994, ApJ, 432, L31
- Zdziarski et al. (1993) Zdziarski, A. A., Zycki, P. T., & Krolik, J. H. 1993, ApJ, 414, L81


| Name | D | F(L) | F(N) | Ref | Ra |
|---|---|---|---|---|---|
| Mpc | mJy | mJy | |||
| Circinus | 3 | 701 | 6000 | R,M | 0.35 |
| MCG-5-23-16 | 48 | 79 | 530 | R,R | 0.44 |
| NGC 1068 | 22 | 1700 | 17800 | RL,RL | 0.28 |
| NGC 1386 | 25 | 33 | 209 | A,G | 0.47 |
| NGC 2110 | 45 | 47 | 198 | R,R | 0.71 |
| NGC 2992 | 45 | 74 | 259 | Mi,G | 0.85 |
| NGC 4388 | 26 | 51 | 305 | A,R | 0.50 |
| NGC 5506 | 42 | 313 | 720 | R,R | 1.29 |
| NGC 7582 | 32 | 201 | 877 | K,R | 0.68 |
| Name | Ref X | Ref IR | X/IR | X/OIII | IR/OIII | ||||
| Seyfert 1 | |||||||||
| IC 4329 | 12.3 | 34 | 22.0 | NP | G | 0.56 | 362 | 647 | |
| MGC-6-30-15 | 5.6 | 8.2 | NP | G | 0.68 | ||||
| Mrk 1040 | 2.6 | 13 | 9.4 | M | G | 0.28 | 200 | 723 | |
| Mrk 335 | 1.3 | 23 | 6.0 | NP | G | 0.21 | 54 | 260 | |
| Mrk 509 | 5.0 | 81 | 6.8 | NP | M | 0.74 | 62 | 84 | |
| Mrk 79 | 2.5 | 37 | 7.2 | M | G | 0.35 | 68 | 195 | |
| NGC 1365 | 2.6 | 10.0 | M | G | 0.26 | ||||
| NGC 3227 | 4.0 | 64 | 7.9 | NP | G | 0.51 | 63 | 123 | |
| NGC 3516 | 2.1 | 48 | 6.4 | NP | G | 0.33 | 43 | 133 | |
| NGC 3783 | 7.2 | 130 | 14.0 | M | G | 0.51 | 55 | 108 | |
| NGC 4051 | 1.9 | 39 | 9.0 | NP | G | 0.21 | 49 | 231 | |
| NGC 4593 | 3.7 | 17 | 5.0 | M | M | 0.74 | 218 | 294 | |
| NGC 5548 | 3.2 | 58 | 4.6 | NP | G | 0.70 | 55 | 79 | |
| NGC 7213 | 3.8 | 7.5 | NP | G | 0.51 | ||||
| NGC 7469 | 3.7 | 58 | 23.0 | NP | G | 0.16 | 64 | 397 | |
| Seyfert 2 | |||||||||
| IC 5063 | 370 | 1.0 | 93 | S | 11 | ||||
| MCG-5-23-16 | 20 | 3.0 | 23 | 15.0 | S | R | 0.20 | 131 | 652 |
| Mrk 3 | 810 | 1.0 | 347 | 8.1 | S | G | 0.13 | 3 | 23 |
| Mrk 348 | 133 | 1.3 | 42 | 8.6 | S | G | 0.15 | 30 | 205 |
| NGC 2110 | 25 | 3.5 | 17 | 5.6 | S | R | 0.62 | 204 | 329 |
| NGC 2992 | 19 | 1.6 | 91 | 7.3 | S | G | 0.22 | 18 | 80 |
| NGC 4388 | 380 | 1.4 | 48 | 8.6 | I | R | 0.16 | 29 | 179 |
| NGC 4507 | 593 | 1.6 | 110 | 6.5 | S | G | 0.25 | 15 | 59 |
| NGC 526A | 23 | 1.0 | 27 | S | 38 | ||||
| NGC 5506 | 39 | 5.5 | 45 | 20.4 | S | R | 0.27 | 122 | 453 |
| NGC 7314 | 6 | 2.9 | 6.1 | S | 477 | ||||
| Area | F lim | Gal | AGN 1 | AGN 2 | |||
| m | deg2 | Jy | |||||
| ELAIS | 15 | 20 | 1000 | 1300 | 50 | 200 | 0.2 |
| CAM T | 15 | 1.5 | 200 | 1100 | 40 | 100 | 0.6 |
| CAM T | 15 | 0.25 | 100 | 360 | 15 | 50 | 0.84 |
| CAM T | 6.7 | 0.25 | 40 | 600 | 20 | 60 | 0.9 |