Scattered Nuclear Continuum and Broad H in Cygnus A
Abstract
We have discovered scattered broad Balmer emission lines in the spectrum of Cygnus A, using the Keck II telescope. Broad H appears in polarized flux from components on either side of the nucleus, and to a lesser extent in the nucleus. The full-width at half-maximum of broad H is 26,000 km s-1, comparable to the widest emission lines seen in broad-line radio galaxies. Scattered AGN light provides a significant contribution to the total flux at 3800 Å (rest) of the western component, where the polarization rises to 16%. The spatially integrated flux of Cygnus A at 5500 Å can be decomposed into an elliptical galaxy fraction (=0.70), a highly polarized blue component (FC1=0.15), a less polarized red component (FC=0.09), and a contribution from the nebular continuum (0.06). Imaging polarimetry shows a double fan of polarization vectors with circular symmetry which corresponds to the ionization cone seen in HST images. Our results are consistent with scattering of light from a hidden quasar of modest luminosity by an extended, dusty narrow-line region.
1 Introduction
In recent years there has been considerable interest in the unification of active galaxies. In part this was stimulated by the discovery (Antonucci & Miller (1985)) that the nucleus of the Seyfert 2 galaxy NGC 1068 contains a broad-line region (BLR) obscured from direct view, but visible in scattered light. This result gives support to the hypothesis that Seyfert type 1 and type 2 galaxies are the same kind of object seen from different aspects. Barthel (1989) extends this picture to quasars and radio galaxies, proposing that narrow-line radio galaxies (NLRG) of Fanaroff-Riley type 2 contain quasars that are obscured from our viewing direction. He finds that this hypothesis is consistent with the relative numbers of quasars and appropriate radio galaxies in the 3C catalogue if the quasar is visible from any direction within a cone of half-opening angle about . Beyond that cone the optical continuum source and BLR would be obscured from direct view.
Attempts to detect hidden BLR in radio galaxies have had some success (e.g., 3C 234, Antonucci (1984) and Tran, Cohen, & Goodrich (1995); 3C 321, Young et al. (1996)). High polarization perpendicular to the radio axis and broad Mg II suggest the presence of hidden quasars in high redshift radio galaxies as well (e.g., di Serego Alighieri, Cimatti, & Fosbury (1994); Cimatti et al. (1996)). According to the Barthel hypothesis, the prototypical NLRG containing the exceptionally strong radio source Cygnus A (3C 405) should harbor an obscured quasar. Djorgovski et al. (1991) present evidence from infrared observations that Cygnus A does contain a luminous quasar. Imaging polarimetry by Tadhunter, Scarrott, & Rolph (1990) suggests that there is an extended region which scatters light from a hidden nucleus. Broad Mg II is detected by Antonucci, Hurt, & Kinney (AHK, 1994) in the ultraviolet. In spite of considerable effort (e.g., Goodrich & Miller (1989); Jackson & Tadhunter (1993)), previous attempts to detect broad lines in polarized flux have been unsuccessful. In this Letter we present spectropolarimetry from the Keck II Telescope that shows broad lines seen in scattered light originating from an obscured nuclear region. Cygnus A does indeed contain an obscured AGN with broad permitted lines, giving additional weight to the radio galaxy–quasar unification hypothesis. Section 2 summarizes the observations, and §3 and §4 present the results and their implications, respectively.
2 Observations and Reductions
We observed Cygnus A with the LRIS polarimeter on 1996 October 4 and 5 with the Keck II Telescope (four nights after scientific commissioning). The first night of observations included one hour of band imaging polarimetry. On the second night 2.2 hours of spectropolarimetry were taken with a 300 line mm-1 grating blazed at 5000 Å. A slit was placed at a position angle of to include the highly polarized western knot, the eastern knot, and the nuclear knot. This slit location (indicated in Fig. 1) is nearly along the radio axis, which is at on kpc scales. The data are reduced using standard procedures (Miller, Robinson, & Goodrich (1988); Cohen et al. (1997)). Prior to calculating the Stokes parameters (, ), the flux was binned by 4 pixels to improve the signal-to-noise ratio (SNR), which drops below 3.0 for at 7200 Å (rest). The fractional polarization () is estimated by rotating the Stokes parameters. The spectroscopy is calibrated using BD as a flux standard and HD 155528 as a polarimetric standard. On the first night the telescope would not come to a sharp focus so stellar images are elongated NW-SE with a seeing ellipse of . The seeing in the spectra is along the slit. There were patchy cirrus clouds on the first night and photometric conditions on the second night.

The Galactic interstellar reddening is determined from a star east of Cygnus A which was also on the slit. We classify this star as an F9V main sequence star using standard templates (Jacoby, Hunter, & Christian (1984)) and derive a reddening index of from the Cardelli, Clayton, & Mathis (1989) curve. The corresponding extinction is magnitudes. After correcting for extinction, the spectroscopic distance to the star is 6.0 kpc (610 pc above the Galactic plane), making it a good probe of Galactic reddening. Our value for is significantly greater than the average (0.36) given by Spinrad & Stauffer (1982) for galaxies within of Cygnus A. However, it is consistent with reddening estimates obtained by Tadhunter (1996) from the Cygnus A line ratio .
We correct our spectra for Galactic reddening, then subtract a scaled template derived from the elliptical galaxy NGC 821. The best fit for the galaxy fraction at 5500 Å is , obtained using the procedure of Tran (1995a). Interstellar Na I D absorption in our Galaxy shows an equivalent width in the presubtracted spectrum of Å, broadly consistent with the Galactic reddening (Bica & Alloin (1986)). We do not correct the data for interstellar polarization, which is expected to be small in the band (Jackson & Tadhunter (1993)). A correction of 0.5% would rotate most of the Cygnus A polarization vectors by about .
3 Results
Figure 1 shows the imaging polarimetry of Cygnus A. This band image reveals two fans of scattered polarized light, with the symmetry of the vectors clearly indicating a central source. After considering the effects of seeing, the scattered light cone matches the ionization cone with half-opening angle seen in the HST image of Jackson et al. (1996, JTS). The outline of this cone is shown in Figure 1, with the apex chosen to be consistent () with the polarization pattern and the HST image. The -band polarization peaks at at the position of the western knot in the HST image by JTS. The intrinsic polarization of this knot must be even greater after correcting for unpolarized galaxy light.
We present the spectropolarimetry in Figures 2 and 3. Figure 2 shows the flux and polarization spectra integrated along of the slit. rises from 1% in the red to 6% in the blue, and there is a broad rise in centered on H. drops in the narrow lines, which have at . In polarized flux (Fig. 3), the narrow lines are redshifted km s-1, with the redshift greatest in the high ionization lines in the eastern cone. The polarized narrow lines are not broadened, suggesting that their polarization is at least partly due to dust scattering in an outflowing wind, analogous to the phenomenon observed in planetary nebulae (Walsh & Clegg (1994)). However, transmission through dust in our Galaxy and Cygnus A may affect the narrow line polarization.
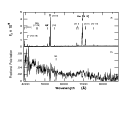
Separate spectra of the eastern, western and nuclear components are extracted using widths of , , and , respectively. The galaxy fractions at 5500 Å in the eastern and western components are and , respectively. Broad lines are visible in the dereddened polarized flux spectra (Fig. 3c, d) and in the dereddened, galaxy subtracted total flux (Fig. 3a, b) of the eastern and western components. Broad lines are also present in the nuclear component at a lower level. Broad H has a Galactic extinction-corrected total flux of and a full-width at half-maximum (FWHM) of km s-1 in both the eastern and western components. This is extremely broad, similar to the broadest radio galaxy emission lines (e.g., 3C 332, Eracleous & Halpern (1994)). Broad H is also visible in the polarized flux of the western component (Fig. 3d). The polarization of the western component rises to 16% at 3800 Å, suggesting that a large fraction of the continuum is scattered light.

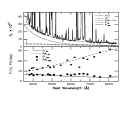
Our high quality spectra of Cygnus A display emission lines with a wide range of ionization. Identifications are made of [Fe III], [Fe V], [Fe VI], [Fe VII] and [Fe XI] but the feature at 5305 Å can probably be attributed to [Ca V] rather than [Fe XIV], and there is only a marginal detection of [Fe X] 6375. The most significant changes in relative line intensity with position along the slit are for [Fe VII] and [Fe XI], which are stronger to the east of the nucleus (Fig. 3).
4 Discussion
4.1 Hidden AGN
The symmetric pattern of polarization vectors in the imaging polarimetry strongly suggests that we are seeing light from the central AGN scattered by material inside a bi-cone of illumination defined by an obscuring torus. While Tadhunter et al. (1990) found in band, perpendicular to the radio axis, and concluded that Cygnus A is a “giant reflection nebula”, the much higher degree of polarization (11%) and greatly improved resolution in our -band map make a stronger case for this interpretation. VLBI observations of the jet/counterjet flux ratio (Carilli & Barthel (1996) and references therein) constrain the inclination of the jet to , and show that the western side is in front of the eastern side. We obtain an independent estimate of the inclination by assuming that the radio and ionization cone axes coincide and that the line-of-sight must be outside this cone for the nucleus to remain hidden. In this case, the cone half-angle lies in the range , consistent with the Barthel (1989) hypothesis; and the inclination lies in the range , which matches the VLBI constraints. Forward scattering by dust should increase the contribution of scattered light in the front cone relative to the unpolarized components, thereby raising the fractional polarization in the west.
Seen in polarized flux (Fig. 3), Cygnus A resembles a broad-line AGN . The observed ratio of broad H to broad Mg II (see AHK) in the eastern component is 2.0, which becomes 0.38 after correcting for Galactic reddening. Typical quasar ratios are 2-3 (Francis et al. (1991); Osterbrock (1989)), suggesting that the broad lines are scattered by dust with efficiency following a law. However, the H FWHM (in km s-1) is 3.5 times that measured for Mg II by AHK, making the comparison of these lines questionable. The broad lines are reflected from extended material at , making variability an unlikely explanation of previous H nondetections. Instead, the unusually large width of H and large galaxy fraction probably led to previous underestimates of upper limits to the H flux.
4.2 Spectral Fitting
The variation of and across the spectrum of Cygnus A can be characterized with three differently polarized continuum components, each with a wavelength independent and (Fig. 4). There is a nebular continuum computed from the observed (Galactic extinction corrected) H narrow line flux of . This is then reddened by and given the same and as the narrow emission lines. The remaining flux is attributed to a scattered continuum, FC1, polarized similarly to broad H and another featureless continuum (FC) which is redder and has lower polarization at a different . Note that FC is different from the FC2 component invoked to explain the polarization behavior of other AGN (Tran 1995b ; Tran, Cohen, & Goodrich (1995)) because it is polarized. Figure 4 shows the result of the continuum component fitting to the spatially integrated spectropolarimetric data. The blueness and high polarization of FC1 is consistent with dust scattering. The redder FC component could include locally scattered and/or dichroically absorbed radiation from hot young stars associated with the knotty structures seen in the HST image (JTS) and analogous to the polarized radiation seen in the dust band in Centaurus A (Scarrott et al. (1996)).
The colors of the total and polarized flux vary dramatically between the eastern and western components (Fig. 3). The polarized flux is bluer in the western component than in the eastern component, but the opposite is true of the total flux spectra. The spectral indices (4000 Å8000 Å, rest) of the total flux from the eastern and western components after dereddening and galaxy subtraction are and , respectively, but a single power law () is not a good fit. Models of the spatially separated components will be given in a later paper, but a fit to the full data set shows that FC1 dominates in the blue and in the western lobe, while the other FC component dominates in the red and in the eastern lobe. Furthermore, there must be significant internal reddening of both FC1 and FC in the western lobe but little in the east.
4.3 Luminosity of the Hidden AGN
Cygnus A contains a broad-line AGN, but is it luminous enough to be classified as a quasar? We estimate the absolute magnitude () of the central source from the highly polarized flux scattered by the western knot. For optically thin scattering,
where is the absolute magnitude of the polarized flux, is the central source covering fraction, is the scattering optical depth, is the intrinsic polarization of the scattered light, and is the extinction. We measure (rest band) for the western component, assuming a Hubble constant of 73 km s-1 Mpc-1 and correcting for Galactic extinction. The polarization of the scattered light is at least as great as the measured value in the rest band, . The source covering fraction of the western knot is estimated to be from the JTS image. Using these values we find .
An optical depth or extinction would elevate Cygnus A to the status of a quasar (), but it would still be weak compared to other hidden quasars such as 3C 234 and 3C 265 (Tran et al. 1995; Cohen et al. (1996)). This agrees with Tadhunter (1996) who concludes that Cygnus A contains a “feeble” hidden AGN. In addition, the far-infrared luminosity of Cygnus A is extremely weak for its radio lobe power (see, e.g., Barthel & Arnaud (1996)). So while Cygnus A may qualify as a quasar, it is probably a modest one.
5 Conclusions
Cygnus A, the prototypical narrow-line radio galaxy and by far the most powerful radio source out to a redshift , contains a hidden broad-line AGN. The double fan of centrosymmetric polarization vectors seen in imaging polarimetry clearly indicates a scattering origin, and corresponds to the ionization cone seen in HST images. AGN light is reflected from material which has a direct view of the central source. Spectropolarimetry reveals broad H and H emission lines and a blue continuum (FC1) seen in scattered light in the eastern and western fans. This confirms the radio galaxy-quasar unification by orientation hypothesis. The ratio of broad lines, blueness of FC1, and narrow line polarization are all consistent with scattering by dust. We also find a second polarized continuum (FC), which is redder than FC1 and has a different . The luminosity of the central source is still uncertain, but appears to be weak for its radio power.
References
- Antonucci (1984) Antonucci, R. R. J. 1984, ApJ, 278, 499
- Antonucci & Miller (1985) Antonucci, R. R. J., & Miller, J. S. 1985, ApJ, 297, 621
- Antonucci, Hurt, & Kinney (1994) Antonucci, R., Hurt, T., & Kinney, A. 1994, Nature, 371, 313 (AHK)
- Barthel (1989) Barthel, P. D. 1989, ApJ, 336, 606
- Barthel & Arnaud (1996) Barthel, P. D., & Arnaud, K. A. 1996, MNRAS, 283, L45
- Bica & Alloin (1986) Bica, E., & Alloin, D. 1986, A&A, 166, 83
- Cardelli, Clayton, & Mathis (1989) Cardelli, J. A, Clayton, G. C., & Mathis, J. S. 1989, ApJ, 345, 245
- Carilli & Barthel (1996) Carilli, C. L., & Barthel, P. D. 1996, A&AR, 7, 1
- Cimatti et al. (1996) Cimatti, A., Dey, A., Van Breugel, W., Antonucci, R., & Spinrad, H. 1996, ApJ, 465, 145
- Cohen et al. (1996) Cohen, M. H., Tran, H. D., Ogle, P. M., & Goodrich, R. W. 1996, in Extragalactic Radio Sources, ed. R. Ekers, (IAU Conference 175), 223
- Cohen et al. (1997) Cohen, M. H., Vermeulen, R. C., Ogle, P. M., Tran, H. D., & Goodrich, R. W. 1997, ApJ, 484.
- di Serego Alighieri, Cimatti, & Fosbury (1994) di Serego Alighieri, S., Cimatti, A., & Fosbury, R. A. E. 1994, ApJ, 431, 123
- Djorgovski et al. (1991) Djorgovski, S., Weir, N., Matthews, K., & Graham, J. R. 1991, ApJ, 372, L67
- Eracleous & Halpern (1994) Eracleous, M., & Halpern, J. P. 1994, ApJS, 90, 1
- Francis et al. (1991) Francis, P. J., Hewett, P. C., Foltz, C. B., Chaffee, F. H., Weymann, R. J., & Morris, S. L. 1991, ApJ, 373, 465
- Goodrich & Miller (1989) Goodrich, R. W., & Miller, J. S. 1989, ApJ, 346, L21
- Jackson & Tadhunter (1993) Jackson, N., & Tadhunter, C. N. 1993, A&A, 272, 105
- Jackson et al. (1996) Jackson, N., Tadhunter, C., Sparks, W. B., Miley, G. K., & Macchetto, F. 1996, A&A, 307, L29 (JTS)
- Jacoby, Hunter, & Christian (1984) Jacoby, G. H., Hunter, D. A., & Christian, C. A. 1984, ApJS, 56, 257
- Miller, Robinson, & Goodrich (1988) Miller, J. S., Robinson, L. B., & Goodrich, R.W. 1988, in Instrumentation of Ground-Based Astronomy, ed. L.B. Robinson (New York, Springer), 157
- Osterbrock (1989) Osterbrock, D. E. 1989, Astrophysics of Gaseous Nebulae and Active Galactic Nuclei (Mill Valley, California: University Science Books)
- Scarrott et al. (1996) Scarrott, S. M., Foley, N. B., Gledhill, T. M., & Wolstencroft, R. D. 1996, MNRAS, 282, 252
- Spinrad & Stauffer (1982) Spinrad, H., & Stauffer, J. R. 1982, MNRAS, 200, 153
- Tadhunter, Scarrott, & Rolph (1990) Tadhunter, C. N., Scarrott, S.M., & Rolph, C. D. 1990, MNRAS, 236, 163
- Tadhunter (1996) Tadhunter, C. 1996, in Cygnus A–Study of a Radio Galaxy, ed. Carilli, C. L., & Harris, D.E. (Cambridge University Press), 33
- (26) Tran, H. D. 1995a, ApJ, 440, 565
- (27) Tran, H. D. 1995b, ApJ, 440, 597
- Tran, Cohen, & Goodrich (1995) Tran, H. D., Cohen, M. H., & Goodrich, R. W. 1995, AJ, 110, 2597
- Walsh & Clegg (1994) Walsh, J. R., & Clegg, R. E. S. 1994, MNRAS, 268, L41
- Young et al. (1996) Young, S., Hough, J. H., Efstathiou, A., Wills, B. J., Axon, D. J., Bailey, J. A., & Ward, M. J. 1996, MNRAS, 279, L72