Multiwavelength optical observations of chromospherically active binary systems
Abstract
This is the first paper of a series aimed at studying the chromosphere of active binary systems using the information provided for several optical spectroscopic features. Simultaneous H, Nai D1, D2, and Hei D3 spectroscopic observations are reported here for 18 systems. The chromospheric contribution in these lines have been determined using the spectral subtraction technique. Very broad wings have been found in the subtracted H profile of some of the more active stars. These profiles are well matched using a two-components Gaussian fit (narrow and broad) and the broad component could be interpreted as arising from microflaring. Prominence-like extended material have been detected in a near-eclipse H observation of the system AR Lac. The excess emission found in the Nai D1 and D2 lines by application of the spectral subtraction technique and the behaviour of the H line in the corresponding simultaneous observations indicate that the filling-in of the core of these lines is a chromospheric activity indicator. For giant stars of the sample the Hei D3 line has been detected in absorption in the subtracted spectra. An optical flare has been detected in UX Ari and II Peg through the presence of the Hei D3 in emission in coincidence with the enhancement of the H emission.
Key words: stars: activity – stars: binaries: close – stars: chromospheres – stars: flare – stars: late-type
1 Introduction
The chromospherically active binaries are detached binary systems with cool components characterized by strong chromospheric, transition region, and coronal activity. The RS CVn systems have at least one cool evolved component whereas both components of the BY Dra binaries are main sequence stars (Fekel et al. 1986).
In this series of papers we try to study the chromosphere of this kind of extremely active stars using the information provided by several optical spectroscopic features that could be used as chromospheric activity indicators. The simultaneous observations of different lines, that are formed at different height in the chromosphere (from the region of temperature minimum to the higher chromosphere), are of special interest for stellar activity studies since they provide very useful information about this stellar region. Ideally, simultaneous observations should be performed at all wavelengths in order to develop a coherent 3-D atmosphere model. In practice, simultaneous observations of several activity indicators are rare and tend to focus on the same small number of extremely active systems.
The best way to obtain the active-chromosphere contribution to some spectral line in the chromospherically active binaries is to subtract the underlying photospheric contribution using the spectral subtraction technique (subtraction of a synthesized stellar spectrum constructed from artificially rotationally broadened, radial-velocity shifted, and weighted spectra of inactive stars chosen to match the spectral types and luminosity classes of both components of the active system under consideration)
The emissions in the Caii H & K resonance lines are the most widely used optical indicators of chromospheric activity, since their source functions are collisionally controlled and represent an extremely important cooling mechanism. In chromospheric active binaries the subtraction of the photospheric flux in this spectral region has been recently applied using the spectral subtraction (see Montes et al. 1995c, 1996a and references therein).
The H line is also an important chromospheric activity indicator, but it is only in emission above the continuum in very active stars, and in less active star only a filled-in absorption line is observed. So, to infer chromospheric activity level the spectral subtraction is needed (see Montes et al. 1994; 1995a; b; d, and references therein; Lázaro & Arévalo 1996). A similar behaviour is observed in the other Balmer lines (Hall & Ramsey 1992; Montes et al. 1995d).
Recently, the spectral subtraction technique has been used in other lines as the Caii IRT, Mgi b, Nai D1, D2, and Hei D3 lines (Gunn & Doyle 1996; Gunn et al. 1996). The Caii IRT lines are formed deeper in the atmosphere and are thus sensitive probes of the temperature minimum region. The Nai D1, D2 lines are collision dominated and are good indicators of changes in the lower chromosphere. The Mgi b triplet lines are formed in the lower chromosphere and the region of temperature minimum and they are good diagnostics of photospheric activity (Basri et al. 1989). The Hei D3 line has been largely ignored as activity indicator; however it could be a valuable probe of stellar activity and the observation of this line in emission supports the detection of flare like events (Zirin 1988).
In this first paper we focus our study on the analysis of the extensively used H chromospheric activity indicator together with simultaneous observations of the less studied Hei D3 and Nai D1, D2 spectral features in a sample of 18 northern active binary systems selected from ”A Catalog of Chromospherically Active Binary Stars (second edition)” (Strassmeier et al. 1993, hereafter CABS). By using the spectral subtraction technique, we have determined the excess emission in these lines and we have computed absolute chromospheric fluxes in H. The primary aim of this study is analyse in detail the excess H emission and to study the subtracted H line profile, especially in some extremely active stars which exhibit broad wings. Moreover, we try to understand the behaviour of the Hei D3 and Nai D1, D2 lines as chromospheric activity indicators taking into account the advantage that we simultaneously know the behaviour of the chromospheric excess H emission in these systems. In forthcoming papers we will analyze in detail several optical spectroscopic features using echelle spectroscopy in order to determine the effects of stellar activity on spectral lines originating at different heights in the chromosphere. Another of our goals is to obtain information about the presence of extended matter (prominence-like structures) in the chromospheric active binaries using simultaneous H and H observations at near-eclipse orbital phases.
In Sect.2 we give the details of our observations and data reduction. In Sect.3 we describe the individual results of H, Nai D1, D2, and Hei D3 line observations of our sample. Finally in Sect.4 we discuss our results.
| Name | H line region | NaI D1, D2, HeI D3 line region | Previous obs. | |||||||||
|---|---|---|---|---|---|---|---|---|---|---|---|---|
| Date | UT | S/N | Date | UT | S/N | H | Ca II | |||||
| BD Cet | 1995/09/15 | 00:43 | 0.569 | 330 | 1995/09/15 | 01:03 | 0.569 | 361 | - | 95c,96a | ||
| AY Cet | 1995/09/15 | 02:03 | 0.797 | 385 | 1995/09/15 | 02:20 | 0.797 | 398 | - | 95c,96a | ||
| AR Psc | 1995/09/13 | 01:48 | 0.373 | 387 | 1995/09/13 | 01:27 | 0.372 | 141 | 94,95a | 94,96a | ||
| ” | 1995/09/14 | 01:42 | 0.443 | 361 | 1995/09/14 | 02:00 | 0.443 | 369 | - | - | ||
| ” | 1995/09/15 | 03:55 | 0.519 | 392 | 1995/09/15 | 04:23 | 0.520 | 399 | - | - | ||
| ” | 1995/09/15 | 05:34 | 0.524 | 305 | 1995/09/15 | 05:28 | 0.523 | 359 | - | - | ||
| HD 12545 | 1995/09/15 | 02:59 | 0.401 | 354 | 1995/09/15 | 02:25 | 0.400 | 361 | - | 95c,,96a | ||
| UX Ari | 1995/09/13 | 02:08 | 0.419 | 346 | 95b | 95c,96a | ||||||
| ” | 1995/09/13 | 05:08 | 0.438 | 202 | 1995/09/13 | 04:52 | 0.437 | 494 | - | - | ||
| ” | 1995/09/14 | 02:24 | 0.576 | 276 | 1995/09/14 | 02:09 | 0.574 | 293 | - | - | ||
| ” | 1995/09/15 | 03:09 | 0.736 | 352 | 1995/09/15 | 03:32 | 0.739 | 410 | - | - | ||
| V711 Tau | 1995/09/13 | 05:15 | 0.922 | 360 | 1995/09/13 | 05:36 | 0.927 | 370 | 94,95a | 94,96a | ||
| ” | 1995/09/14 | 04:19 | 0.261 | 374 | 1995/09/14 | 04:35 | 0.265 | 423 | - | - | ||
| ” | 1995/09/14 | 05:35 | 0.280 | 332 | 1995/09/14 | 05:50 | 0.283 | 386 | - | - | ||
| ” | 1995/09/15 | 03:50 | 0.606 | 342 | 1995/09/15 | 03:44 | 0.605 | 332 | - | - | ||
| ” | 1995/09/15 | 06:11 | 0.641 | 314 | 1995/09/15 | 06:05 | 0.639 | 326 | - | - | ||
| V833 Tau | 1995/09/13 | 06:13 | 0.762 | 184 | 1995/09/15 | 05:47 | 0.752 | 325 | 95b | - | ||
| ” | 1995/09/14 | 06:07 | 0.319 | 424 | 1995/09/14 | 05:55 | 0.314 | 417 | - | - | ||
| ” | 1995/09/15 | 04:56 | 0.851 | 394 | 1995/09/15 | 05:18 | 0.859 | 322 | - | - | ||
| V1149 Ori | 1995/09/15 | 06:17 | 0.439 | 311 | 1995/09/15 | 06:29 | 0.439 | 335 | 95b | 95c,96a | ||
| MM Her | 1995/09/12 | 20:56 | 0.498 | 274 | 1995/09/12 | 21:31 | 0.501 | 329 | 94,95a | 94,96a | ||
| ” | 1995/09/13 | 22:06 | 0.630 | 332 | 1995/09/13 | 20:45 | 0.623 | 384 | - | - | ||
| ” | 1995/09/14 | 20:09 | 0.745 | 257 | 1995/09/14 | 20:41 | 0.748 | 314 | - | - | ||
| V815 Her | 1995/09/12 | 20:43 | 0.978 | 360 | 1995/09/12 | 20:21 | 0.970 | 341 | 94,95a | 94,96a | ||
| ” | 1995/09/13 | 20:15 | 0.520 | 375 | 1995/09/13 | 20:22 | 0.523 | 341 | - | - | ||
| ” | 1995/09/14 | 21:24 | 0.099 | 354 | 1995/09/14 | 21:44 | 0.107 | 394 | - | - | ||
| BY Dra | 1995/09/13 | 22:58 | 0.684 | 387 | 1995/09/13 | 23:15 | 0.686 | 372 | - | 94,96a | ||
| ” | 1995/09/14 | 21:56 | 0.839 | 398 | 1995/09/14 | 21:05 | 0.838 | 404 | - | - | ||
| V775 Her | 1995/09/14 | 22:03 | 0.394 | 342 | 1995/09/14 | 21:53 | 0.392 | 373 | 94,95a | 94,96a | ||
| V478 Lyr | 1995/09/14 | 22:14 | 0.953 | 326 | 1995/09/14 | 22:33 | 0.959 | 412 | - | 94,96a | ||
| HK Lac | 1995/09/12 | 22:56 | 0.067 | 343 | 1995/09/12 | 22:42 | 0.067 | 357 | 94,95a | 94,96a | ||
| ” | 1995/09/13 | 00:42 | 0.070 | 130 | 1995/09/13 | 00:25 | 0.070 | 193 | - | - | ||
| ” | 1995/09/13 | 23:44 | 0.110 | 346 | 1995/09/13 | 23:58 | 0.110 | 343 | - | - | ||
| ” | 1995/09/14 | 01:37 | 0.113 | 332 | 1995/09/14 | 01:21 | 0.113 | 264 | - | - | ||
| ” | 1995/09/14 | 22:53 | 0.149 | 321 | 1995/09/14 | 23:09 | 0.149 | 339 | - | - | ||
| ” | 1995/09/15 | 01:26 | 0.153 | 329 | 1995/09/15 | 01:21 | 0.153 | 358 | - | - | ||
| AR Lac | 1995/09/12 | 22:16 | 0.405 | 360 | 1995/09/12 | 21:57 | 0.399 | 421 | 94,95a | 94,96a | ||
| ” | 1995/09/13 | 23:39 | 0.939 | 346 | 1995/09/13 | 23:23 | 0.933 | 415 | - | - | ||
| ” | 1995/09/14 | 22:49 | 0.425 | 339 | 1995/09/14 | 22:42 | 0.423 | 407 | - | - | ||
| KZ And | 1995/09/14 | 23:29 | 0.145 | 336 | 1995/09/14 | 23:51 | 0.150 | 367 | - | 94,95c,96a | ||
| KT Peg | 1995/09/13 | 00:07 | 0.693 | 221 | 1995/09/13 | 00:13 | 0.694 | 271 | - | 95c,96a | ||
| ” | 1995/09/15 | 01:19 | 0.024 | 313 | 1995/09/15 | 01:13 | 0.023 | 368 | - | - | ||
| II Peg | 1995/09/12 | 23.02 | 0.575 | 300 | 1995/09/12 | 23:23 | 0.577 | 298 | - | - | ||
| ” | 1995/09/13 | 00:58 | 0.587 | 138 | 1995/09/13 | 01:18 | 0.589 | 240 | - | - | ||
| ” | 1995/09/14 | 00:57 | 0.735 | 265 | 1995/09/14 | 01:14 | 0.737 | 324 | - | - | ||
| ” | 1995/09/14 | 03:07 | 0.749 | 315 | 1995/09/14 | 02:51 | 0.747 | 328 | - | - | ||
| ” | 1995/09/14 | 05:00 | 0.760 | 266 | 1995/09/14 | 05:16 | 0.762 | 263 | - | - | ||
| ” | 1995/09/14 | 23:22 | 0.874 | 318 | 1995/09/14 | 23:15 | 0.873 | 324 | - | - | ||
| ” | 1995/09/15 | 01:56 | 0.890 | 332 | 1995/09/15 | 01:49 | 0.889 | 352 | - | - | ||
| ” | 1995/09/15 | 04:38 | 0.907 | 298 | 1995/09/15 | 04:31 | 0.906 | 311 | - | - | ||
94: Fernández-Figueroa et al. (1994), 95a: Montes et al. (1995a), 95b: Montes et al. (1995b), 95c: Montes et al. (1995c), 96a: Montes et al. (1996a),
| HD | Name | Tsp | SB | R | d | V-R | Porb | Prot | Vsini |
|---|---|---|---|---|---|---|---|---|---|
| (R⊙) | (pc) | (days) | (days) | (km s-1) | |||||
| 1833 | BD Cet | K1III | 1 | 10 | 71 | 0.81 | 35.1 | 34.46 | 15 |
| 7672 | AY Cet | WD/G5III | 1 | 0.012/15 | 66.7 | 0.69 | 56.824 | 77.22 | 4 |
| 8357 | AR Psc | G7V/K1IV1 | 2 | /1.5 | 17 | 0.741 | 14.302261 | 12.245 | 6.5/3.51 |
| 12545 | XX Tri | K0III | 1 | 8 | 310 | [0.62] | 23.9824 | 24.3 | 17 |
| 21242 | UX Ari | G5V/K0IV | 2 | 0.93/4.7 | 50 | 0.70/0.54 | 6.43791 | Porb | 6/37 |
| 22468 | V711 Tau | G5IV/K1IV | 2 | 1.3/3.9 | 36 | 0.62/0.75 | 2.83774 | 2.841 | 13/38 |
| 283750 | V833 Tau | dK5e | 1 | 0.22 | 16.7 | 0.69 | 1.7878 | 1.797 | 6.3 |
| 37824 | V1149 Ori | K1III | 1 | 11 | [164] | 0.90 | 53.58 | 54.1 | 11 |
| 341475 | MM Her | G2/K0IV | 2 | 1.58/2.83 | 190 | [/0.64] | 7.960322 | 7.936 | 10/18 |
| 166181 | V815 Her | G5V/[M1-2V] | 1 | 0.93:/ | 31 | 0.54 | 1.8098368 | 1.8 | 27/ |
| 234677 | BY Dra | K4V/K7.5V | 2 | 1.2-1.4/ | 15.6 | 1.10 | 5.975112 | 3.827 | 8.0/7.4 |
| 175742 | V775 Her | K0V/[K5-M2V] | 1 | 0.85/ | 24 | 0.80 | 2.879395 | 2.898 | 15/ |
| 178450 | V478 Lyr | G8V/[dK-dM] | 1 | 0.9 | 26 | 0.65 | 2.130514 | 2.185 | 21/ |
| 209813 | HK Lac | F1V/K0III | 1 | - | 150 | 0.75 | 24.4284 | 24.4284 | /15 |
| 210334 | AR Lac | G2IV/K0IV | 2 | 1.8/3.1 | 47 | 0.77 | 1.98322195 | 1.98322195 | 46/81 |
| 218738 | KZ And | dK2/dK2 | 2 | 0.74/ | [23] | [0.74/0.74] | 3.032867 | 3.03 | 12.3/11.6 |
| 222317 | KT Peg | G5V/K6V | 2 | 0.93/0.72 | 25 | [0.54/ ] | 6.20199 | 6.092 | 8/5 |
| 224085 | II Peg | K2-3V-IV | 1 | 2.2 | 29.4 | 0.89 | 6.724183 | 6.718 | 21 |
1 Parameters from Fekel (1996)
2 Observations and Data Reduction
Observations in the H and Nai D1, D2, Hei D3 line regions have been obtained during three nights (1995 September 13-15) with the Isaac Newton Telescope (INT) at the Observatorio del Roque de Los Muchachos (La Palma, Spain) using the Intermediate Dispersion Spectrograph (IDS) with grating H1800V, camera 500 and a 1024x1024 pixel TEK3 CCD as detector. The reciprocal dispersion achieved is 0.24Å/pixel which yields a spectral resolution of 0.48Å and a useful wavelength range of 250Å centered at 6563Å (H) and 5876Å (Hei D3) respectively.
The spectra have been extracted using the standard reduction procedures in the IRAF package (bias subtraction, flat-field division, and optimal extraction of the spectra). The wavelength calibration was obtained by taking spectra of a Cu-Ar lamp. Finally, the spectra have been normalized by a polynomial fit to the observed continuum.
In Table1 we give the observing log. For each star we list the date, UT, orbital phase () and signal to noise ratio (S/N) obtained for each observation in both spectral regions. Where appropriate, we also give the reference of our previous observation of these systems in the H and Caii H & K lines.
In Table2 we show the HD number, name and the adopted stellar parameters (from CABS or the references given in the table) for the 18 chromospherically active binary systems selected.
We have obtained the chromospheric contribution in H Nai D1, D2, and Hei D3 lines using the spectral subtraction technique described in detail by Montes et al. (1995a,c).
The synthesized spectra were constructed using artificially rotationally broadened, radial-velocity shifted, and weighted spectra of inactive stars chosen to match the spectral types and luminosity classes of both components of the active system under consideration. The reference stars used have been observed in this campaign and previous observational seasons with similar spectral resolution (see the spectral library of Montes et al. 1997).
In some case, the difference spectrum obtained appears noisier than expected from the observation S/N ratio (300) due to small differences in spectral type between active and reference star, or to non appropriate evaluation of the rotational broadening and/or of the Doppler shift. In addition, in some spectra telluric lines also appear in the difference spectrum. This noise in the the difference spectrum have been evaluated as the mean standard deviation () in the regions outside the chromospheric features. We have obtained values of in the range 0.01-0.03 which could be important in low active star but in the more active stars the errors in the excess H EW are small. We have considered as a clear detection of excess emission or absorption in H, Nai D1, D2, and Hei D3 only when these features in the difference spectrum are larger than 3.
Table3 gives the H line parameters, measured in the observed and subtracted spectra of the sample. Column (2) of this Table gives the orbital phase () for each spectrum, and in column (3), H and C mean emission belonging to hot and cool component respectively, and T means that at these phases the spectral features cannot be deblended. Column (4) gives the contributions for the hot and cool component to the total continuum (SH and SC). Column (5) describes the observed H profile, i.e. if the line is in absorption (A) in emission (E) or totally filled by emission (F). Columns (6), (7), (8) give the following parameters measured in the observed spectrum: the full width at half maximum (Wobs); the residual intensity, Rc; and the H core flux, F(1.7Å), measured as the residual area below the central 1.7Å passband. The last four Columns give he following parameters measured in the subtracted spectrum: the full width at half maximum (Wsub), the peak emission intensity (I), the excess H emission equivalent width (EW( H)), and absolute fluxes at the stellar surface logFS(H) obtained with the calibration of Pasquini & Pallavicini (1991) as a function of (V-R), very similar values of FS(H) are obtained using the more recently calibration of Hall (1996) as a function of (V-R) and (B-V). For a more detailed description of the parameters given in this table see our previous study of the excess H emission in active binaries (Montes et al. 1995a).
In Table4 we list the parameters (I, FWHM, EW) of the broad and narrow components used in the two Gaussian components fit to the H subtracted emission profile, which we have performed in the stars that present broad wings. See the comments for each individual star in Sect.3 and the interpretation of these components given in Sect.4.

3 Individual results
In the following we describe the H, Nai D1, D2, and Hei D3 spectra of the stars of this sample. The line profiles of each chromospherically active binary system are displayed in Fig.1 to 19 The name of the star, the orbital phase, and the expected positions of the features for the hot (H) and cool (C) components are given in each figure. For each system we plot the observed spectrum (solid-line), the synthesized spectrum (dashed-line), the subtracted spectrum, additively offset for better display (dotted line) and the Gaussian fit to the subtracted spectrum (dotted-dashed line).
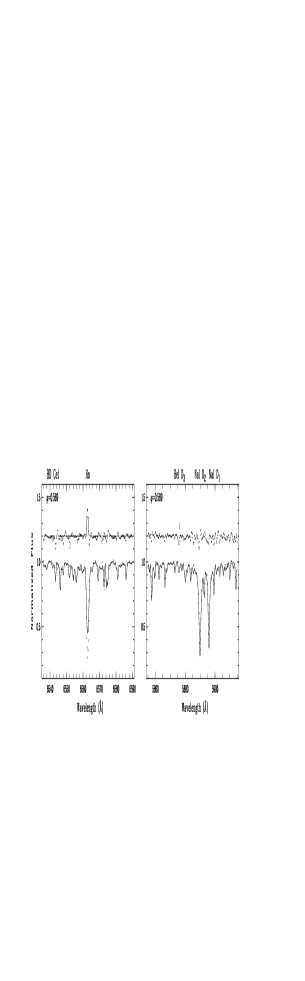
3.1 BD Cet (HD 1833)
Single-lined spectroscopic binary classified as K1III + F by Bidelman & MacConnell (1973). It presents strong Caii H & K emission lines centered at the absorption line (Montes et al. 1995c) and the H line as moderate absorption (Fekel et al. 1986).
We have obtained one spectrum of this system at the orbital phase 0.569 (see Fig.1). The H subtracted spectrum shows a weak excess emission. In the Nai line region no detectable filling-in of the D1 and D2 lines is present. A clear absorption in the Hei D3 line appears in the subtracted spectrum. In both spectral regions the spectrum is matched using a K2III as reference star.
3.2 AY Cet (39 Cet, HD 7672, HR 373)
AY Cet is a single-lined binary composed of a spotted G5III primary and a white dwarf secondary. It presents strong Caii H & K emission lines (Montes et al. 1995c) and a filled in absorption H line (Fekel et al. 1986; Strassmeier et al. 1990).
We present here one observation of this system at the orbital phase 0.797 (see Fig.2). In the H line region we have used a G8III reference star to perform the spectral subtraction and the subtracted spectrum obtained shows a weak excess emission. No detectable filling-in of the Nai D1 and D2 lines has been found, however, a weak absorption in the Hei D3 line appears in the subtracted spectrum.
| Observed H Spectrum | Subtracted H Spectrum | |||||||||||
| Name | E | SH/SC | H | Wobs | Rc | F(1.7Å) | Wsub | I | EW | |||
| (Å) | (Å) | (Å) | ||||||||||
| BD Cet | 0.569 | - | - | A | 1.80 | 0.452 | 0.928 | 0.82 | 0.221 | 0.193 | 5.75 | |
| AY Cet | 0.797 | - | - | A | 1.62 | 0.446 | 0.940 | 1.08 | 0.214 | 0.245 | 6.02 | |
| AR Psc | 0.373 | - | 0.20/0.80 | E | - | 1.065 | 1.715 | 1.47 | 0.599 | 1.071 | 6.58 | |
| ” | 0.443 | - | 0.20/0.80 | E | - | 1.063 | 1.680 | 1.61 | 0.653 | 1.403 | 6.70 | |
| ” | 0.519 | - | 0.20/0.80 | E | - | 1.059 | 1.736 | 1.46 | 0.676 | 1.211 | 6.64 | |
| ” | 0.524 | - | 0.20/0.80 | E | - | 1.070 | 1.755 | 1.47 | 0.687 | 1.263 | 6.66 | |
| XX Tri | 0.401 | - | - | E | 2.68 | 1.387 | 2.301 | 1.80 | 1.089 | 2.599 | 6.92 | |
| UX Ari | 0.419 | C | 0.30/0.70 | E | 1.26 | 1.225 | 1.966 | 1.89 | 0.722 | 1.798 | 6.85 | |
| ” | 0.438 | C | 0.30/0.70 | E | 1.07 | 1.101 | 1.799 | 1.82 | 0.626 | 1.405 | 6.74 | |
| ” | 0.576 | C | 0.30/0.70 | E | 1.41 | 1.159 | 1.818 | 1.83 | 0.609 | 1.476 | 6.76 | |
| ” | 0.736 | C | 0.30/0.70 | E | 3.17 | 1.533 | 2.504 | 2.51 | 0.996 | 3.286 | 7.11 | |
| V711 Tau | 0.922 | C | 0.16/0.84 | E | 3.36 | 1.315 | 2.084 | 2.48 | 0.837 | 2.710 | 6.96 | |
| ” | 0.261 | C | 0.16/0.84 | E | 3.63 | 1.264 | 2.095 | 2.26 | 0.759 | 2.524 | 6.93 | |
| ” | 0.280 | C | 0.16/0.84 | E | 3.51 | 1.255 | 2.081 | 2.24 | 0.763 | 2.421 | 6.92 | |
| ” | 0.606 | C | 0.16/0.84 | E | 2.93 | 1.342 | 2.185 | 2.20 | 0.842 | 2.641 | 6.95 | |
| ” | 0.641 | C | 0.16/0.84 | E | 2.88 | 1.328 | 2.164 | 2.24 | 0.812 | 2.382 | 6.91 | |
| V833 Tau | 0.762 | - | - | E | 1.61 | 1.087 | 1.808 | 1.37 | 0.754 | 1.101 | 6.37 | |
| ” | 0.319 | - | - | E | - | 1.078 | 1.738 | 1.35 | 0.709 | 1.018 | 6.34 | |
| ” | 0.851 | - | - | E | 1.56 | 1.085 | 1.790 | 1.35 | 0.745 | 1.070 | 6.36 | |
| V1149 Ori | 0.439 | - | - | A | 2.00 | 0.476 | 0.953 | 0.91 | 0.269 | 0.259 | 5.75 | |
| MM Her | 0.498 | C | 0.59/0.41 | A | 1.65 | 0.561 | 1.118 | 1.42 | 0.320 | 0.590 | 6.38 | |
| ” | 0.630 | H | 0.50 | A | - | 0.588 | 1.101 | - | 0.000 | 0.000 | 0.00 | |
| C | 0.50 | A | - | 0.846 | 1.490 | 1.46 | 0.302 | 0.541 | 6.34 | |||
| ” | 0.745 | H | 0.50 | A | - | 0.603 | 1.134 | - | 0.000 | 0.000 | 0.00 | |
| C | 0.50 | A | - | 0.831 | 1.476 | 1.41 | 0.270 | 0.494 | 6.30 | |||
| V815 Her | 0.978 | H | - | F | - | 0.878 | 1.508 | 1.75 | 0.535 | 1.279 | 6.95 | |
| ” | 0.520 | H | - | A | - | 0.739 | 1.314 | 1.65 | 0.396 | 0.875 | 6.79 | |
| ” | 0.099 | H | - | A | - | 0.787 | 1.390 | 1.80 | 0.445 | 1.095 | 6.89 | |
| BY Dra | 0.684 | T | 0.70/0.30 | E | 1.39 | 1.202 | 1.919 | 1.357 | ||||
| H | 0.70 | E | 1.36 | 0.540 | 0.780 | 6.20 | ||||||
| C | 0.30 | E | 1.70 | 0.319 | 0.577 | 5.73 | ||||||
| ” | 0.839 | T | 0.70/0.30 | E | 1.70 | 1.270 | 2.039 | 1.455 | ||||
| H | 0.70 | E | 1.38 | 0.548 | 0.803 | 6.22 | ||||||
| C | 0.30 | E | 1.89 | 0.324 | 0.652 | 5.78 | ||||||
| V775 Her | 0.394 | H | - | E | - | 1.044 | 1.719 | 1.39 | 0.745 | 1.103 | 6.51 | |
| C | - | E | - | 1.027 | 1.690 | 1.02 | 0.138 | 0.149 | - | |||
| V478 Lyr | 0.953 | H | - | A | 3.36 | 0.763 | 1.353 | 1.53 | 0.446 | 0.727 | 6.55 | |
| HK Lac | 0.067 | C | - | A | 1.66 | 0.611 | 1.178 | 1.31 | 0.366 | 0.765 | 6.43 | |
| ” | 0.070 | C | - | A | 1.75 | 0.610 | 1.170 | |||||
| ” | 0.110 | C | - | A | 1.61 | 0.657 | 1.243 | 1.32 | 0.411 | 0.887 | 6.49 | |
| ” | 0.113 | C | - | A | 1.61 | 0.647 | 1.237 | |||||
| ” | 0.149 | C | - | A | 1.61 | 0.664 | 1.257 | 1.37 | 0.420 | 0.929 | 6.51 | |
| ” | 0.153 | C | - | A | 1.57 | 0.661 | 1.244 | |||||
| AR Lac | 0.405 | H | 0.36 | A | - | 0.787 | 1.401 | 1.92 | 0.083 | 0.169 | 5.98 | |
| C | 0.64 | A | - | 0.774 | 1.335 | 2.037 | 0.114 | 0.248 | 6.00 | |||
| ” | 0.425 | H | 0.37 | A | - | 0.696 | 1.241 | 1.44 | 0.062 | 0.095 | 5.73 | |
| C | 0.63 | A | - | 0.675 | 1.167 | 0.92 | 0.018 | 0.018 | 4.86 | |||
| ” | 0.939 | H | 0.27 | A | - | - | - | - | - | - | - | |
| C | 0.73 | A | - | - | - | - | 0.050 | 0.104 | 5.59 | |||
| KZ And | 0.145 | 1 | 0.58 | A | 1.81 | 0.780 | 1.404 | 1.06 | 0.209 | 0.237 | 5.94 | |
| 2 | 0.42 | A | - | 0.884 | 1.517 | 1.22 | 0.207 | 0.269 | 5.99 | |||
| KT Peg | 0.693 | C | 0.95/0.05 | A | 1.85 | 0.349 | 0.786 | - | 0.000 | 0.000 | 0.00 | |
| ” | 0.024 | C | 0.95/0.05 | A | 1.77 | 0.354 | 0.792 | - | 0.000 | 0.000 | 0.00 | |
| II Peg | 0.575 | - | - | E | 1.69 | 1.456 | 2.316 | 1.62 | 1.134 | 2.127 | 6.66 | |
| ” | 0.587 | - | - | E | 1.69 | 1.456 | 2.302 | 1.62 | 1.135 | 2.146 | 6.66 | |
| ” | 0.735 | - | - | E | 2.04 | 1.407 | 2.311 | 1.69 | 1.102 | 2.362 | 6.70 | |
| ” | 0.749 | - | - | E | 2.02 | 1.393 | 2.295 | 1.66 | 1.087 | 2.486 | 6.72 | |
| ” | 0.760 | - | - | E | 2.63 | 1.505 | 2.484 | 1.80 | 1.198 | 3.692 | 6.88 | |
| ” | 0.874 | - | - | E | 1.87 | 1.279 | 2.102 | 1.57 | 0.956 | 1.963 | 6.62 | |
| ” | 0.890 | - | - | E | 1.91 | 1.267 | 2.084 | 1.57 | 0.942 | 1.972 | 6.62 | |
| ” | 0.907 | - | - | E | 1.85 | 1.288 | 2.096 | 1.66 | 0.959 | 1.961 | 6.62 | |
3.3 AR Psc (HD 8357)
This extremely active RS Cvn system is a double-lined spectroscopic binary consisting of a K1IV primary and a G7V secondary (Fekel 1996). In our previous observations of this system we have found strong Caii H & K and H emissions from the cool component (FFMCC), the H line of the active component in emission above the continuum (FFMCC and Montes et al. 1995a, b) and an important filling-in by chromospheric emission in the H line (Montes et al. 1995d).
Now we have analysed four spectra of this system in both spectral regions at the orbital phases from 0.37 to 0.52 (see Fig.3). The H line of the active component appears in emission above the continuum, with a profile that changes with the orbital phase owing to the different amounts of overlapping with the absorption of the other component. By subtracting the synthesized spectrum, constructed with G6IV and K0IV reference stars and a relative contribution of 0.2/0.8 we have found a large excess H emission which is well matched using a two-components Gaussian fit. In the Nai D1 and D2 lines an important excess emission is present in the subtracted spectra, however, the Hei D3 line does not appear in absorption.


3.4 HD 12545 (XX Tri, BD +34 363)
This extremely active RS CVn binary is a single-lined spectroscopic binary of spectral type K0III. It has very strong Caii H & K and H emission lines and the H line in emission above the continuum (Strassmeier et al. 1990; Bopp et al. 1993; Montes et al. 1995c). This system shows the largest amplitude of light variation from spots yet recorded (Hampton et al. 1996).
Our observed H spectrum at the orbital phase 0.401 (Fig.4) shows a strong and very broad H emission above the continuum. The synthesized spectrum has been constructed with a reference star of spectral type K0III obtaining a satisfactory fit. The subtracted spectrum exhibits an asymmetric profile that is not well matched using a Gaussian fit, therefore we fit the profile by means two Gaussian components. In the Nai line region a clear excess emission in the D1 and D2 lines is present, in agreement with the strong activity of this system. The behaviour of the Hei D3 line is not clear in this spectrum, but a weak absorption seems to appear.
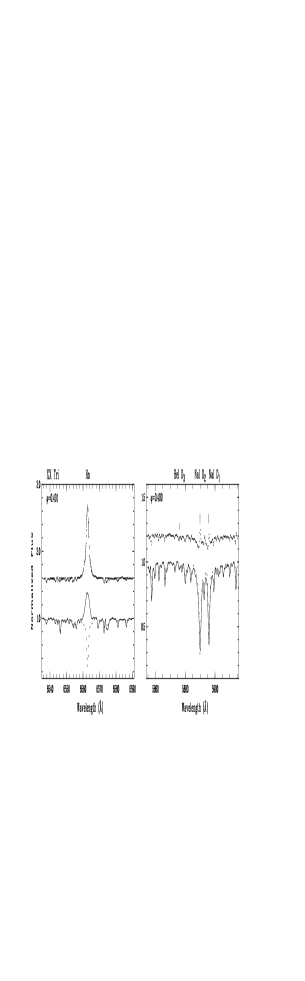
3.5 UX Ari (HD 21242)
The description of the simultaneous H, Nai D1, D2, and Hei D3 observations and the detection of a flare on this system can be found in Montes et al. (1996b).
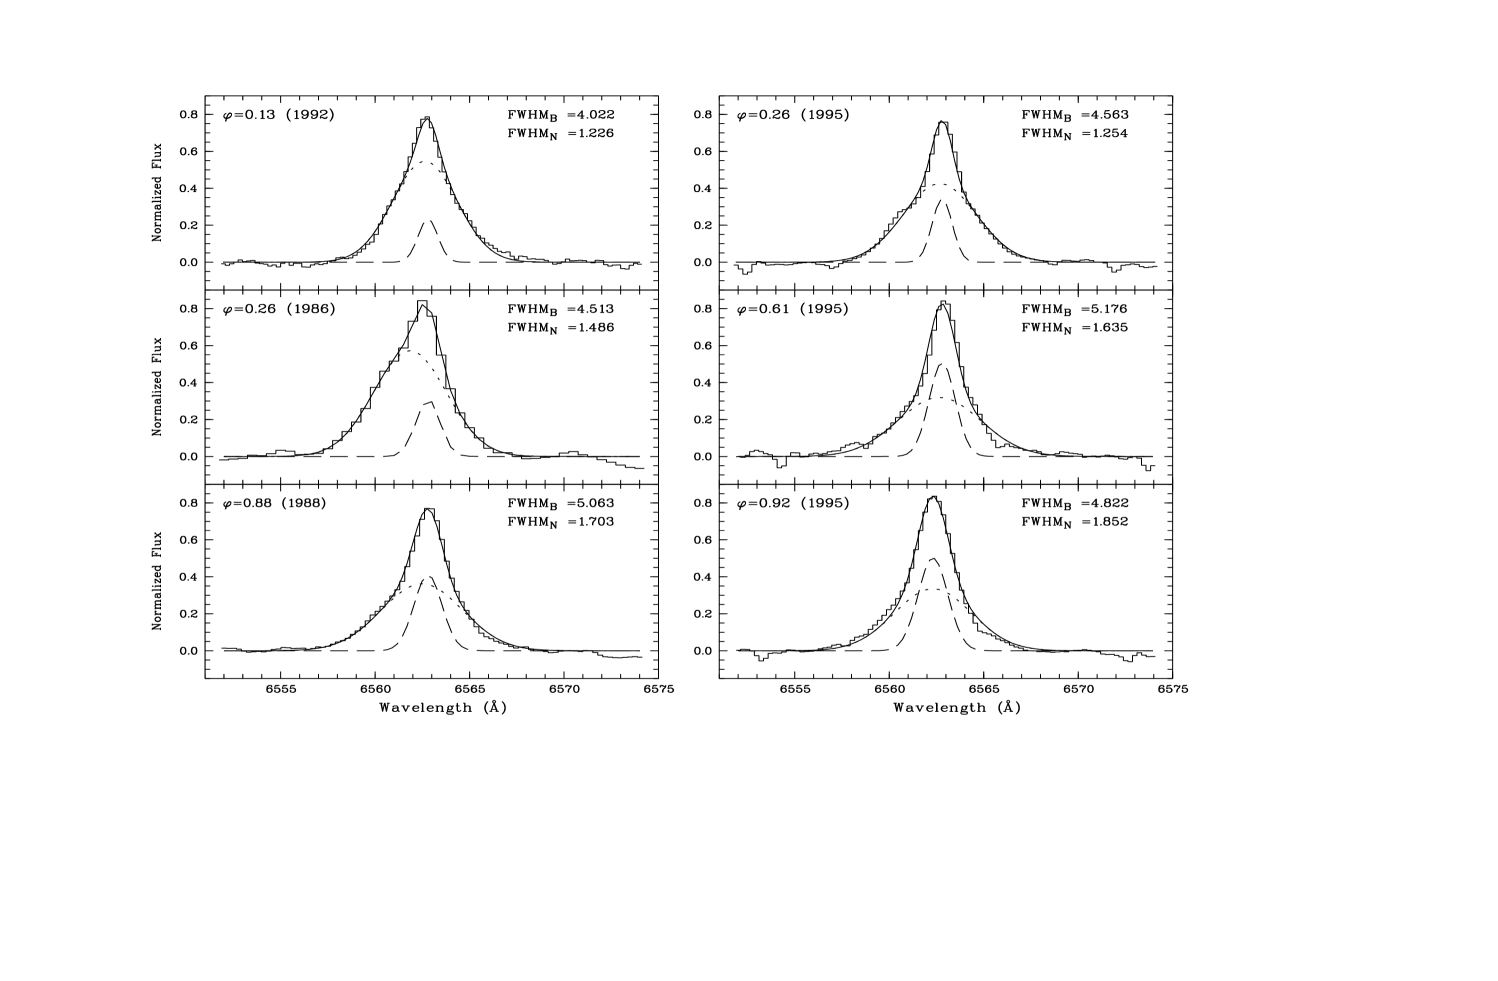
3.6 V711 Tau (HR 1099, HD 22468)
V711 Tau, one of the most active of the RS CVn binaries, is a double-lined spectroscopic binary whose components have spectral types G5IV and K1IV. Our Caii H & K analysis of this system (FFMCC) showed that both components present emissions. The cool component is the more active star in the system, and also presents the H line in emission. This system shows the H line in emission above the continuum and the spectral subtraction (Montes et al. 1995b) reveals that the K1 star is responsible for most of the excess H emission. Recently UV observations obtained with the HST’s GHRS (Wood et al. 1996; Dempsey et al. 1996b, c) indicate that the transition region lines of V711 Tau are emitted almost entirely by the K1 star, and the G star contributes 14% to the chromospheric Mgii h & k lines flux.
We report here five new observations of this systems in the H line region at the orbital phases 0.92, 0.26, 0.28, 0.61 and 0.64 (1995 September 13-15) (see Fig.5) that confirm the results obtained in our previous observations taken in 1988, 1986 and 1992. The H subtracted profiles presents at all the epochs broad wings and are not well matched using a single-Gaussian fit. These profiles have therefore been fitted using two Gaussian components. The parameters of the broad and narrow components used in the two-Gaussian fit are given in table4 and the corresponding profiles are plotted in Fig.6. In contrast to the behaviour found in other systems in which we have used a two-Gaussian fit, the broad component of V711 Tau dominates the line profile (the average contribution of the broad component to the total H EW is 77%, whereas in other stars the contribution ranges between 35% and 63%). Wood et al. (1996) and Dempsey et al. (1996c) also found this behaviour in the broad component of the chromospheric and transition region lines of V711 Tau in comparison with the broad components found in the less active stars AU Mic and Capella.
In Fig.6 we can also see that, the contribution of the broad component is larger at orbital phases near 0.2. (80-87%) than at larger orbital phases (63-72%) and this behaviour remains at different epochs (see Fig.6). These changes indicate not only that the broad component is the result of microflaring in the chromosphere, as in other stars, but that large and long-lived chromospheric flares, that take place in this system (Dempsey et al. 1996c), could also produced enhanced emission in the extended line wings.
Variable excess emission appears in the Nai D1 and D2 lines of the corresponding subtracted spectra, however, no detectable absorption is observed in the Hei D3 line.
3.7 V833 Tau (HD 283750)
V833 Tau is a BY Dra system (dK5e) and one of the hottest known flare stars. In our previous observations of this system we have found a moderate H emission above the continuum that presents a variable little central self-reversal (Montes et al. 1995a, b) and a strong H excess emission (Montes et al. 1995d).
We analyse here three new observations of this systems in the H line region at orbital phases 0.762, 0.319, and 0.851 (Fig.7) that confirm the behaviour previously noted. The self-reversal feature changes its wavelength-position across the emission H line profile, however, it appears always centered with the corresponding H absorption line of the synthesized spectrum.
The Nai D1 and D2 lines exhibit very broad wings in the observed spectra, as correspond to a star of spectral type as later as K5. Although the observed and synthesized spectra are not well matches, due to problems in the normalization, a clear excess emission in the D1 and D2 lines can be seen in the subtracted spectra. The Hei D3 line is not detected in this star.
3.8 V1149 Ori (HD 37824)
A single-lined spectroscopic binary classified as K1III. Our previous observations reveal a clear excess H emission (Montes et al. 1995a, b), strong Caii H & K and H emission lines (Montes et al. 1995c).
We present here one spectrum at the orbital phase 0.439 (see Fig.8). The difference with respect to a K0III reference star reveals a lower excess H emission than the obtained in our previous observations in 1992 (Montes et al. 1995a). The narrow absorption that appears in the red wing of the excess H emission in the subtracted spectra could be attributed to a telluric line.
The spectral subtraction reveals that this star has no measurable filling-in of the Nai D1 and D2 lines. However, a clear absorption in the Hei D3 line appears in the subtracted spectrum.
3.9 MM Her (HD 341475)
Double-lined spectroscopic binary (G2/K0IV) with partial eclipses. This system has Caii H & K emission lines from both components and excess H emission from the cool component (FFMCC, Montes et al. 1995a).
We have obtained three new spectra (Fig.9) of this system in the H and Nai D1 and D2 line regions at orbital phases 0.498, 0.630, and 0.745. At phase 0.498 the hot component hides a 0.30 fraction of the cool one, (see the diagram of Fig.9) and the absorption lines from both components appear overlapped in the observed spectrum. However, at phases 0.630 and 0.745 there is not eclipse and the lines are clearly wavelength-shifted. The more intense H absorption observed in these spectra corresponds to the hot component and the less intense and blue-shifted absorption corresponds to the cool one. The spectral subtraction, using G2IV and K0IV as reference stars and a relative contribution of 0.5/0.5, indicates that the excess H emission arises only from the cool component. The excess H emission line profiles obtained are well matched using a two-component Gaussian fit.
In the subtracted spectra of the Nai D1 and D2 lines region we can also see an excess emission in these lines from the cool component. The narrow absorption that appears near the position of the hot component could be due to deficient sky correction in these spectra. The Hei D3 line is not present.
3.10 V815 Her (HD 166181)
Single-lined spectroscopic binary. Our previous Caii H & K and H observations (FFMCC, Montes et al. 1995a) indicate that the hot star is the active component. Multiwavelength observations of this system have been recently reported by Dempsey et al. (1996a).
We have taken three spectra of this system at orbital phases 0.978, 0.520, 0.099 (see Fig.10). In the H line region the spectra show a filling-in absorption line with noticeable night to night changes. The excess H emission obtained with the spectral subtraction of a G5V reference star is larger at the orbital phases near to 0.0. The subtracted H profile presents broad wings and is well matched using a fit with two Gaussian components (narrow and broad). The narrow component is more important when the excess H emission is larger (see table4).
A small filling-in is observed in the Nai D1 and D2 lines at the three orbital phases, and only at phase 0.523 absorption in detected in the Hei D3 line.
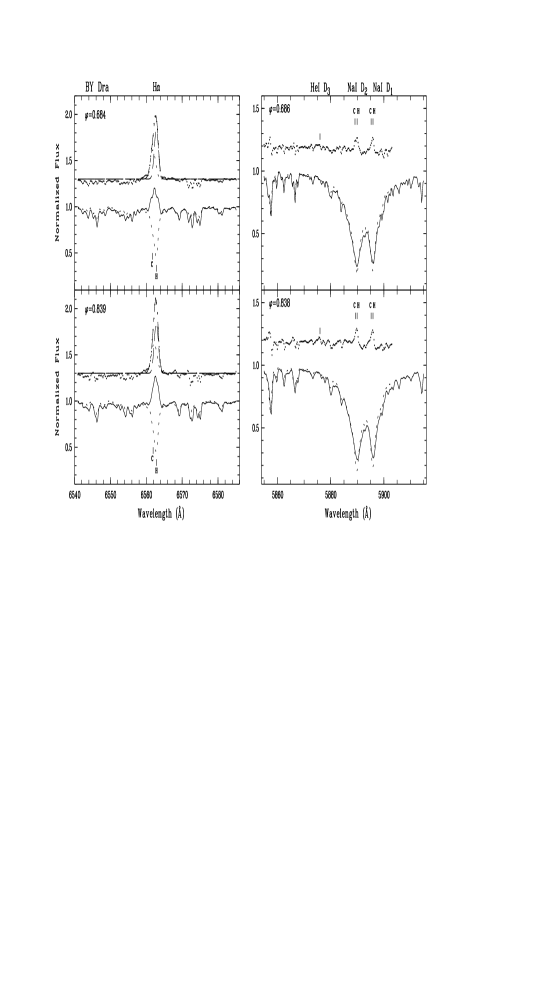
3.11 BY Dra (HD 234677)
The prototype of the BYDra stars. Our previous Caii H & K observations of this system (FFMCC) clearly show that both components are active with the hot component having the stronger Caii emission. The two components also show H in emission.
We present in this paper simultaneous H and Nai D1 and D2 observations of this system at orbital phases 0.684 and 0.839 (see Fig.11). These spectra show strong H emission above the continuum and the Nai D1 and D2 lines with very broad wings corresponding to the later spectral type of the components of this system (K4V/K7.5V).
By applying the spectral subtraction technique we have obtained an asymmetric excess H emission line profile which has contributions from both components. A two-Gaussian fit has been used to deblend the contribution of the hot and cool components to the line profile. This fit reveals that the hot component have the stronger excess H emission EW in agreement with the behaviour observed by us in the Caii H & K lines.
The subtracted spectra in the Nai D1 and D2 line region reveal that the excess emission in these lines also arises from both components. The Hei D3 line is not detected in these spectra.
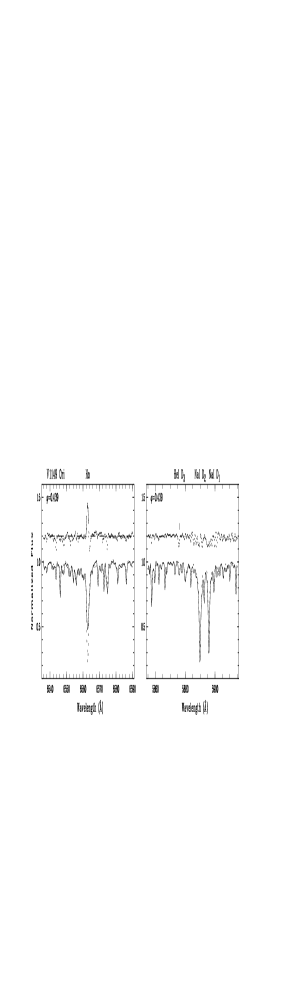
3.12 V775 Her (HD 175742)
Single-lined spectroscopic binary (K0V/[K5-M2V]) with strong Caii H & K emission lines from the hot component (FFMCC). The H feature may change from a weak absorption feature to emission above the continuum on times scales of hours (Xuefu and Huisong 1984).
In our H spectrum at the orbital phase 0.394 (Fig.12) we can see the H line of the hot component totally filled-in by emission and a small emission bump red-shifted in relation to the absorption lines. By subtracting the synthesized spectrum, constructed with a K0IV reference star, we have obtained a strong excess H emission coming from the hot component and a small excess emission, red-shifted 1.9 Å with respect to the emission of the hot component. This small excess perhaps could be attributed to the cooler star of the system, whose assumed spectral type is K5-M2V and whose contribution to the observed spectra is negligible.
In the Nai lines region the spectral subtraction points out a filling-in of the D1 and D2 lines and not detectable absorption in the Hei D3 line.
3.13 V478 Lyr (HD 178450)
This BYDra system is a single-lined spectroscopic binary with strong Caii H & K emissions from the hot component (FFMCC) and a filled-in H absorption line (Fekel 1988).
The H spectrum of this system exhibits a strong filling-in absorption line (see Fig.13). By subtracting the synthesized spectrum constructed with a G8V star we have obtained strong excess H emission, a small excess emission in the Nai D1 and D2 lines and a clear absorption in the Hei D3 line.
3.14 HK Lac (HD 209813)
HKLac is a single-lined spectroscopic binary (F1V/K0III) with very strong Caii H & K emissions, the H line in emission and an important excess H emission (FFMCC; Montes el at. 1995a).
This system shows a very variable H profile (from filled-in absorption to moderate emission) and flares (see Catalano & Frasca 1994). However, in our six H spectra taken in three consecutive nights, with orbital phases from 0.067 to 0.153, we always observe filled-in absorption line with small night to night variations in the excess H emission from the cool component. In Fig.14 a spectrum of each night is showed.
The observed spectra are well matched using a K0III as reference star. The subtracted spectra show an important excess emission in the Nai D1 and D2 lines and a clear absorption in the Hei D3 line.
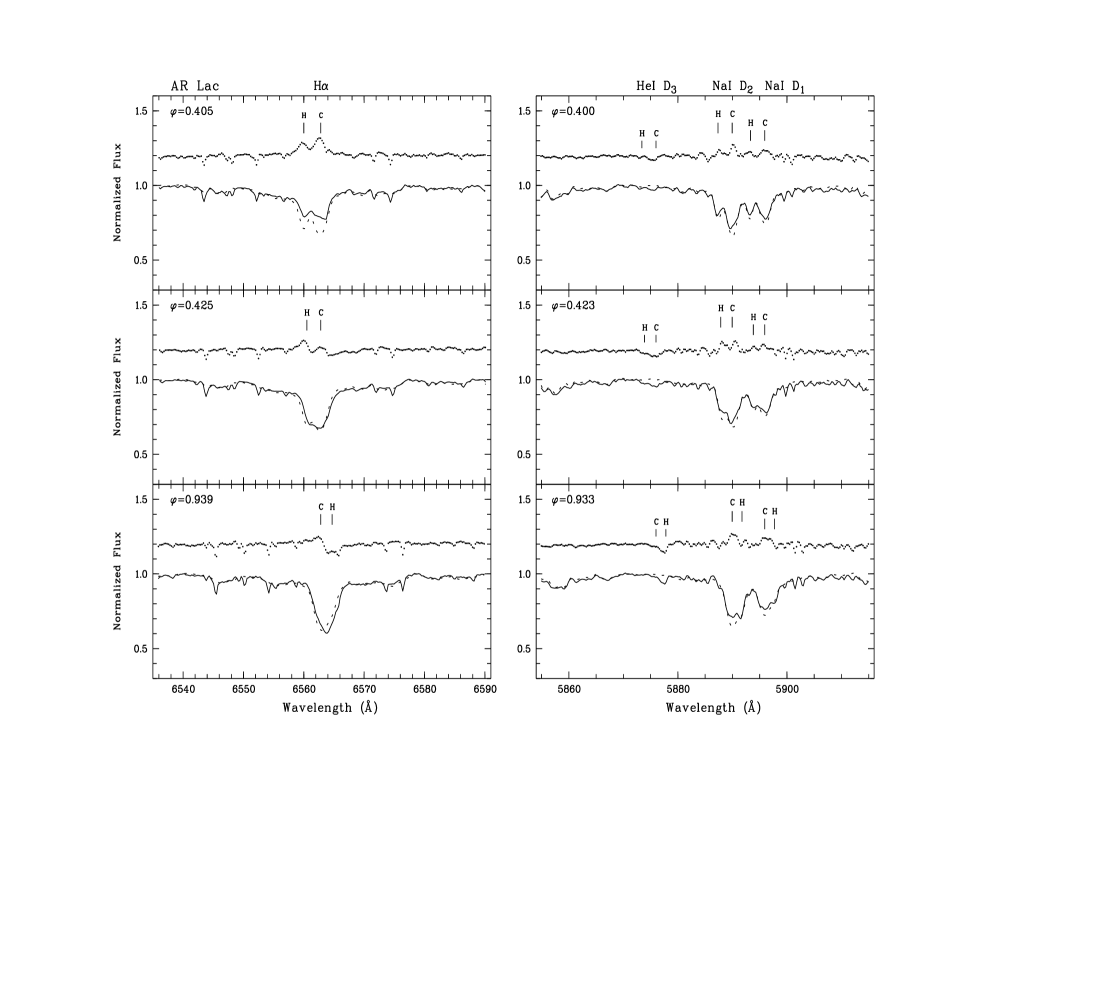


3.15 AR Lac (HD 210334)
The total eclipsing binary AR Lac is one of the best studied RSCVn systems. Both components of the system (G2IV/K0IV) are active (CABS), however, due to the orbital phase, in our previous Caii H & K and H observations (FFMCC) it was not possible to separate the contribution from each component.
We analyse here H observations of this system at three orbital phases. In Fig.15 we have superimposed to each spectrum the corresponding geometrical position of the cool and hot components. At orbital phase 0.405 there is not eclipse and the subtracted spectrum exhibits excess H emission from both components, being a slightly larger that corresponding to the cool one. At phase 0.425 the hot component hides a 4 of the cool one and the excess emission obtained is now slightly larger in the hot component. This change in the excess emission observed in both components could be attributed to the hot component hiding of prominence-like material or other active regions responsible for the H emission of the cool component.
In the observation at the orbital phase 0.939, when a 33 of the hot component is hidden by the cool component, we detect an excess H absorption located at the wavelength position corresponding to the hot component. This excess absorption indicates the presence of prominence-like extended material seen off the limb of the cool component that absorbs the photospheric continuum radiation of the star behind. Similar prominence-like structures have been found in other eclipsing RS CVn systems (see Hall & Ramsey 1992) and recently, Siarkowski et al. (1996) have found geometrically extended structures in the corona of AR Lac.
At these three orbital phases the Nai D1 and D2 lines also present excess emissions from both components and the Hei D3 shows absorption features in the subtracted spectra. At orbital phase 0.933 the Hei D3 line presents a large excess absorption at the wavelength position corresponding to the hot component, which could also be attributed to the prominence-like material.
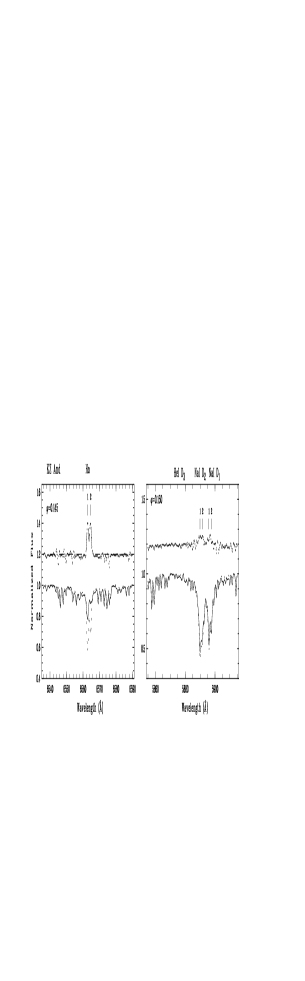
3.16 KZ And (HD 218738)
KZ And is the component B of the visual pair ADS 16557, and is a double-lined spectroscopic binary with spectral types dK2/dK2. This system presents Caii H & K and H emissions and excess H emission from both components (FFMCC, Montes et al. 1995c, d).
By applying the spectral subtraction technique we have found that also both components present excess emission in the H line and in the in the Nai D1 and D2 lines, with very similar intensities (see Fig.16). The Hei D3 line is not present in the subtracted spectrum. The synthesized spectrum has been constructed with two K2V stars and with a contribution of each component to the total continuum of 0.58/0.42.
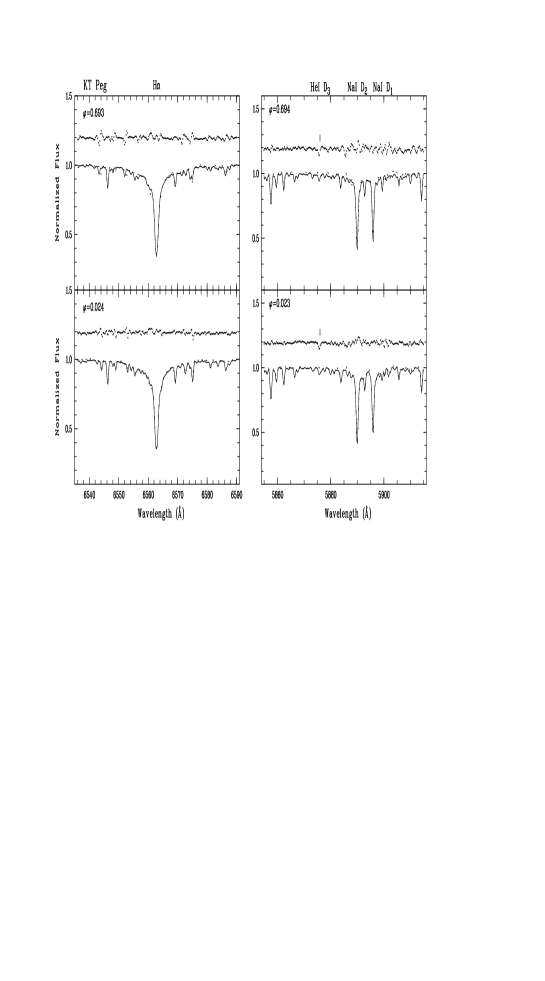
3.17 KT Peg (HD 222317)
This system is a double-lined spectroscopic binary (G5V/K6V) with small Caii H & K emissions from both components (Montes et al. 1995c).
We analyse here two spectra at the orbital phases 0.693 and 0.024 (see Fig.17). We have constructed the synthesized spectrum with two reference stars of spectral types G2IV and K3V taking into account that the hot component has the larger contribution to the continuum. In both subtracted spectra no detectable excess emission is observed in the H line nor in the Nai D1 and D2 lines. The Hei D3 line appears in absorption.
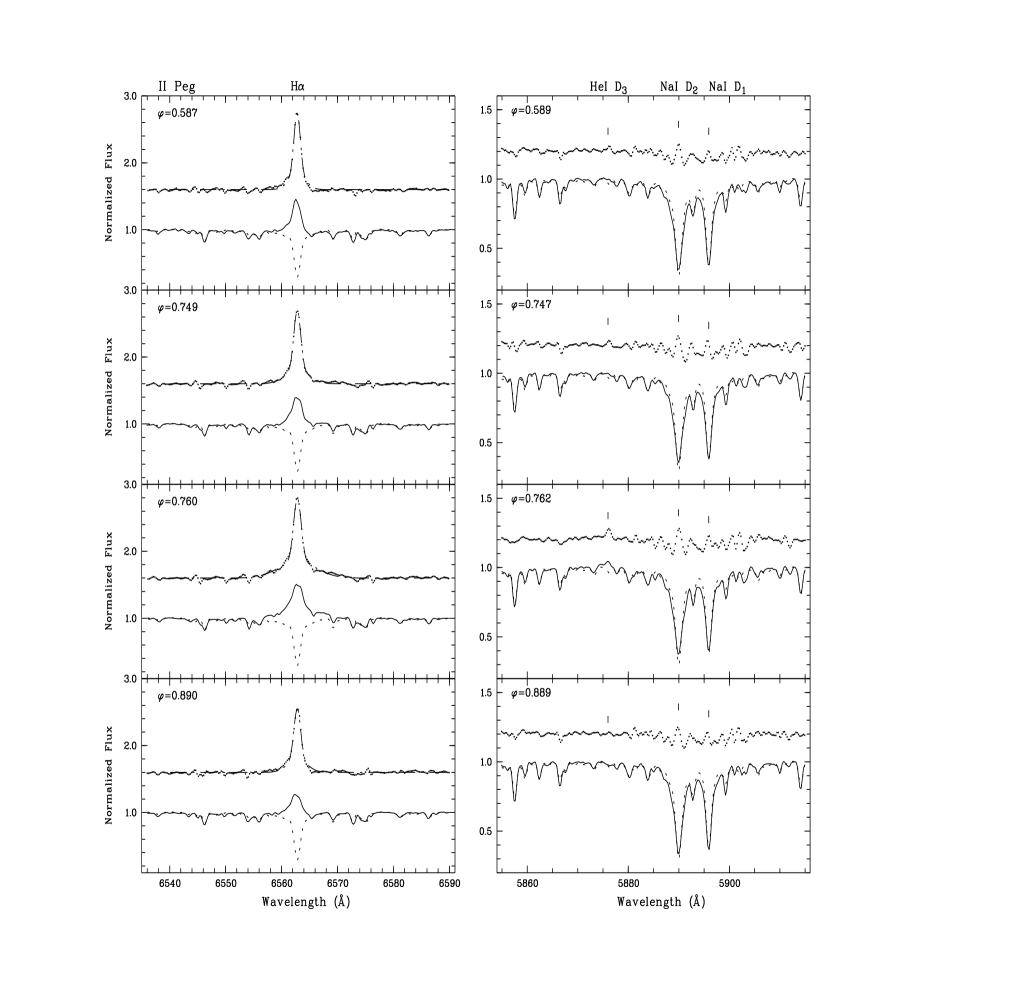
3.18 II Peg (HD 224085)
This is a single-lined spectroscopic binary (K2-3V-IV) with strong Caii H & K emission lines and variable H emission above the continuum. We have reported a strong excess emission in the H line (Montes et al. 1995d).
We present here eight spectra of this system taken in three consecutive nights and with orbital phases ranging from 0.58 to 0.91. The strong H emission present in the subtracted spectra in all the phases shows remarkable night to night changes (see Fig.18). In the second night the spectrum at orbital phase 0.760 shows a remarkable excess H emission enhancement with regard to the other phases, which is much more noticeable in comparison with the spectra of the first and third nights. The excess H emission EW increases in a factor of 1.9 in an interval of 1 day. This fact suggests that we have detected a flare since enhancements of this amount during flares are typical of chromospheric emission lines (Simon et al. 1980, Catalano & Frasca 1994) and has also been observed by us in the flare detected in UX Ari (Montes et al. 1996b).
The Hei D3 line appears in emission in the observed spectrum only at orbital phase 0.760 (see Fig.18) corresponding to the increase of the emission observed in the H line. This fact supports the detection of a flare-like event, since in the Sun the Hei D3 line appears as absorption in plage and weak flares and as emission in strong flares (Zirin 1988). At the other orbital phases of the first and second night an small emission in Hei D3 is also present in the subtracted spectrum. However, in the third night where the H EW present the lower values the Hei D3 emission is not observed.
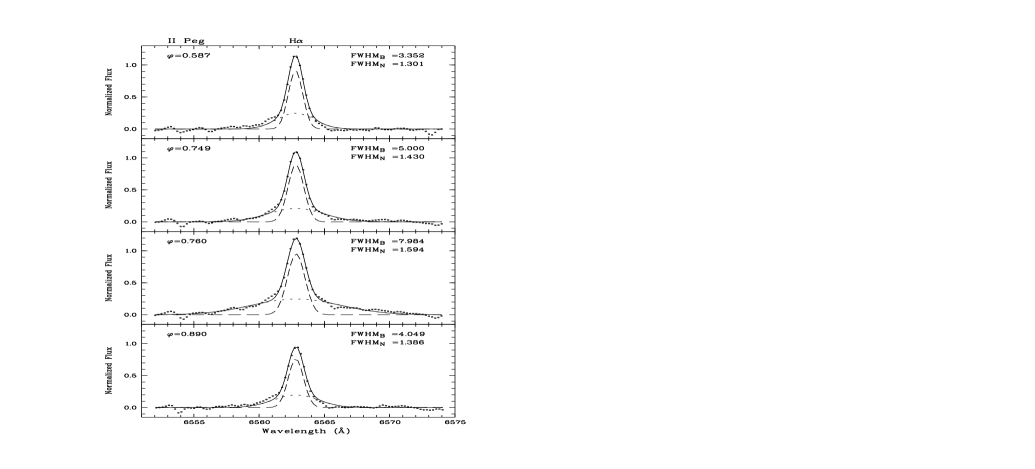
The subtracted spectra show that the H profile presents broad wings, which are much more remarkable in the flare spectrum. In Fig.19 we have represented the subtracted spectrum at phases 0.587, 0.749, 0.760 and 0.890 and the corresponding narrow and broad components used to perform the two-component Gaussian fit.
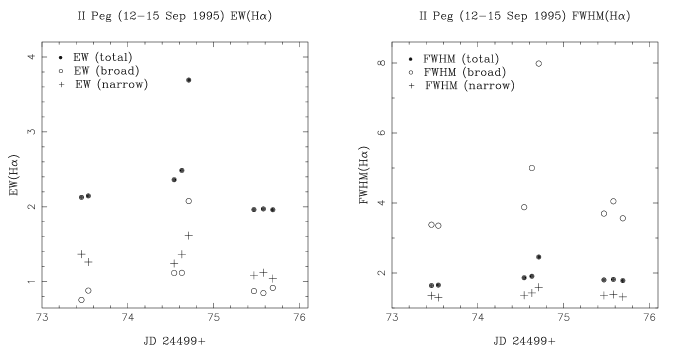
The changes in the EW(H) and FWHM(H) of the total subtracted spectra and of the corresponding narrow and broad components during the three nights can be seen in Fig.20. Note the strong change in the FWHM of the broad component during the flare.

4 Discussion
4.1 The excess H emission
The inspection of the subtracted H spectra shows that in some stars the emission line profile has very broad wings, and is not well matched using a single-Gaussian fit. These profiles have therefore been fitted using two Gaussian components: a narrow component having a FWHM of 45-90 kms and a broad component with a FWHM ranging from 133 to 470 kms. In Table4 we list the parameters (I, FWHM, EW) of the broad and narrow components. As can be seen in this table the average contribution of the broad component to the total EW of the line ranges from 35% in AR Psc to 77% in V711 Tau. We have observed this behaviour in the chromospheric H line only in the most active systems of the sample, the stars with intense H emission above the continuum (AR Psc, XX Tri, UX Ari, V711 Tau (Fig.6), II Peg (Fig.19)) and also in systems with important excess H emission (MM Her, V815 Her, HK Lac). Furthermore, a revision of the H spectra of a large sample of chromospherically active binaries previously analysed by us (Montes et al. 1995a, b) indicates that the very active systems DM UMa and VV Mon also have broad components and that some systems also studied in this paper (V711 Tau, V815 Her, HK Lac) exhibit this behaviour at different epochs.
This parameterization of the subtracted H profile using a narrow and a broad component have been only reported until now for the RS CVn system DM UMa by Hatzes (1995) who suggests that the broad component could result from large-scale motions or winds in the chromosphere. Similar broad components have also been found in several transition region lines of the dM0e star AU Mic and the RS CVn systems Capella and V711 Tau using high-resolution UV observations obtained with the HST’s GHRS (Linsky & Wood 1994; Linsky et al. 1995; Wood et al. 1996; Dempsey et al. 1996b, c; Robinson et al. 1996). The broad components in the transition region lines are interpreted by Linsky & Wood (1994) as arising from microflaring, because these broad profiles are reminiscent of the broad profiles observed in solar transition region explosive events, which are thought to be associated with emerging magnetic flux regions where field reconnection occurs.
The microflares are frequent, short-duration, energetically weak disturbances, i.e. they are the low-energy extension of flares, and therefore have large-scale motions associated that could explain the broad wings observed in these lines. The microflaring activity could occur not only in the transition region but also in the chromosphere of very active stars as indicates the detection of broad components in the chromospheric Mgii h & k lines of V711 Tau (Wood et al. 1996) but not in the chromospheric lines of the less active star Capella (Linsky et al. 1995).
Our detection of broad wings in the chromospheric H line of the most active systems of our sample allows us to conclude that microflaring occurs also in the chromosphere and that it is much more important in extremely active stars. Furthermore, within the group of stars that present this phenomenon a correlation between the contribution of the broad components and the degree of stellar activity seems to be present, as can be seen in Fig.21 left-panel where we have plotted for each star the EW of the broad component versus the total excess H EW. This correlation was also noted by Wood et al. (1996) when compared the dominant broad component of V711 Tau with the smaller broad component of the less active stars AU Mic and Capella.
On the other hand, when we plot the FWHM of the broad component versus the total H EW (Fig.21 right-panel) a general trend is not observed. However, in this case the relation appears for individual star, i.e. there is an increase in the FWHM when the activity level increases, which is consistent with the hypothesis that microflaring is responsible for the broad component emission.
We have also found that the larger changes in the excess H emission in the stars analyzed appear to occur predominantly in the broad component, as have been already noted in the case of DM UMa by Hatzes (1995). An extreme case of this behaviour is the strong change in the broad component that occurs during the flares detected in UX Ari and II Peg (see Fig.20 and 21). Since large scale mass motions do occur in solar flares, a large flare in these two systems may explain the increase of the H emission and the very broad wings observed in these spectra.
| H broad component | H narrow component | |||||||||
| Name | I | FWHM | EWB | EWB/EWT | I | FWHM | EWN | EWN/EWT | ||
| (Å) | (Å) | (%) | (Å) | (Å) | (%) | |||||
| AR Psc | 0.373 | 0.089 | 3.570 | 0.338 | 31.6 | 0.541 | 1.272 | 0.732 | 68.3 | |
| 0.443 | 0.132 | 4.473 | 0.625 | 44.5 | 0.534 | 1.358 | 0.772 | 55.0 | ||
| 0.519 | 0.108 | 3.362 | 0.388 | 32.0 | 0.587 | 1.319 | 0.823 | 68.0 | ||
| 0.524 | 0.107 | 3.652 | 0.417 | 33.0 | 0.603 | 1.316 | 0.845 | 67.0 | ||
| XX Tri | 0.401 | 0.392 | 3.785 | 1.581 | 60.8 | 0.712 | 1.132 | 1.007 | 38.7 | |
| UX Ari | 0.419 | 0.302 | 3.720 | 1.194 | 66.4 | 0.431 | 1.317 | 0.605 | 33.6 | |
| 0.438 | 0.297 | 2.917 | 0.922 | 65.6 | 0.344 | 1.316 | 0.483 | 34.4 | ||
| 0.576 | 0.145 | 5.153 | 0.778 | 50.8 | 0.468 | 1.512 | 0.753 | 49.2 | ||
| 0.736 | 0.405 | 5.414 | 2.229 | 67.8 | 0.580 | 1.723 | 1.069 | 32.4 | ||
| V711 Tau (1995) | 0.922 | 0.335 | 4.822 | 1.700 | 62.7 | 0.502 | 1.852 | 0.990 | 36.5 | |
| 0.261 | 0.425 | 4.563 | 2.046 | 81.1 | 0.344 | 1.254 | 0.459 | 18.2 | ||
| 0.280 | 0.417 | 4.406 | 1.947 | 80.4 | 0.344 | 1.265 | 0.463 | 19.1 | ||
| 0.606 | 0.318 | 5.176 | 1.707 | 64.6 | 0.509 | 1.635 | 0.887 | 33.6 | ||
| 0.641 | 0.402 | 4.063 | 1.735 | 72.8 | 0.406 | 1.486 | 0.642 | 27.0 | ||
| V711 Tau (1992) | 0.130 | 0.546 | 4.022 | 2.303 | 88.3 | 0.234 | 1.226 | 0.305 | 11.7 | |
| V711 Tau (1986) | 0.200 | 0.570 | 4.489 | 2.660 | 87.8 | 0.251 | 1.381 | 0.369 | 12.2 | |
| 0.260 | 0.576 | 4.513 | 2.570 | 85.2 | 0.311 | 1.486 | 0.448 | 14.8 | ||
| V711 Tau (1988) | 0.880 | 0.362 | 5.063 | 1.821 | 70.5 | 0.410 | 1.743 | 0.761 | 29.5 | |
| MM Her | 0.498 | 0.076 | 3.367 | 0.272 | 46.1 | 0.248 | 1.203 | 0.318 | 53.9 | |
| 0.630 | 0.044 | 3.612 | 0.167 | 30.9 | 0.274 | 1.283 | 0.374 | 69.1 | ||
| 0.745 | 0.064 | 3.222 | 0.221 | 44.7 | 0.217 | 1.180 | 0.273 | 55.3 | ||
| V815 Her (1995) | 0.978 | 0.142 | 4.622 | 0.687 | 53.7 | 0.397 | 1.377 | 0.582 | 45.5 | |
| 0.520 | 0.134 | 3.577 | 0.509 | 58.2 | 0.267 | 1.288 | 0.366 | 41.8 | ||
| 0.099 | 0.113 | 4.775 | 0.561 | 51.2 | 0.334 | 1.467 | 0.521 | 47.6 | ||
| V815 Her (1989) | 0.520 | 0.092 | 4.420 | 0.416 | 60.1 | 0.200 | 1.294 | 0.276 | 39.9 | |
| HK Lac (1995) | 0.067 | 0.089 | 4.890 | 0.458 | 59.9 | 0.291 | 0.991 | 0.307 | 40.1 | |
| 0.110 | 0.095 | 5.286 | 0.515 | 58.1 | 0.329 | 1.065 | 0.373 | 42.0 | ||
| 0.149 | 0.089 | 5.951 | 0.522 | 56.2 | 0.339 | 1.129 | 0.408 | 43.9 | ||
| HK Lac (1989) | 0.100 | 0.142 | 5.654 | 0.726 | 58.8 | 0.346 | 1.384 | 0.509 | 41.2 | |
| II Peg | 0.575 | 0.211 | 3.379 | 0.758 | 35.6 | 0.952 | 1.351 | 1.369 | 64.4 | |
| 0.587 | 0.247 | 3.352 | 0.882 | 41.1 | 0.913 | 1.301 | 1.264 | 58.9 | ||
| 0.735 | 0.271 | 3.880 | 1.118 | 47.3 | 0.856 | 1.366 | 1.244 | 52.7 | ||
| 0.749 | 0.210 | 5.000 | 1.119 | 45.0 | 0.898 | 1.430 | 1.368 | 55.0 | ||
| 0.760 | 0.245 | 7.984 | 2.077 | 56.3 | 0.952 | 1.594 | 1.616 | 43.7 | ||
| 0.874 | 0.223 | 3.697 | 0.876 | 44.6 | 0.750 | 1.359 | 1.086 | 55.3 | ||
| 0.890 | 0.197 | 4.049 | 0.849 | 43.1 | 0.761 | 1.386 | 1.121 | 56.8 | ||
| 0.907 | 0.242 | 3.563 | 0.918 | 46.8 | 0.743 | 1.319 | 1.042 | 53.1 | ||
| DM UMa | 0.400 | 0.207 | 10.36 | 0.810 | 27.8 | 0.999 | 1.971 | 2.107 | 72.2 | |
| 0.530 | 0.246 | 8.607 | 1.135 | 38.0 | 0.918 | 1.893 | 1.850 | 62.0 | ||
| VV Mon | 0.710 | 0.177 | 5.382 | 0.918 | 68.2 | 0.252 | 1.596 | 0.428 | 31.8 | |
4.1.1 The Hei D3 line
The Hei D3 5876 and Hei 10830 triplets are known to be activity indicators in the Sun and late type stars (Zirin 1988, Shcherbakov et al. 1996). In the Sun, the Hei D3 line appears like an absorption feature cospatial with plages (Landman 1981), and it almost disappears when we look at the solar disk. This feature is also seen in absorption in surges, eruptive prominences, and weaker flares, whereas in emission in more intense flares (Zirin 1988).
The Hei D3 line is formed at middle chromosphere, and its correlation with X-ray flux and Ca ii H & K lines suggests that the fractional area of the stellar disk covered by plages may be a key factor in the formation of D3 (Danks & Lambert 1985). Moreover it has been observed a slight rotational modulation in Cet (Lambert & O’Brien 1983) and 1 Ori (Danks & Lambert 1985).
Historically, there have been basically two models to explain the line formation of Hei D3: (i) Zirin (1975) suggested that Hei triplet levels were populated by over-photoionisation of the Hei atoms by EUV and X-ray radiation, and subsequent radiative recombinations and cascade. (ii) Wolff et al. (1985) argued that collisional excitation and ionization in the chromosphere contributed also to the Hei D3 formation, and not only the EUV and X-ray radiation from the corona. However, the most recent models (Andretta & Giampapa 1995, Lanzafame & Byrne 1995) seem to indicate that the primary mechanism in the formation of the Hei triplets is the collisional excitation and ionization (followed by recombination cascade) by electron impact.
The Hei D3 line usually appears, in stars, in absorption, but sometimes is in emission. There are two possible reasons: (i) Temperature and/or electronic density conditions are higher than ordinary, like may occur in flares (Zirin 1988, Andretta & Giampapa 1995, Lanzafame & Byrne 1995). (ii) As it has been seen in Hei 10830, depending on the position of the emitting region in the disk or off the limb, the Hei D3 line would appear in absorption or emission. Since the Hei 10830 is formed in emitting regions located at some distance from the stellar photosphere, when the emitting region is seen in projection against the stellar disk, Hei 10830 line appears in absorption, and when the emitting region is observed off the stellar limb, the line is in emission (Simon et al. 1982, Wolff & Heasley 1984). These conclusions could extend to the case of Hei D3, since it is produced at the same region that Hei 10830.
The Hei D3 line has been studied only in some chromospherically active binaries as II Peg (Huenemoerder & Ramsey 1987; Huenemoerder et al. 1990), DM UMa (Hatzes 1995), ER Vul (Gunn & Doyle 1996) and GK Hya (Gunn et al. 1996). The observation of emission in the Hei D3 line supports the detection of flare like events as in the case of II Peg (Huenemoerder & Ramsey 1987) and the weak-lined T Tauri star V410 Tau (Welty & Ramsey 1996).
In our spectra the Hei D3 line has been found in emission only during the flares of UX Ari and II Peg. We wish to emphasize that the detection of Hei D3 in emission in the RS CVn systems seems to occur at orbital phases near to the quadrature. In our observations we have detected Hei D3 in emission at orbital phase 0.74 in UX Ari (Montes et al. 1996b) and at 0.76 in II Peg. This line has been also observed in emission at orbital phases 0.22, 0.26, 0.77 in IIPeg by Huenemoerder & Ramsey (1987) and Huenemoerder et al. (1990). Probably we are observing a flare off the limb, i.e. when the plage regions are near the limb (the active regions are preferably in the opposite faces of the stars), which is the most favourable situation to see an off the limb flare. But we cannot distinguish whether the emission is only due to the existence of the flare, or it is favoured by the relative position on the star.
The application of the spectral subtraction to our sample reveals that the Hei D3 line appears as an absorption feature more frequently in giants than in dwarfs. Three out of five giants observed show clear absorptions (BD Cet, V1149 Ori and HK Lac) and two of them exhibit a possible absorption (AY Cet and XX Tri), while among IV and V luminosity class stars there are only two plain absorptions. Various authors seem to point out a more frequent presence of Hei 10830 and 5876 triplets in giants and supergiants than in dwarfs (Simon et al. 1982, Zirin 1982, Wolff & Heasley 1984).
Zirin (1982) observed Hei 10830 usually in absorption, but sometimes it appears in emission, especially in giant and supergiants, with a P Cygni form, and he attributes it to a mass-ejection phenomenon (see also O’Brien & Lambert 1986). Simon et al. (1982) saw that none of the single red giants, in their sample, having strong 10830 absorption or emission has prominent transition region emission lines or soft X-ray emission, and they proposed a scattering process-like responsible for the 10830 line formation. Smith (1983) attributed a larger intensity in 10830 line for giants and supergiants to the most efficient ionization by EUV and X-ray radiation in atmospheres of coronally active giants. Other authors say that 10830 line is sometimes produced by the propagation of acoustic shock waves, or that Hei 10830 transition represents a wind diagnostic. Some of the above proposed mechanisms could also be applied to the Hei D3 line.
4.1.2 The Nai D1 and D2 lines
The Nai D1 and D2 lines are collisionally-controlled in the atmospheres of late-type stars and are formed in the lower chromosphere. So, the detection of filled-in absorption in the D1 and D2 lines may provide information about chromospheric emission. (see the recent models of these lines for M dwarfs stars by Andretta et al. 1997).
In the Sun, Barrado et al. (1995) and Barrado (1996) have found changes in the EW of Nai lines in spectra taken at different regions over the solar surface, and a relation with the filled-in absorption H that might indicate that there is a non-radiative effect in the formation of these lines.
In other stars the D1 and D2 lines have been observed in emission or as a filled-in in very active red dwarf flare stars (Pettersen et al. 1984; Pettersen 1989). However, no systematic study of these lines has been performed in stars with different levels of activity, and in chromospherically active binaries only the negative and uncertain detection of filled-in in the few active binaries ER Vul and GK Hya, respectively, has been reported in the recent studies of Gunn & Doyle (1996) and Gunn et al. (1996).
The application of the spectral subtraction technique in these lines is more difficult that in the H line, because their wings are very sensitive to the effective temperature, mainly in latter spectral types. Therefore, small differences in spectral type, not appreciated in the H line, produce significant changes of the subtracted spectra in the wings of the Nai lines. Moreover, in this spectral region there is a large number of telluric lines, and in the spectra of some stars interstellar Nai could be present. However, the distances of the majority of the stars is lower than 50 pc and the effect of the interstellar Nai is negligible.
In spite of this problems, some conclusions can be drawn. In the chromospherically active binaries analysed here, the spectral subtraction reveals that the core of the Nai D1 and D2 lines are filled-in by chromospheric emission in the more active star of the sample (the star with H emission above the continuum, and with larger excess H emission EW). The stars with only a small or without excess H emission as BD Cet, AY Cet, V1149 Ori and KT Peg do not exhibit excess emission in the Nai lines. Moreover, the excess D1 and D2 emissions obtained are larger in the systems with larger excess H emission, and also increase in the flares observed in UX Ari and II Peg. In short, we can conclude that the filled-in of the core of the Nai D1 and D2 lines could be used as a chromospheric activity indicator.
5 Conclusions
In this paper we have analysed, using the spectral subtraction technique, simultaneous H, Nai D1, D2, and Hei D3 spectroscopic observations of 18 chromospherically active binary systems.
We have found excess H in all the systems, except KT Peg which have also small emission in the Caii H & K lines. The subtracted H profile of the more active stars of the sample (H in emission above the continuum) has very broad wings, and is well matched using a two-components Gaussian fit (narrow and broad). The broad component is primarily responsible for the observed variations of the profile, and its contribution to the total EW increases with the degree of activity. So, we have interpreted this broad component emission as arising from microflaring activity that take place in the chromosphere of this very active stars.
The H observation of the eclipsing binary system AR Lac at orbital phase 0.939, when a 0.33 fraction of the hot component is hidden by the cool component, allowed us to detect the presence of prominence-like extended material seen off the limb of the cool component through the detection of excess H absorption located at the wavelength position corresponding to the hot component. A small excess absorption in the Hei D3 line is also present at this orbital phase.
We reported the detection of an optical flare in the systems UX Ari and II Peg through the presence of the Hei D3 in emission in coincidence with the enhancement of the H emission.
We have found the Hei D3 in emission only in the two above mentioned flares, and as an absorption feature in the subtracted spectra of a large number of giant stars of the sample.
The application of the spectral subtraction technique reveals that the core of the Nai D1 and D2 lines are also filled-in by chromospheric emission in the more active star of the sample. The stars with only a small excess H emission do not exhibit excess emission in the Nai lines.
- Acknowledgements.
This work has been supported by the Universidad Complutense de Madrid and the Spanish Dirección General de Investigación Científica y Técnica (DGICYT) under grant PB94-0263. We would like to thank the referee S. Catalano for suggesting several improvements and clarifications.
References
- 1 Andretta V., Giampapa M.S., 1995, ApJ 439, 405
- 2 Andretta V., Doyle J.G., Byrne P.B., 1997, A&A (in press)
- 3 Basri G., Wilcots E., Stout N., 1989, PASP 101, 528
- 4 Barrado D., De Castro E., García López R.J., Sánchez Almeida J., Montesinos B. 1995, in: Stellar Surface Structure, IAU Symp 176, Poster Proceedings, Strassmeier K. (ed), p. 123
- 5 Barrado D., 1996, Th. Doctoral, Universidad Complutense de Madrid
- 6 Bidelman W.P., McConnell D.J., 1973, AJ 78, 687
- 7 Bopp B.W., Fekel F., Aufdenberg J.P. Dempsey R., Dadonas V., 1993, AJ 106, 2502
- 8 Catalano S., Frasca A., 1994, 287, 575
- 9 Danks A.C., Lambert D.L., 1985, A&A 148, 293
- 10 Dempsey R.C., Neff J., O’Neal D., Olah K., 1996a, AJ 111, 1356
- 11 Dempsey R.C., Neff J., Linsky J.L., Brown A., 1996b, IAU Symp. 176, K.G. Strassmeier & J.L. Linsky (eds.), Stellar Surface Structure, p. 411
- 12 Dempsey R.C., Neff J., Thorpe M.J., et al., 1996c, ApJ 470, 1172
- 13 Fekel F.C., Moffett T.J., Henry G.W. 1986, ApJS 60, 551
- 14 Fekel F.C. 1988, AJ 95, 215
- 15 Fekel F.C., 1996, AJ 112, 269
- 16 Fernández-Figueroa M.J., Montes D., De Castro E., Cornide M., 1994, ApJS 90, 433 (FFMCC)
- 17 Gunn A.G., Doyle J.G., 1996, A&A (in press)
- 18 Gunn A.G., Doyle J.G., Houdebine E.R., 1996, A&A (in press)
- 19 Hall J.C., Ramsey L.W., 1992, AJ 104, 1942
- 20 Hall J.C. 1996, PASP 108, 313
- 21 Hampton M., Henry G.W., Eaton J.A., Nolthenius R.A., Hall D.S., 1996, PASP 108, 68
- 22 Hatzes A.P., 1995, AJ 109, 350
- 23 Huenemoerder D.P., Ramsey L.W. 1987, ApJ 319, 392
- 24 Huenemoerder D.P., Ramsey L.W., Buzasi D.L., 1990, Cool star stellar systems and the Sun, Sixth Cambridge Workshop., G. Wallerstein ed.), ASP Conference Series 9, p 236
- 25 Lambert D.L., O’Brien G.T., 1983, A&A 128, 110
- 26 Landman D.A., 1981, ApJ 244, 345
- 27 Lanzafame A.C., Byrne P.B., 1995, A&A 303, 155
- 28 Lázaro C., Arévalo M.J., 1996, AJ (in press)
- 29 Linsky J.L., Wood B.E., 1994, ApJ 430, 342
- 30 Linsky J.L., Wood B.E., Judge P., Brown A., Andrulis C., Ayres T.R., 1995 ApJ 442, 381
- 31 Montes D., De Castro E., Cornide M., Fernández-Figueroa M.J., 1994, in: Cool Stars, Stellar Systems, and the Sun, Eighth Cambridge Workshop, J.P. Caillault (ed.), ASP Conference Series 64, 444
- 32 Montes D., Fernández-Figueroa M.J., De Castro E., Cornide M., 1995a, A&A 294, 165
- 33 Montes D., Fernández-Figueroa M.J., De Castro E., Cornide M., 1995b, A&AS 109, 135
- 34 Montes D., De Castro E., Fernández-Figueroa M.J., Cornide M. 1995c, A&AS 114, 287
- 35 Montes D., Fernández-Figueroa M.J., De Castro E., Cornide M. 1995d, Stellar Surface Structure, IAU Symp 176, Poster Proceedings, Strassmeier K. (ed), p. 167
- 36 Montes D., Fernández-Figueroa M.J., Cornide M., De Castro E., 1996a, A&A 312, 221
- 37 Montes D., Sanz-Forcada J., Fernández-Figueroa M.J., Lorente R., 1996b, A&A 310, L29
- 38 Montes D., Martín E.L., Fernández-Figueroa M.J., Cornide M., De Castro E. 1997, A&AS (in press)
- 39 O’Brien G.T., Lambert D.L., 1986, ApJS 62, 899
- 40 Pasquini L., Pallavicini R. 1991, A&A 251, 199
- 41 Pettersen B.R., Evans D.S., Coleman L.A., 1984, ApJ 282, 214
- 42 Pettersen B.R., 1989, A&A 209, 279
- 43 Robinson R.D., Airapetian V.S., Maran S.P., Carpenter K.G., 1996, ApJ 469, 872
- 44 Shcherbakov A.G., Shcherbakova Z.A., Tuominen I., Jetsu L., 1996, A&A 309, 655
- 45 Simon T., Linsky J.L., Schiffer F.H., 1980, ApJ 239, 911
- 46 Simon T., Linsky J.L., Stencel R.E., 1982, ApJ 257, 225
- 47 Siarkowski M., Preś P., Drake S.A., White N.E., Singh K.P., 1996, ApJ 473, 470
- 48 Smith M.A., 1983, AJ 88, 1031
- 49 Strassmeier K.G., Fekel F.C., Bopp B.W., Dempsey R.C., Henry G.W., 1990, ApJS 72, 191
- 50 Strassmeier K.G., Hall D.S., Fekel F.C., Scheck M., 1993, A&AS 100, 173 (CABS)
- 51 Welty A.D., Ramsey L.W. 1996, AJ (in press)
- 52 Wolff S.C., Heasley J.N., 1984, PASP 96, 231
- 53 Wolff S.C., Heasley J.N., Varsik J., 1985, PASP 97, 707
- 54 Wood B.E., Harper G.M., Linsky J.L., Dempsey R.C., 1996, ApJ 458, 761
- 55 Xuefu L., Huisong T. 1984, Inf. Bull. Var. Stars No. 2606
- 56 Zirin H., 1975, ApJ 199, L163
- 57 Zirin H., 1982, ApJ 260, 655
- 58 Zirin H., 1988, in Astrophysics of the Sun, (Cambridge University Press)