A Weak Lensing Survey in the Fields of z1 Luminous Radio Sources
Abstract
In this paper we present weak lensing observations of the fields around 8 luminous radio sources. These data are used to search for the lensing signatures of galaxy clusters that are either physically associated with the radio objects, or are foreground systems projected along the line of sight. The radio sources were all the subjects of deep imaging with WFPC-2 on the Hubble Space Telescope providing high quality shape information on large numbers of faint galaxies around these sources. Statistical analysis of the coherent shear field visible in the shapes of the faint galaxies indicates that we have detected a weak lensing signal close to one of the targets, 3C336 at , with a high level of confidence. A second, independent WFPC-2 observation of this target reinforces this detection. Our results support the earlier suggestion of weak lensing in this field by Fort et al. (1996) using ground-based data. We also combined the shear distributions in the remaining 7 field to improve our sensitivity to weak shear signals from any structure typically associated with these sources. We find no detectable signal and estimate an upper limit on the maximum shear allowed by our observations. We estimate likely limits for the redshift distribution of the faint galaxies used in our analysis, building upon results from inversion redshift surveys through moderate redshift cluster lenses, and the analysis of the colour distributions of galaxies in the Hubble Deep Field. Using these, we convert our observed lensing signal and limits into estimates of the masses of the various structures. We suggest that further lensing observations of distant radio sources and their host environments may allow the cluster –mass relationship to be mapped at high-. This is crucial for interpreting the results of the next generation of deep X-ray surveys, and thus for providing a strong observational constraint on the redshift evolution of the cluster mass function out to .
keywords:
gravitational lensing: observations – cosmology: observations – radio galaxies: individual: 3C2, 3C212, 3C217, 3C237, 3C245, 3C280, 3C289, 3C336.1 INTRODUCTION
The properties of massive, collapsed structures at high redshift provide a vital test of competing theories of structure formation in the universe (e.g. Eke et al. 1996). In particular, the high masses associated with the richest clusters place them on the extreme tail of collapsed structures at their epochs, this in turn makes their space density an extremely sensitive test of models of cosmological structure formation. For example, by indicating a slow pace of evolution, an extensive population of massive clusters at would present an impossible challenge to cosmological models with high density (i.e. ).
It is for this reason that a number of groups have undertaken surveys for distant clusters, using projected galaxy density (e.g. Abell 1958; Gunn, Hoessel & Oke 1986; Couch et al. 1991; Postman et al. 1996) or X-ray emission from the gas bound to the cluster potential (e.g. Henry et al. 1992; Castander et al. 1995; Rosati et al. 1995; Bower et al. 1996). While the possible pit-falls associated with optical searches are well documented (c.f. Couch et al. 1991), the problems with interpreting the X-ray results are only now being explored (see below). To an extent these searches have succeeded: a number of optically selected clusters are known, while the highest redshift X-ray selected clusters are at and (Gioia & Luppino 1994). However, the total number of confirmed clusters at still only amounts to a handful and this seriously limits studies of the properties of these systems and their constituent galaxies.
While the next generation of X-ray surveys will provide more candidates for clusters, there are already indications that these will not be the salvation we might hope. Firstly, the number of such distant systems detected to date is far below that expected by simple models for hierarchical growth in the universe. This implies that the evolution of the X-ray luminosity function is more complex than was first anticipated. It appears that the changes in the X-ray emission from distant clusters arise not only from the growth of the cluster potential, but also from the redshift dependence of the concentration of gas within the cluster (Evrard & Henry 1991; Bower 1996). We are thus left with the possibility that the observed X-ray evolution is driven both by details of the emission within the clusters, and the underlying growth of the cluster. To unambiguously interpret the X-ray surveys in terms of evolution in the cluster masses, we need to calibrate the X-ray properties of distant clusters with other measures of the cluster mass across a range of epochs. Only by combining these two pieces of information can we determine how the observed space density of distant clusters constrains cosmogonic models of structure formation. The most direct mass estimate to use in this comparison is the gravitational lensing signature of the cluster.
Gravitational lensing has become one of the most widely applied tools to study the mass distributions in moderate redshift clusters (see Fort & Mellier 1994 for a recent review). The strength and direction of the coherent distortions induced in the shapes of all background field galaxies seen through the cluster contains information about both the distribution and amount of mass in the cluster (Tyson, Valdes & Wenk 1990; Smail et al. 1995a), as well as the relative distances of the cluster lens and the distant field population (Kneib et al. 1994; Smail, Ellis & Fitchett 1994). Indeed, the obvious next step of just using lensing to select clusters is already underway with the new generation of panoramic imagers on large ground-based telescopes. Lensing analysis of the shear patterns in background field galaxies will provide a mass selected catalogue of clusters and groups at . Unfortunately, extending this approach to requires measuring the shear signal at very faint magnitudes and small angular sizes for the distant field galaxies, which is difficult from the ground.
As a first step in comparing X-ray and lensing mass estimates for a large sample of distant clusters, Smail et al. (1996a) have analysed the gravitational lensing signal detected in deep Hubble Space Telescope (HST) observations using the Wide Field and Planetary Camera (WFPC-2) of 12 rich clusters covering a wide range of X-ray luminosities. The mean redshift of this sample is and they detect shear signals in the fields of 90% of the clusters. As they show, the strength of these shear measurements correlates well with the X-ray luminosity of the clusters. Moreover, by assuming a redshift distribution for the faint field galaxies, in agreement with that observed to by Kneib et al. (1996), Smail et al. converted these shear measurements into mass estimates and compared these to the values inferred from the X-ray luminosities. The observed correlation implies at most a modest decrease in the cluster mass at a fixed luminosity out to . Smail et al. (1996a) stress the observations are compatible with no evolution in the X-ray luminosity versus mass (–) correlation from to at the 99% level.
Bower (1996) discusses the interplay between the evolution of the – correlation and the cluster X-ray luminosity function. Reviewing the limits set at shows that even an approximate measurement of the – relation at would, combined with the results of the current generation of deep X-ray surveys, provide a strong observational constraint on the redshift evolution of the cluster mass function out to .
In the known higher redshift clusters, the comparison of X-ray and lensing masses has only been undertaken for two systems, 3C324 at (Smail & Dickinson 1995) and MS105403 at (Luppino & Kaiser 1996). Using a 64 ks HST/WFPC2 exposure of 3C324, Smail & Dickinson (1995) detected the coherent gravitational distortion created in the images of background field galaxies by the cluster potential. The average shear amplitude was 3% within a 250 kpc radius aperture centered close to the radio source. By assuming a maximum average redshift () for the faint field population at the magnitude limit of their exposure, supported by estimates from detailed modelling of strong cluster lenses at (Kneib et al. 1996) they converted this detection into a lower limit on the cluster mass within the same 250 kpc aperture: . For comparison, the cluster’s X-ray luminosity is 0.3-3.5 erg/sec, indicating a comparable mass normalisation of the – correlation to that observed in the local universe. Luppino & Kaiser (1996) also find rough agreement between their X-ray and lensing masses within the framework of the local – relation. These two luminous X-ray clusters thus give some indication of the – relation at . However to robustly map the – relation at we require lensing observations of clusters across a much wider range of X-ray luminosity.
The success of these observations has prompted us to approach the problem from a different angle. At intermediate redshifts (), radio-loud quasars have been shown to occupy high density regions (Ellingson et al. 1991), specifically they appear to reside in the central regions of moderate richness clusters. The presence of radio-loud quasars within the cores of their host clusters is discussed by Yee & Ellingson (1993), who associate this with the formation of QSOs due to the high gas and galaxy densities in these environments. This result has been extended to higher redshifts (Hintzen et al. 1991; Hutchings et al. 1993, 1995) on the basis of deep ground-based observations using broad- and narrow-band imaging. At even higher redshifts, examples are known of radio sources inhabiting high density environments (e.g. Pascarelle et al. 1996). Our aim is therefore to use radio sources as tracers of high density environments in the distant universe. Deep lensing observations of the fields around these objects will be sensitive to mass concentrations associated with the radio sources. In this way we hope to expand the sample of distant clusters known, as well as providing the lensing mass estimate necessary to determine the – relation for these distant clusters. The advantage of this approach over one starting from a flux-limited X-ray catalog are the much wider range of X-ray luminosities spanned by the final sample (vis. ).
Furthermore, a sample of confirmed massive clusters at would also have considerable interest for studies in a number of other areas. As shown by Smail, Ellis & Fitchett (1994), a massive cluster at also has tremendous potential for furthering our understanding of the redshift distribution of the very faint field population. Moreover, an investigation of the galaxy populations within such clusters is well suited to uncovering observational evidence for environmentally-driven galaxy evolution (Smail et al. 1996b).
While the lensing analysis is a sensitive probe of mass concentrations associated with the distant radio sources, it will also detect foreground mass concentrations along the line of sight. If these are sufficiently massive their shear fields may resemble a rich cluster at the radio source redshift. Although such structures would not be expected to contribute a significant shear signals for any random sightline, these fields may not necessarily be truly ‘random’, in so much as they contain distant, luminous radio sources. At issue is whether amplification by any foreground mass structure has also affected the distant radio source, causing it to be included in a catalog of bright radio sources. This has been a subject of much discussion, especially in regards to the 3C catalogue (Hammer et al. 1986; Hammer & Le Fèvre 1990), where the steep source counts are claimed to make amplification bias a particular problem. Most of the studies of the possible effects of amplification bias in the 3C catalog have relied upon identification of the putative foreground lens (usually expected to be a single galaxy halo – owing to their much large lensing cross section) using direct imaging. Only recently have studies started to search for more massive foreground structures by identifying the weak shear of the background field population produced by the same lens which may be also amplifing the radio source (Bonnet et al. 1993; Fort et al. 1996). However, these searches have so far produced only inconclusive results. The linked issues of the role of amplification bias on distant radio sources and the existence of mass structures associated with the radio sources are therefore still of considerable interest.
In this paper we report the analysis of archival HST/WFPC-2 observations of powerful radio sources at . The data allow us to search for the signature of gravitational lensing from any associated galaxy clusters. The use of HST provides a high sensitivity for the detection of weak shear, far superior to that obtainable in even the best conditions with ground-based telescopes. Its main drawback is the restricted field of view (although similarly small fields have been used in most of the ground-based studies to date) which limits our detection of mass concentrations around the distant radio sources to those systems where the radio source lies within kpc of the cluster core. As we have discussed above this does not appear to be a restriction for the distant radio sources, where a large fraction are expected to lie close to the centres of any structures (c.f. Hutchings et al. 1995), an assumption we can test. The small field will also not produce a significant bias against detecting any foreground structures which are amplifying the distant radio sources, as these are only likely to provide significant amplification if the radio source lies behind the core regions of the foreground lens. Nevertheless, our primary goal is to build up a catalogue of clusters at high redshift which are confirmed as massive structures through the strength of their lensing signal. We present in this work on our first results on the shear fields in a sample of 8 radio galaxies (RG) and radio-loud QSOs (RLQ) at . We begin in §2 by detailing the sample, the observations and their reduction. §3 presents our analysis of the shapes of the faint field galaxies seen in our exposures. We also give the results on the limits on the coherent shear seen in these fields in §4. In §5 translate our shear measurements into mass estimates for structures in the fields and discuss these limits, before giving our main conclusions in §6.
2 REDUCTION
The data analysed in this paper were all taken with the WFPC-2 onboard the HST. These data were retrieved from the HST Archive operated by ST-ECF. We have selected all radio galaxies or QSOs which have been imaged with WFPC-2 for ks in any of the standard wide-red filters and were available in the Archive in early-1996. The majority of these data come from an imaging survey undertaken by Stockton & Ridgway (GO# 5401) of a complete sample of radio galaxies and QSOs. In addition, a second, deeper observation of one of these targets, the QSO 3C336, was taken as part of GO# 5304 (P.I. Steidel), this field is called 3C336#2 to differentiate it from the GO# 5401 exposure. The objects comprise a complete sample of luminous radio galaxies and radio-loud QSOs in the 3C catalogue (Laing, Riley & Longair 1983), selected on the basis of their extended radio flux density. These targets were observed in F622W, F675W or F702W. We give a log of the observations in Table 1.
The shorter integrations comprise 4 orbits on each target, each orbit is split into two exposures to allow removal of cosmic ray events, these 4 orbits are themselves offset by WFPC-2 pixels to allow hot pixel rejection. The longer integrations consist of 4 exposures (2 orbits) at each pointing, rather than 1. The exception is the GO-5304 exposure of 3C336#2 which is in 3 groups of 4 orbits shifted by integer pixel offsets, with each orbit split into 2 exposures. After standard pipeline reduction, the exposures at each pointing were combined using the IRAF/STSDAS task CRREJ, before being aligned using sub-pixel shifts (when required) and high-order polynomial interpolation, and finally coadded. The PC chip was removed, owing to its lower surface-brightness sensitivity and the sky levels in the remaining 3 WFC chips equalized, before mosaicing them together. The mosaicing uses integer pixel shifts to roughly position the 3 chips relative to each other. This is sufficient to align objects lying across the chip boundaries at the pixel level and has the advantage over a true astrometric mosaic that the data is not further resampled. We chose to transform the various observed passbands to the standard Cousins using the zero points and colour corrections from Holtzman et al. (1995) and assuming a median color of (Smail et al. 1995b). The galactic extinction for these radio sources given by NED is at or below and so we have not applied any correction. The final images cover a region of Mpc111We take and km/sec/Mpc across at the radio source distance to the 50% completeness limits listed in Table 1.
To catalog faint objects in these frames and measure their shapes we use the SExtractor image analysis package (Bertin & Arnouts 1996). We adopt a detection isophote equivalent to above the sky, where is the standard deviation of the sky noise measured pixel to pixel and a minimum area after convolution with a 0.3 arcsec diameter top-hat filter of 0.12 arcsec2. After automated detection and deblending, the object catalogs for each frame were visually inspected and spurious or unreliable objects were removed, as well as those within 1.5 arcsec of any CCD boundary. In several frames, a proportion of the initial area was lost due to contamination by stellar diffraction spikes. The analysis of our frames provides catalogs of 200–400 objects in each of the radio galaxy fields.
We apply three further cuts to the resulting catalogues before using them in the lensing analysis. The first two cuts are on magnitude. We discard all objects fainter than (values for each frame are given in Table 1) to remove objects with inadequate signal-to-noise for measuring reliable shapes. We also apply a bright magnitude cut to reduce foreground contamination, retaining only galaxies with , the brightness of a non-evolving galaxy in a cluster. This should guarantee that a large fraction of the field galaxies in our sample lie at redshifts . Finally, we remove all objects with ellipticities or , where and and are the major and minor axis lengths of an object in order to exclude objects that are either too round to accurately determine their orientations or are so elongated that their ellipticity is almost certainly intrinsic (Mellier & Fort 1996). The final catalogues used in the lensing analysis contain 100–170 objects in the shorter exposures, corresponding to surface densities of 25–40 arcmin-2 (Table 1). Significantly higher object surface densities are obtained by stacking the data for the individual radio sources as discussed in Section 4.2.
3 ANALYSIS
3.1 Shear Fields and Likelihood Maps
To search for the effects of lensing we evaluate the complex shear: , where is the position angle of the major axis of the object, for every object in the catalog (Kneib et al. 1996). In order to obtain an initial impression of the shear field around each source, we binned the estimates from the individual objects into independent cells. The resulting vectors can be plotted as a vector field over the image. An example of this is shown in Figure 1.

In order to obtain a quantitative measurement of the shear field around each of the sources, we adopted a smoothing technique based on Kaiser & Squires (1993, KS). At a fine grid of points overlayed on the image, we constructed the probability distribution for the tangential alignment of faint galaxies around that point. For this we calculate the average tangential shear, , where is the angle between an object’s major axis and the vector joining it to the grid point, using a weighting function () as described by KS. The form of the fourier-space transfer function was chosen to match the signal expected for an isothermal sphere, but with high-frequency components suppressed according to the Weiner filter criterion. If a cluster lies within, or close to, our frame, the shear signal would be present (with falling amplitude) across the full extent of the HST image: this is properly accounted for by the weighting function we use. The smoothing scale was chosen so as to give greatest weight (ie. ) to galaxies lying in an annulus from – kpc around each point (Figure 2). This procedure provides a quantitative measurement of the coherence of the shear pattern around each point. In order to estimate its statistical significance, we compare this to the distribution of this value for a null shear field, estimated by bootstrap resampling the galaxy shapes. The random catalogues are created by assigning each galaxy in the original catalogue a new ellipticity and orientation drawn at random from the other galaxies. This preserves the ellipticity distribution and incomplete spatial coverage of the original catalogue but ensures that any true lensing signal is eliminated. The shear signal in this mock catalogue is then evaluated across the grid and the shear values measured compared with those determined from the original catalogue. Repeating the procedure 1000 times allows us to produce a map of the significance of the observed signal. An example is shown as a contour plot in Figure 1. The maps of the shear likelihood provide a useful visually confirmation of the significance of any maxima associated with a particular radio source. Finally, we note that while the filtering scheme designed above is optimal for the detection of clusters with isothermal mass profiles, we obtained almost identical results using the Gaussian-filtered point mass algorithm described by KS.

To determine the contribution from possible distortion in the instrument optics we turn to the discussion in Smail & Dickinson (1995). They use deep WFPC-2 pointings of blank fields from the Groth Strip to estimate the possible instrumental shear signal at the position of the detected mass concentration in their observations of the field of 3C324. Using the same deep, blank field observations we estimate instrumental shear limits of % (GO# 5401) and % (GO# 5304) for the positions of the target radio sources in the present observations. These are measured inside a 300 kpc diameter aperture centred on the relevant position in the WFPC-2 field-of-view.
3.2 Modelling
The shear probability maps described above do not directly correspond to the distribution of mass across the frame. Firstly, the spatial coverage of the data is extremely limited. At the edges of the frame the significance of a given lensing mass is suppressed because (i) a smaller number of objects contribute to the signal (after the weighting scheme had been applied) thus enhancing the noise level, and (ii) the average shear signal is lower because of the greater distance of the objects from the assumed centre of the mass concentration. Secondly, our weighting scheme is based on the assumption that only one isothermal mass concentration is present, and, for our choice of weighting function, the resulting shear map does not correspond to a simple convolution of the mass distribution. These difficulties are extensively discussed by KS and Squires & Kaiser (1995).
In order to obtain an estimate of the mass associated with each of our 3C targets, we adopt a different approach that is based on simulating the observed signal. Assuming a lens redshift and a redshift distribution for the catalogued objects (see below), we calculate the average shear signal expected as a function of the lensing cluster’s velocity dispersion. To estimate the efficiency of our shear measurements we use the same approach discussed by Smail et al. (1996a), from this we estimate a mean shear measurement efficiency of for galaxy images with the signal-to-noise typical of this study. We include this factor in the calculation below. The resulting shear signal depends on the position of the mass within the frame, and on the distribution of objects across the frame. A separate calculation is therefore required for each of the catalogues listed in Table 2. This establishes the procedure for estimating the lensing mass from the mean shear signal as a fraction of the critical lensing mass. The critical mass depends, however, on the redshift of the lens and the redshift distribution () of the faint galaxies used to map the shear distortion. Estimating the at these depths is not a straight forward task, and involves some uncertainty, although our knowledge of the distances to the very faint field population is rapidly improving (c.f. Kneib et al. 1996). We follow the procedure described by Smail & Dickinson (1995), assuming that the redshift distribution has the form:
For our fiducial model, we adopt , for which . where is the mean redshift of the field distribution. For our chosen magnitude limits the median redshift of the field population is (Kneib et al. 1996) for –25.6, this is close to the ‘no evolution’ prediction and hence we have used this model to extrapolate this to slightly fainter limits. Using this model we obtain median redshifts of and for magnitude limits of and respectively. Alternatively, using the galaxy evolution models which fit the colour distributions in the HDF (Metcalfe et al. 1996) we would expect . We can now use this to estimate masses for any structure whose shear signal we detect. One interesting limit is to assume that the cluster is physically associated with the radio source, and to adopt the conservative assumption that only 50% of the field population lie beyond the lens, consistent with the claimed by Kneib et al. (1996). This yields an upper limit on the mass of the lens. If a higher proportion of objects lie beyond the lens, either because the lens is foreground to the radio source or because the median faint object redshift is considerably greater than , the real mass will be less. For simplicity, the mass estimates we quote in the following sections are given in terms of the velocity dispersion of the isothermal halo. These can, however, be converted to the mass contained within an radius using the relation .
4 RESULTS
Table 2 sumarises the results of our shear analysis applied to each of the 3C fields in turn. We restrict our selection to only those maxima within a diameter aperture around the radio galaxy. In only one case, 3C336#2, do we detect a highly significant () shear peak within this distance of the radio source. We discuss the interpretation of this signal in the next section. Expanding our search to the entire WFPC-2 field, we find only one additional example of a statistically significant peak (), in 3C212. Returning to the kpc detection aperture, the next largest likelihood after 3C336 is , measured for 3C289. Thus in 7 of the fields we find no evidence of a coherent shear pattern to the limits of our data. For these fields, we estimate the 99% confidence limit on our detections in order that we can quantify the upper limit on any lensing mass. The detection limits lie between 3.0 and 4.4% (Table 2). We confirmed that these limits were realistic by comparing these limits with the unconstrained maxima seen in the shear significance maps. Although no shear signal has been detected in these images individually (3C336 and 3C336#2 apart), we may probe to deeper limits by co-adding the data-sets. The resulting velocity dispersion limits from our observed shear fields are given in Table 2, using the measured signal in the case of 3C336#2, and the detection limit in the other cases where no significant shear signal was measured.
4.1 3C336
In the case of 3C336, a highly significant () shear signal is detected in the longer exposure F702W image (3C336#2), centred close to the radio source position. It is possible with some imagination to pick out a weak circular pattern in the shear vectors around the radio source in Figure 1, although there are no good candidates for strongly lensed features (arcs or pairs) in the field. The amplitude of the average weighted shear is %. A signal of similar amplitude is also seen in the shorter F622W image of this field, close to the position of the shear peak in the F702W image, confirming the detection. However, the significance of this shear pattern is lower due to the smaller number of objects in the F622W catalogue. It should be also noted that the position of the radio source and the roll-angle of the two observations of 3C336 are different, giving further confidence that the signal is not due to distortions introduced by the WFPC-2 optics. We have also used a brighter galaxy sample, –24.5, to test if the shear field is detectable in these brighter galaxies (which are expected to predominantly lie at ). We obtain an average shear of 2.3% with a likelihood only , indicating that the signal is consistent with the noise.
A detection of weak coherent shear in the field of 3C336 has already been suggested by Fort et al. (1996) using deep ground-based imaging. They report a marginal detection with a peak shear signal of % from the analysis of faint galaxy images detected in an 18 ks exposure with CFHT in arcsec seeing. The position of their peak agrees with ours within their error ellipse. The peak shear they report is uncorrected for instrumental and atmospheric degredation, from the simulations in Smail et al. (1995a) we would estimate that the efficiency factor for measuring shear under conditions similar to those experienced by Fort et al. (1996) would be around . Correcting their observed shear with this we obtain an intrinsic shear strength of %, in reasonable agreement with our value of %, after also correcting for our measurement efficiency. These independent detections indicate that a mass over-density exists in the 3C336 field, which lies in front of a substantial fraction of the faint field population. Additional evidence for a possible galaxy over-density around 3C336 has also been provided by Hintzen et al. (1991) from their ground-based imaging, where they show that this field contains a significant excess of galaxies close to the QSO (Figure 3).
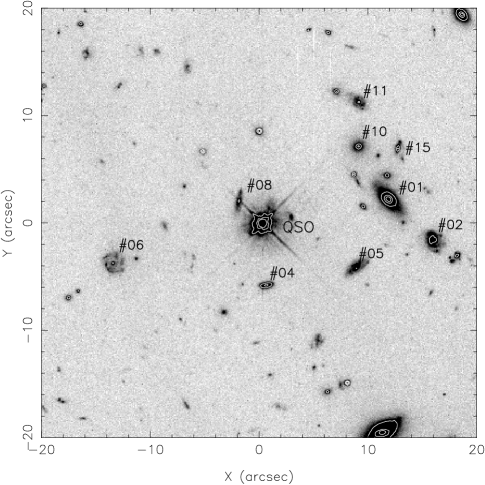
We now discuss other constraints on the possible redshift of the mass concentration responsible for the shear field we observe. In this we are considerably aided by the spectroscopy of galaxies in this field undertaken by Steidel & Dickinson (1992, SD92), as well as the multi-colour imaging of the field from both Hintzen et al. (1991) and SD92. We start by discussing the morphologies of the galaxies visible close to the shear peak from the WFPC-2 imaging shown in Figure 3, in what follows we use the numbering scheme of SD92 to identify the galaxies. For a rich cluster we would expect that a significant proportion of the galaxies associated with the structure would be early-type systems, consistent with other morphological studies at similar redshifts (Smail et al. 1996b; Faber et al. 1996). Of the galaxies close to the peak, the most obvious are of course the brighter and hence typically lower redshift ones (Figure 3). These include (in approximately decreasing brightness): #1, a bright Sa galaxy; #2, a face-on spiral with no measured redshift; # 4, a late-type spiral at ; # 5, an Scd at ; #6, another face-on spiral with no measured redshift; #8, a mid-type spiral close to the QSO for which a tentative detection of [OII]3727 at was reported by Thompson et al. (cited by SD92) and # 11, a small spiral at . As expected most of these bright galaxies are known to be foreground to the QSO, and all have morphologies typical of the general field population. SD92 claim that the existence of two galaxies at in this field might indicate a structure at that redshift, but if so this system apparently lacks any early-type galaxies. Given the lensing mass required for such a structure at (see below), the absence of at least a few early-type galaxies seems unusual. Of more relevance are the fainter galaxies, for which at the QSO redshift, these include a large elliptical (# 10) and a possible spheroidal galaxy (# 15). SD92 show spectroscopy of # 10 and state that it is consistent with being an early-type galaxy at , further supported by its red infrared colours. # 15 lacks spectroscopic information, but it ranks alongside # 10 as being one of the reddest objects in the field, consistent with an early-type galaxy at .
We return to discuss the properties of the 3C336 field in Section 5.
4.2 The Combined Dataset
Coadding the data-sets from the exposures of the individual fields allows us to more accurately measure the average shear distortion in the field and thus to determine, or set an improved limit on, the typical mass associated with the radio sources. Both 3C336 images have been excluded from the coaddition, since has already been shown to have an associated lensing signal. In essence, this test will discriminate whether the signal seen towards 3C336 is the tip of an iceberg — with the other sources being associated with similar mass lenses which we are missing due to the shallower exposures — or whether 3C336 (or its line of sight) is exceptional.
The data taken for GO# 5401 all have the radio sources in a single position in the WFPC-2 field-of-view, this allows us to simply merge the catalogues from the individual fields without having to shift the field centres. As long as the radio sources lie within kpc of the cluster centres then the shear fields will add coherently within our detection aperture. The merged catalogue contains 1231 objects, but in order to allow direct comparison with the results presented above we use the shear detection same algorithm without attempting to reoptimise the smoothing scale-length. Despite the large number of objects in the catalogue, a significant shear signal is still not detected near the composite source position (Table 2). The local maxiumum is only slightly more than a 1 deviation, and is associated with an average shear signal of only 0.7%. The 99% detection limit that we determine for the merged catalogue is 1.4%. This would indicate that the field around 3C336 is exceptional in the mass concentrations contained within it, or the position of the radio source relative to them.
5 DISCUSSION
For many of the individual fields, the shear limits given in Table 2 imply only a very weak contraint on the lensing mass: even at the present epoch very few clusters have velocity dispersions in excess of 1100 km/s. A tighter limit comes from considering the combined data set. This is sufficient to set a limit of 700 km/s on the average mass of the lens under the assumptions made above. If we move the lens to a lower redshift, or if we are more generous with the fraction of faint objects lying at redshifts greater than the radio source (as would be expected if we used the predicted from the HDF color modelling), the limit becomes increasingly stringent (Table 2). For example, assuming that % of the faint objects lie beyond the radio galaxy or alternatively moving the lens to reduces the allowed velocity dispersion of the ‘average’ structure inhabited by these luminous radio sources to km/s, equivalent to a central mass of only .
For the deeper 3C336#2 observation, the detected shear can be translated into an estimate of the lensing mass. In the case that the lens is physically associated with the radio source and roughly 50% of the field population lie beyond it, then we obtain km/s equivalent to a mass of . Again moving the lens to , or assuming that % of the faint field population to lie beyond , brings this estimate down to km/s and . The crucial question for the mass is thus the redshift of the lens. The discussion of the 3C336 field given above, while not conclusive, does indicate that there may be a number of red, spheroidal galaxies in the region where the gravitational shear peaks. The limited spectroscopy, colours and apparent magnitudes are all consistent with these galaxies lying in a cluster at the radio source redshift. 3C336 has also been shown to have very extended [OII]3727 emission reaching to kpc (Bremer et al. 1992). Bremer et al. have modelled the emission line gas and conclude that the radio source is embedded in a very large cooling flow, with a mass deposition rate typical of the most massive local clusters. There is some support, therefore, for thinking that the lens is associated with the radio source and thus represents a massive cluster at . Unfortunately for our attempt to map the – relation at high redshift the QSO 3C336 will contribute to the X-ray emission, making measurement of the X-ray luminosity of the underlying cluster emission extremely difficult from low resolution X-ray imaging. Nevertheless, the identification of the shear field in this field, using modest exposures taken from the HST archive, indicates that an extension of the survey to larger sample may produce a number of distant cluster candidates which are better suited to X-ray follow-up.
If 3C336 does lie in the central regions of a distant massive cluster, then can we tell if this is true of distant luminous radio sources in general? Unfortunately, the relatively low sensitivity of the shear fields in our other fields means we cannot address this on an object-by-object basis. Nevertheless, by combining the 7 fields we can achieve the required sensitivity. Analysis of this combined catalog finds no evidence for a coherent shear around the radio source position. The sensitivity of our limit allows us to state that the majority (%) of 3C sources at do not inhabit the central regions ( kpc) of massive clusters (, 99% c.l.). Given the claim by Hutchings et al. (1995) that the majority of the QSOs they imaged show strong excesses of faint galaxies within kpc, our observations would limit the masses of the structures inhabited by these galaxies to , consistent with a poor cluster or group.
If instead the mass structure in the 3C336 field is foreground then we must ask what effect this might have on the observations of the background radio source and whether amplification bias from such structures might be a significant feature of the distant radio catalogues. Assuming the lens lies at and that the shear peak has a small core radius, we would estimate an amplification of roughly –1 mag, depending upon the exact size of any core in the mass distribution. Bartelmann & Schneider (1992) have simulated the expected amplification for random lines of sight. Taking our typical shear sensitivity, %, their simulations indicate that roughly 13% of sightlines would show shear peaks above this value. More recent work by Wambsganss et al. (1996) would indicate a similar fraction. It should also be noted that if amplification bias is a strong effect in the 3C catalog then we should obtain detections in a higher proportion of fields than the ‘random’ expectation, perhaps even doubling the frequency. This range would then consistent with our observation of –20% (1–2 of 8, depending on the detection aperture used) although significantly more data would be required to conclusively test this prediction.
6 CONCLUSIONS
We now restate our main conclusions:
We have searched the fields of 8 luminous radio sources, both radio galaxies and radio-loud quasars for the signature of gravitational lensing. To achieve this we have analysed the coherence of the shear field determined from the shapes of faint galaxies () in deep archival HST/WFPC-2 images.
We find evidence for a significant shear field (%) peaked close to the radio-loud QSO 3C336 at . The mass concentration reponsible is present in two independent WFPC-2 images, as well is a previously reported ground-based observation by Fort et al. (1996).
The characteristics, magnitudes and colours, of the early-type galaxies lying close to the shear peak are consistent with them lying at high redshift (), as is the limited spectroscopic information. In addition the coherent shear signal is not detected in a brighter sample of galaxies in the field which can reasonably be expected to lie at . We therefore propose that the shear field may be produced by a cluster associated with the radio source at . In this case, adopting a redshift distribution for the faint field galaxies in our analysis (), we infer a mass of within kpc for the cluster. Placing the field population at higher redshifts, or moving the lens in front of the radio source will decrease this mass estimate.
In the remaining 7 fields analysed we find no evidence for coherent shear patterns around the radio sources. However, the individual exposures are sufficiently shallow that this conclusion is not strong, the 99% confidence limit on the mean mass is . In an attempt to strengthen it we combined the shear fields in the 7 exposures to obtain a higher sensitivity in our shear measurement. Using this approach we are able to set an upper limit on the mean induced shear associated with any mass structures in these 7 fields corresponding to . This implies that the average luminous radio source does not typically inhabit the central regions of massive clusters.
The absence of a detected shear pattern in the composite catalogue also indicates that the bulk of these distant radio sources are not strongly lensed by massive foreground structures (i.e. considerably larger than individual galaxy haloes). Our observations appear consistent with the expectations for lensing of distant radio sources within standard cosmological models (e.g. Bartelmann & Schneider 1992; Wambsganss et al. 1996) although significantly larger samples would be needed to test these predictions.
We have demonstrated that it is easily within the capabilities of HST to detect shear fields associated with moderate mass clusters in modest integrations ( orbits). Expanding these observations to a larger sample of candidates will be a necessary first step to understand the X-ray observations of distant clusters which will come from the next generation of X-ray telescopes. These HST observations will also greatly benefit from the larger field of view available from the Advanced Camera when it is added to the HST instrument complement in 1999.
ACKNOWLEDGMENTS
RGB and IRS acknowledge support from the University of Durham and computer resources supported by the Starlink project. IRS also acknowledges support through a PPARC Advanced Fellowship. We would like to thank Ale Terlevich and Jean-Paul Kneib for their helpful comments and assistance.
References
- [Abell 1958] Abell, G.O., 1958, ApJS, 3, 211.
- [Bartelmann & Schneider 1992] Bartelmann, M. & Schneider, P., 1992, A&A, 259, 413.
- [Bertin & Arnouts 1996] Bertin E. & Arnouts, S., 1996, A&AS, 117, 393.
- [Bonnet et al. 1993] Bonnet, H., Fort, B., Kneib, J.-P., Mellier, Y. & Soucail, G., 1993, A&A, 280, L7.
- [Bower et al. 1996] Bower, R.G., Hasinger, G., Castander, F.J., et al., 1996, MNRAS, 281, 59.
- [Bower 1996] Bower, R.G., 1996, MNRAS, submitted.
- [Bremer et al. 1992] Bremer, M.N., Crawford, C.S., Fabian, A.C. & Johnstone, R.M., 1992, MNRAS, 254, 614.
- [Castander et al. 1995] Castander F.J., Bower, R.G., Ellis, R.S., et al., 1995, Nature, 377, 39.
- [Couch et al. 1991] Couch, W.J., Ellis, R.S., Malin, D.F. & Maclaren, I., 1991, MNRAS, 249, 606.
- [Eke, Cole & Frenk 1996] Eke, V.R., Cole, S. & Frenk, C.S., 1996, preprint (astro-ph/9601088).
- [Ellingson, Yee & Green 1991] Ellingson E., Yee H.K.C. & Green R.F., 1991, ApJ, 371, 49.
- [Evrard & Henry 1991] Evrard, A.E. & Henry, J.P., 1991, ApJ, 383, 95.
- [Faber et al. 1996] Faber, S.M., et al., 1996, preprint.
- [Fort et al. 1996] Fort, B., Mellier, Y., Dantel-Fort, M., Bonnet, H. & Kneib, J.-P., 1996, A&A, 310, 705.
- [Gioia & Luppino 1994] Gioia, I.M. & Luppino, G.A., 1994, ApJS, 94, 583.
- [Gunn, Hoessel & Oke 1986] Gunn, J.E., Hoessel, J.G. & Oke, J.B., 1986, ApJ, 306, 30.
- [Hammer, Nottale & Le Fèvre 1986] Hammer, F., Nottale, & Le Fèvre, O., 1986, A&A, 169, L1.
- [Hammer & Le Fèvre 1990] Hammer, F. & Le Fèvre, O., 1990, ApJ, 357, 38.
- [Henry et al. 1992] Henry, J.P., Gioia, I.M., Maccacaro, T., Morris, S.L., Stocke, J.T. & Wolter, A., 1992, ApJ, 386, 408.
- [Hintzen, Romanishin & Valdes 1991] Hintzen, P., Romanishin, W. & Valdes, F., 1991, ApJ, 366, 7.
- [Holtzman et al. 1995] Holtzman, J.A., Burrows, C.J., Casterno, S., Hester, J.J., Trauger, J.T., Watson, A.M. & Worthey, G., 1995, PASP, 107, 1065.
- [Hutchings et al. 1993] Hutchings, J.B., Crampton, D. & Persrom, D., 1993, AJ, 106, 1324.
- [Hutchings et al. 1995] Hutchings, J.B., Crampton, D. & Johnson, A., 1995, AJ, 109, 73.
- [Kaiser & Squires 1993] Kaiser, N. & Squires, G., 1993, ApJ, 404, 441.
- [Kaiser & Squires 1993] Kaiser, N. & Squires, G., 1993, ApJ, 404, 441.
- [Kneib et al. 1996] Kneib, J.-P., Ellis, R.S., Smail, I., Couch, W.J. & Sharples, R.M., ApJ, 1996, 471, 643.
- [Laing, Riley & Longair 1983] Laing, R.A., Riley, J.M. & Longair, M., 1983, MNRAS, 204, 151.
- [Luppino & Kaiser 1996] Luppino, G. & Kaiser, N., 1996, preprint.
- [Mellier & Fort 1994] Mellier, Y. & Fort, B., 1994, ARAA, Gravitational Lensing, Kluwer.
- [Pascarelle et al. 1996] Pascarelle, S.M., Windhorst, R.A., Driver, S.P., Ostrander, E.J. & Keel, W.C., 1996, ApJL, 456, L21.
- [Postman et al. 1996] Postman, M., Lubin, L.M., Gunn, J.E., Oke, J.B., Schneider, D.P., Hoessel, J.G. & Christensen, J.A., 1996, AJ, 111, 615.
- [Rosati et al. 1995] Rosati, P., Della Ceca, R., Burg, R., Norman, C. & Giacconi, R., 1995, ApJ, 445, 11.
- [Metcalfe et al. 1996] Metcalfe, N., Shanks, T., Campos, A., Fong, R. & Gardner, J.P., 1996, Nature, 383, 326.
- [Smail, Ellis & Fitchett 1994] Smail I., Ellis R.S. & Fitchett, M.J., 1994, MNRAS, 270, 245.
- [Smail & Dickinson 1995] Smail I. & Dickinson M., 1995, ApJ, 455, L99.
- [Smail et al. 1995] Smail I., Ellis R.S., Fitchett, M.J. & Edge, A.C., 1995a, MNRAS, 273, 277.
- [Smail et al. 1995] Smail I., Hogg, D.W., Yan, L. & Cohen, J.L., 1995b, ApJL, 449, L105.
- [Smail et al. 1996a] Smail I., Ellis R.S., Dressler, A., Couch, W.J., Oemler, A., Butcher, H. & Sharples, R.M., 1996a, ApJ, in press.
- [Smail et al. 1996b] Smail I., Dressler, A., Couch, W.J., Ellis, R.S., Oemler, A., Butcher, H. & Sharples, R.M., 1996b, ApJS, in press.
- [Squires & Kaiser 1995] Squires, G. & Kaiser, N., 1996, preprint (astro-ph/9512094).
- [Steidel & Dickinson 1992] Steidel, C.C. & Dickinson, M., 1992, ApJ, 394, 81
- [Tyson, Valdes & Wenk 1990] Tyson, J.A, Valdes, F. & Wenk, R.A., 1990, ApJ, 349, L1.
- [Wambsganss et al. 1996] Wambsganss, J., Cen, R. & Ostriker, J.P., 1996, preprint (astro-ph/9610096).
- [Yee & Ellingson 1993] Yee, H.K.C. & Ellingson, E., 1993, ApJ, 411, 43.
| ID | RA | Dec | Type | Texp | Filter | Proposal | |||
|---|---|---|---|---|---|---|---|---|---|
| (J2000) | (J2000) | (ks) | (50%) | ||||||
| 3C2 | 00 06 25.3 | 00 03 59 | 1.037 | RLQ | 17.6 | F675W | 26.1 | 157 | GO-5401 |
| 3C212 | 08 58 38.2 | 14 09 57 | 1.048 | RLQ | 17.6 | F675W | 26.1 | 167 | GO-5401 |
| 3C217 | 09 08 46.7 | 37 48 30 | 0.897 | RG | 7.2 | F622W | 25.6 | 97 | GO-5401 |
| 3C237 | 10 07 56.9 | 07 30 31 | 0.877 | RG | 8.0 | F622W | 25.6 | 111 | GO-5401 |
| 3C245 | 10 42 41.5 | 12 03 50 | 1.029 | RG | 17.6 | F675W | 26.1 | 133 | GO-5401 |
| 3C280 | 12 57 01.8 | 47 20 48 | 0.996 | RG | 8.8 | F622W | 25.6 | 108 | GO-5401 |
| 3C289 | 13 45 29.9 | 49 47 05 | 0.967 | RG | 8.0 | F622W | 25.6 | 143 | GO-5401 |
| 3C336 | 16 24 37.4 | 23 45 56 | 0.927 | RLQ | 7.2 | F622W | 25.6 | 106 | GO-5401 |
| 3C336#2 | 24.0 | F702W | 27.0 | 330 | GO-5304 |
| ID | shear | 99% det. | Likelihood | ||
|---|---|---|---|---|---|
| (%) | limit | () | (km/s) | (km/s) | |
| 3C2 | 1.9 | 3.0 | 1.20 | ||
| 3C212 | 2.3 | 3.2 | 1.27 | ||
| 3C217 | 0.0 | 4.2 | 0.42 | ||
| 3C237 | 1.2 | 3.7 | 0.68 | ||
| 3C245 | 2.5 | 3.3 | 1.42 | ||
| 3C280 | 1.7 | 4.4 | 0.79 | ||
| 3C289 | 3.5 | 3.3 | 1.95 | ||
| 3C336 | 3.9 | 3.8 | 2.15 | ||
| 3C336#2 | 4.0 | 2.5 | 3.30 | ||
| Combineda | 1.25 | 0.7 | 1.40 |
| (a) | Combined field consists of all images excluding 3C336 and 3C336#2. The upper mass limit is computed using |
| the average radio source redshift of and a mean background field redshift of . |