02 (11.17.3 13.07.1)
N. Schartel
2 Affiliated to the Astrophysics Division, Space Science Department, ESTEC,
3 INSA; ESA IUE Observatory, P.O. Box 50727, E-28080 Madrid, Spain
4 Depto. de Astronomía, Univ. Guanajuato, Apdo. Postal 144, 36000 Guanajuato, Mexico
5 Max-Planck-Institut für extraterrestrische Physik, 85740 Garching, Germany
Gamma-Ray Bursts from Radio-Quiet Quasars
Abstract
We study positional coincidences between gamma-ray bursts in the BATSE 3B catalogue and quasars/AGN taken from the Véron-Cetty & Véron compilation. For most classes of AGN, for BL Lac objects and for radio-loud quasars, we find no excess coincidences above random expectation, and we give upper limits for their burst emission rate.
However, surprising evidence is found for a positional correlation between gamma-ray bursts and radio-quiet quasars. A total of 134 selected bursts with a position error radius 18 and the nearest and intrinsically brightest radio-quiet quasars ( and ) have a probability of 99.7% to be associated with each other. An analysis of a smaller sample of well-localized interplanetary network gamma-ray burst positions supports this result. This correlation strongly favours the cosmological origin of gamma-ray bursts and enables to estimate its distance scale. The average luminosity of those gamma-ray bursts which we associate directly with radio-quiet quasars is of the order of erg (assuming isotropic emission).
keywords:
Gamma-rays: bursts, AGN: general, Quasars: general1 Introduction
The nature of gamma-ray bursts (GRBs) remains an enigma, even nearly 30 years after their discovery with the Vela satellites in 1967 (Klebesadel et al. 1973). The bursts detected with the Burst and Transient Source Experiment (BATSE) on board the Compton Gamma-Ray Observatory (CGRO) show that their positions are completely consistent with isotropy. For the subsample of 1005 GRBs in the 3B BATSE catalogue the Galactic dipole moment is within of the value expected for isotropy, and the observed Galactic quadrupole moment deviates only (Briggs et al. 1996) from isotropy.
Thus, GRBs are distributed significantly more isotropic than any known Galactic population and most of the Galactic models are no longer in agreement with the data (cf. e.g. Briggs et al. 1996, Hartmann et al. 1995). A spherical dark matter halo model could still be consistent with the measured burst positions, but requires a core radius larger than necessary to explain the Galaxy’s rotation curve (Hakkila et al. 1994; Caldwell & Ostriker 1981; Briggs et al. 1996). Extended halo models have to place the typical BATSE GRB farther away than about 100 kpc in order to obtain the measured isotropy. On the other hand, the observed bursts must be closer than about 350 kpc, because no excess of bursts is observed in the direction of M31. Neutron stars born with velocities exceeding the local Galactic escape velocity have been proposed to match these requirements (Podsiadlowski et al. 1995), but in order to obtain isotropy of bursts, only a very small fraction of low-velocity neutron stars are allowed to burst in this model. Moreover, a delayed turn-on is necessary to avoid a concentration of bursts to the Galactic disk (see e.g. Li & Dermer 1992; Briggs et al. 1996).
The alternative possibility, a burst location at cosmological distances, does not require to postulate additional restrictions (Paczyński 1986). Also, the observed inhomogeneity of the bursts’ radial distribution can be regarded as supportive evidence for this idea. The number of faint bursts shows a deficit with respect to the power law of slope of a homogeneous distribution in Euclidean space (Schmidt et al. 1988). This can be explained naturally if faint bursts are located at high redshift (Paczyński 1991; Dermer 1992; Piran 1992). There have been many attempts to estimate the redshift range of GRB sources from their brightness distribution (e.g. Fenimore et al. 1993b; Fenimore & Blom 1995). Whereas a redshift of about 0.1 for the nearest bursts seems likely, only a very crude estimate of the redshift of the faintest bursts can be made ( through ). Apart from the uncertainty in the cosmological parameters, such studies suffer from the unknown evolution function of the burst sources and the corresponding emission rate (see Sect. 4.1) as function of redshift (Rutledge et al. 1995).
The realization that gamma-ray measurements alone may be not sufficient to solve the GRB mystery has prompted increasing attempts for counterpart searches of GRBs at various wavelengths. Two different methods are possible to search for GRB counterparts:
(1) Because of the typically large errors of burst positions and the huge number of quiescent objects within each GRB error box, one method consists of simultaneous observations at other wavelengths (X-ray, optical, IR, radio) to search for transient sources during the GRB event (see recent reviews by Hartmann 1995, Greiner 1995). As a result of these studies, there is solid evidence that gamma-ray bursts do not produce simultaneous optical flashes brighter than about 5th mag for an assumed duration of 1 sec (Greiner et al. 1996) or simultaneous radio emission stronger than 10-13 erg cm-2 s-1 (Cortiglioni et al. 1981; Inzani et al. 1982).
(2) The second, more statistical approach is the search for positional coincidences of GRB locations with comparison samples of any other known class of astronomical object. Various types of catalogued objects, both Galactic and extragalactic, were compared with the BATSE gamma-ray error boxes, but any correlation between these and the bursts was compatible with random expectation. (i) Webber et al. (1995) looked for catalogued counterparts of 60 bursts with the smallest error boxes available () and found no position coincidences above random expectation for extragalactic objects (see, however, Sect. 5.2.2. for our investigation of the latter sample). (ii) Gorosabel et al. (1995) found no significant correlation between 44 GRBs localized by the WATCH instrument to less than one square degree and objects (galactic and extragalactic) listed in 33 different catalogues. (iii) Extremely rare events in external galaxies, for example merging neutron stars, are one possibility to explain an extragalactic origin of GRBs (Eichler et al. 1989; Paczyński 1991). Under such a hypothesis a correlation between burst positions and the large-scale structure of matter should be expected. The concentration of nearby galaxies towards the super-galactic plane offers the possibility to search for counterparts up to a redshift of . Hartmann et al. (1996) found no compelling evidence for a concentration of GRBs to the super-galactic plane in the 3B catalogue. (iv) With a likelihood method that compares the counts-in-cell distribution of gamma-ray bursts with the one expected from the known large-scale structure of the Universe, Quashnock (1996) argued that the nearest bursts originate at a redshift and the farthest ones at . (v) However, searches for a correlation between GRB and the direction of rich clusters of galaxies (situated right in the above redshift range) did not arrive at consistent results (Howard et al. 1993, Nemiroff et al. 1994, Deng et al. 1995, Kolatt & Piran 1996, Marani et al. 1996). From a comparison of the angular correlation functions of GRBs and that of extragalactic radio sources, Kurt & Komberg (1995) concluded that gamma-ray bursts do not belong to a normal population of galaxies with .
If we assume that GRBs are emitted at cosmological distances and keep in mind that no clear correlation was found with either clusters of galaxies or the super-galactic plane then it seems unlikely that any normal constituents of galaxies can cause gamma-ray bursts. The most promising sources with a different nature are quasars and active galactic nuclei (AGN). They had been suggested as GRB sources by Prilutski & Usov (1975) shortly after the discovery of GRBs (Klebesadel et al. 1973).
Both, the number of bursts with relatively small error boxes, and the number of identified AGN and quasars are increasing permanently. Webber et al. (1995) used the 1989 version of the Véron-Cetty & Véron compilation of QSOs and AGN. The fact that the number of known quasars and AGN has doubled since then has motivated us to check their results with improved statistics. A further chance to find correlations arises if only a certain subclass of the AGN or quasars are counterparts of GRB. In that case the mean distance between the members of the sample will increase and the error of the gamma-ray burst position will play a less important role. We have therefore not only repeated the work of Webber et al. (1995) with larger samples, but extended the search for correlations to various subclasses of AGN.
Our paper is arranged as follows. In the first part of Sect. 2 the GRB sample and the methods used to search for correlations are introduced. In the second part we provide the samples of AGNs and quasars as well as different subclasses. Our search for correlations between GRBs and various subclasses is given in the first part of Sect. 3. In the second part we study in more detail those subclasses which show a positive correlation. The final results are described in Sect. 4 and we elaborate on the one positive correlation found. Finally, we discuss our results in the light of previous studies in Sect. 5 and conclude with some remarks in Sect. 6.
2 The Samples and the Analysis Method
2.1 The sample of observed bursts
The 3B catalogue of GRBs (Meegan et al. 1996) provides the position of 1122 events, together with a statistical error, , which is defined by the formal covariance matrix from a -test on the assumption of normal errors. The circle with this radius centered on the fitted position of the burst corresponds to the 68% confidence ellipse. This error is based on the Poisson uncertainty in the BATSE measurement of the burst flux by each Large Area Detector and is believed to have a Gaussian distribution (cf. the description of the 3B catalogue). For many bursts the additional systematic error of 16 is larger than the formal error. Its distribution is not very well known, but may have a more extended tail than a Gaussian (Pendleton et al. 1996). Combination of both errors results in a total error, , of
| (1) |
which is an estimate of the 68% confidence interval for the burst location.
In order to test a given source sample of QSO or AGN (“comparison sample” in what follows) for correlation with GRBs we calculate the number of coincidences. A comparison with the number of correlations obtained for simulated burst positions allows us to estimate the significance of the correlations obtained for the real burst positions. To test for any bias introduced by either the distribution of GRB positions or the non-homogeneous distribution of the comparison sample we will use three different methods. They differ in the way of calculating the number of coincidences and in the way the simulated burst positions are generated and are described in the next paragraphs.
Due to the uneven exposure of the sky the burst distribution is not isotropic. However, since the exposure map is primarily symmetric with respect to the ecliptic (except the south atlantic anomaly), and the quasar distribution is asymmetric with respect to the galactic plane (due to the search techniques), the affect on the coincidence statistics is negligible.
2.2 Randomly simulated GRB samples
We calculate the number of GRBs containing at least one object of a given comparison sample within their 68% confidence interval. To reduce the noise all bursts which have a positional distance to a source in the comparison sample are counted only once.
Until now there are no reports on the presence of any large-scale structure (like e.g. dipole or higher moments) in the GRB distribution. Therefore it appears reasonable to use randomly simulated control samples of GRBs to obtain the number of chance coincidences, and their distribution. However, we should keep in mind that there is no ultimate proof for the assumption that randomly distributed positions reproduce the characteristics of the observed GRB distribution. To estimate the significance of the correlation we simulate 1000 different sets of randomly distributed GRBs and determine the corresponding number of coincidences, . The number of coincidences expected by chance, , is given by the mean over the 1000 values of .
Further, the one thousand values of C represent the distribution for coincidences between the comparison sample and simulated burst sample which (by definition) do not show any correlation (null-hypothesis). This distribution will be used to apply statistics on the coincidences found for the real samples.
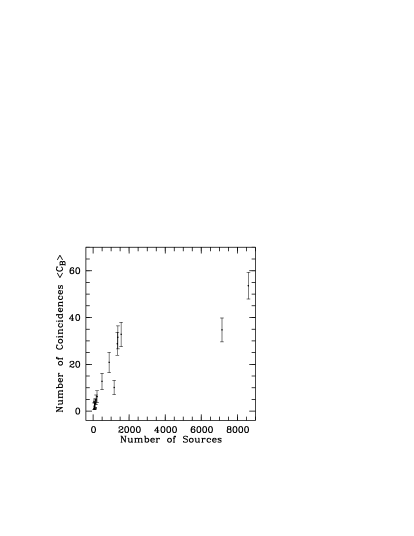
Since every burst is counted only once, the maximum possible number of coincidences is equal to the number of GRBs used. This method is justified since any observed burst can have only one counterpart. With this method of counting only once, the obtained number of coincidences depends both on the number of objects in the comparison sample as well as on their distribution on the sky, in particular their isotropy. In Fig. 1 the value is plotted against the size of the various comparison samples of QSOs/AGNs we studied (see Sect. 3 for details). Clearly, is not a linear function of the size of the comparison sample. A linear correlation holds for most of the samples with less than approximately 2000 members. For larger samples the values obtained are significantly lower than expected from a linear extrapolation of the smaller samples. However, with the 1000 simulations of the GRB positions we establish the distribution of the coincidences for a given sample. This enables us to obtain the corresponding probability for a real correlation of GRBs with the respective comparison sample.
2.3 Shifted GRB sample
The small-scale structure in the GRB locations is more problematic than the large-scale structure. Although no evidence for an autocorrelation in the 3B catalogue has been reported, a possible intrinsic correlation of GRB positions can not be excluded at present, given their large positional uncertainties. Rather than testing the 3B catalogue itself for the presence of small-scale structure, we will test our results using a method intrinsically robust against a possible hidden small-scale structure in the GRB distribution.
We applied the same method as in the previous section to calculate the number of coincidences. However, a different method to construct the simulated random positions was introduced to determine the number of chance coincidences. One thousand control samples were generated by changing the sign of the declination of the measured burst positions and shifting the right ascension 1000 times with a random number in the range between and . The random samples constructed in such a way conserve the small-scale structure of the real GRB distribution and allow to test its influence on the correlations.
2.4 Singular Coincidences
By using the shifted GRB sample we are able to test our results against a possible small-scale structure of the GRB position distribution. Because the QSO/AGN positions provided in the Véron-Cetty & Véron (1996) compilation are not distributed homogeneously over the sky, we need a method which is robust against “clustering” of objects in the comparison samples. This is especially important as most of the “clustering” is due to the accumulation of objects in several deep small-area searches for AGN and QSOs. To this end we counted only bursts with a single QSO or AGN in their 1 error circle. With this method we exclude every burst with two or more QSO/AGN counterparts, i.e. too many to allow a direct comparison with the large error boxes of GRBs. The expected background values and the corresponding expected distribution for an uncorrelated burst sample were obtained again with randomly simulated GRB samples.
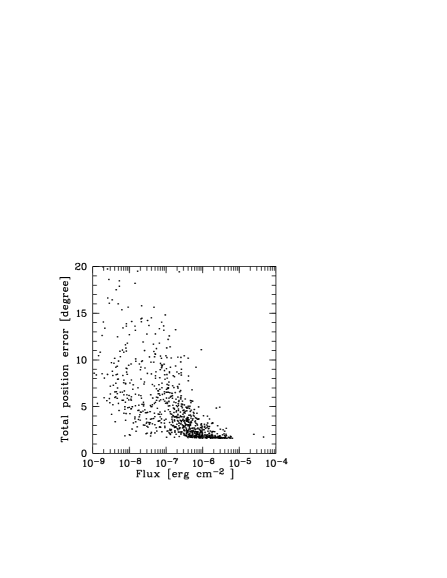
The statistical errors of the GRB positions range from 013 to 3415. Including the systematic error this results in a range from 161 to 3418 for the total error. The mean total error for all bursts is 5241, and the mean area of the error circles is 138 deg2 per burst. Therefore, the sum of all 68% confidence error boxes of 3B bursts corresponds to more than three times the whole sky. In order to avoid too many spurious coincidences, we restricted our study to the bursts with small errors. In Table 1 we list the characteristics of the different GRB samples used here. As mentioned above, both the statistical and total errors depend on the Poisson uncertainty in the BATSE measurements. Therefore, bursts with higher flux generally show smaller positional errors. In Fig. 2 the total error radii for 835 bursts are shown versus the burst flux in the 20–50 keV energy band. Thus, restricting the bursts to those with a smaller error circle also restricts them to a higher flux range. If we search for positional coincidences of GRBs with AGNs and quasars and thus assume that GRBs originate at cosmological distances, then the restricted flux range may correspond to a restricted redshift range.
| Maximal Error | Number | |
|---|---|---|
| total | statistical | of bursts |
| 17 | 0574 | 80 |
| 18 | 0825 | 134 |
| 20 | 1200 | 206 |
2.5 The AGN/Quasar Samples Studied
We used the latest (7th) version of the “Catalogue of Quasars and Active Nuclei” (Véron-Cetty & Véron 1996). This catalogue has been compiled from the available literature and provides the position of 11,662 sources drawn from 1662 references. Due to several deep small-area searches for AGN and QSOs the objects in this compilation are not distributed homogeneously over the sky, but appear “clustered” in these areas. Therefore, any test for a positional correlation between GRBs and quasars or AGN must be robust against observational bias inherent in the analyzed sample.
| Main | Subclass | N(a) | =17 | =18 | =20 | ||||
|---|---|---|---|---|---|---|---|---|---|
| Class | or | (\degr) | |||||||
| selection | |||||||||
| QSO | all | / | / | / | |||||
| QSO | radio-quiet | / | / | / | |||||
| QSO | radio-loud | / | / | / | |||||
| QSO | highly polarized | / | / | / | |||||
| BL | all | / | / | / | |||||
| BL | confirmed | / | / | / | |||||
| BL | highly polarized | / | / | / | |||||
| BL | radio selected | / | / | / | |||||
| BL | X-ray selected | / | / | / | |||||
| AGN | AGN | / | / | / | |||||
| AGN | Seyfert 1 | / | / | / | |||||
| AGN | Seyfert 2 | / | / | / | |||||
| AGN | Prob. Seyfert | / | / | / | |||||
| AGN | LINER | / | / | / | |||||
| AGN | radio-quiet | / | / | / | |||||
| AGN | radio-loud | / | / | / | |||||
| AG(c) | / | / | / | ||||||
| Nucl. H II | / | / | / | ||||||
(a) Number of sources.
(b) Actual mean distance to nearest neighbour of the sample and its
standard deviation. Since the sources in these samples are
distributed rather irregularly, the standard deviation occasionally
exceeds the mean.
(c) Active Galaxies are galaxies with unusually high X-ray or radio
(few) luminosity. These do not overlap with any other subsample
in this table (see text).
The “Catalogue of Quasars and Active Nuclei” (Véron-Cetty & Véron 1996) is divided in three parts,— quasars, BL Lac objects and AGN. In addition to these three subsamples we shall consider certain subsamples, e.g. sources selected by spectral type. Because synchrotron emission is a favoured mechanism to explain GRBs, we used criteria which are thought to favour the presence of jets. The resulting samples are listed in Table 2 together with the sample size and the mean distance to the nearest neighbour. The selection criteria for the subsamples chosen are described in the following.
2.5.1 Quasars
We adopt the definition by Véron-Cetty & Véron (1996) of a quasar as a star-like object or an object with a star-like nucleus, brighter than absolute visual magnitude . In addition to the total quasar sample we consider three subsamples. The first is given by objects characterized by a high optical polarization, %, which is mostly interpreted as evidence for synchrotron radiation connected with a Doppler-boosted nuclear jet (e.g. Wills et al. 1992). The other two classes are defined by their radio-loudness. Although the radio energy band is far away from the gamma-ray band discussed here, these subsamples are justified because of the strong correlation found between the source properties in the radio and X-ray region. Already Einstein data showed a correlation between radio-loudness and both X-ray luminosity and X-ray spectral index (Wilkes & Elvis 1987). This result was confirmed by ROSAT measurements based on larger samples (see e.g. Schartel et al. 1996). In particular, the different spectral properties may indicate that the X-ray spectra are dominated by different physical mechanisms which may result in a different behavior at higher energies. We define the radio-loudness based on the radio-to-optical spectral index (Stocke et al. 1985; Kellermann et al. 1989)
where the spectral fluxes are given in units of Jy and V is the object’s apparent visual magnitude. Note that this definition is independent of optical luminosity.
The radio-to-optical index has been K-corrected assuming a spectral index of in the radio range and in the optical regime. The radio fluxes and the visible magnitudes were taken from Véron-Cetty & Véron (1996). We define radio-loud quasars as those with . A source is defined to be radio-quiet if either or no radio flux is given in the catalogue.
2.5.2 BL Lac objects
The Véron-Cetty & Véron (1996) compilation provides 225 confirmed, probable or possible BL Lac objects. In addition to the total sample and the sample restricted to the optically confirmed BL Lacs we consider three further subsamples. The first one contains all known BL Lac objects which show an optical continuum polarization 3% and the second one (called “radio-selected”) is given by all objects with a flux density 0.1 Jy at either = 6 or 11 cm. Finally, we select all sources not fulfilling one of the above-mentioned criteria. This latter sample is dominated by BL Lac objects which are strong X-ray emitters. For 66 of the 82 objects in this group the mere designation already indicates that they were discovered during X-ray missions.
2.5.3 AGN
The Véron-Cetty & Véron (1996) compilation lists 2833 AGN. By definition of the authors, all of them are fainter than absolute magnitude –23. This sample includes sources with spectra classified as Seyfert 1, Seyfert 2 or LINERs following the definition of Heckman (1980). Further 97 sources are classified as probable or possible Seyfert galaxies.
The list of AGN includes 116 galaxies with a nuclear HII region. These are now interpreted as a burst of star formation, but were called Seyferts in the past and later were reclassified. Therefore, we treat them separate from the Seyferts here. We collect all objects without any morphological type assigned to them by Véron-Cetty and Véron (1996) into a class we term “Active Galaxies” (hereinafter AG). These typically consist of galaxies with nuclear radio or X-ray sources. Note that we use the term “AGN” only for the combined sample of Seyfert galaxies and LINERs. We also divide the AGN into radio-loud and radio-quiet samples, defined by their radio-to-optical index , in the same way as above for the quasars.
3 Search for Coincidences
3.1 Positional Coincidence Analysis
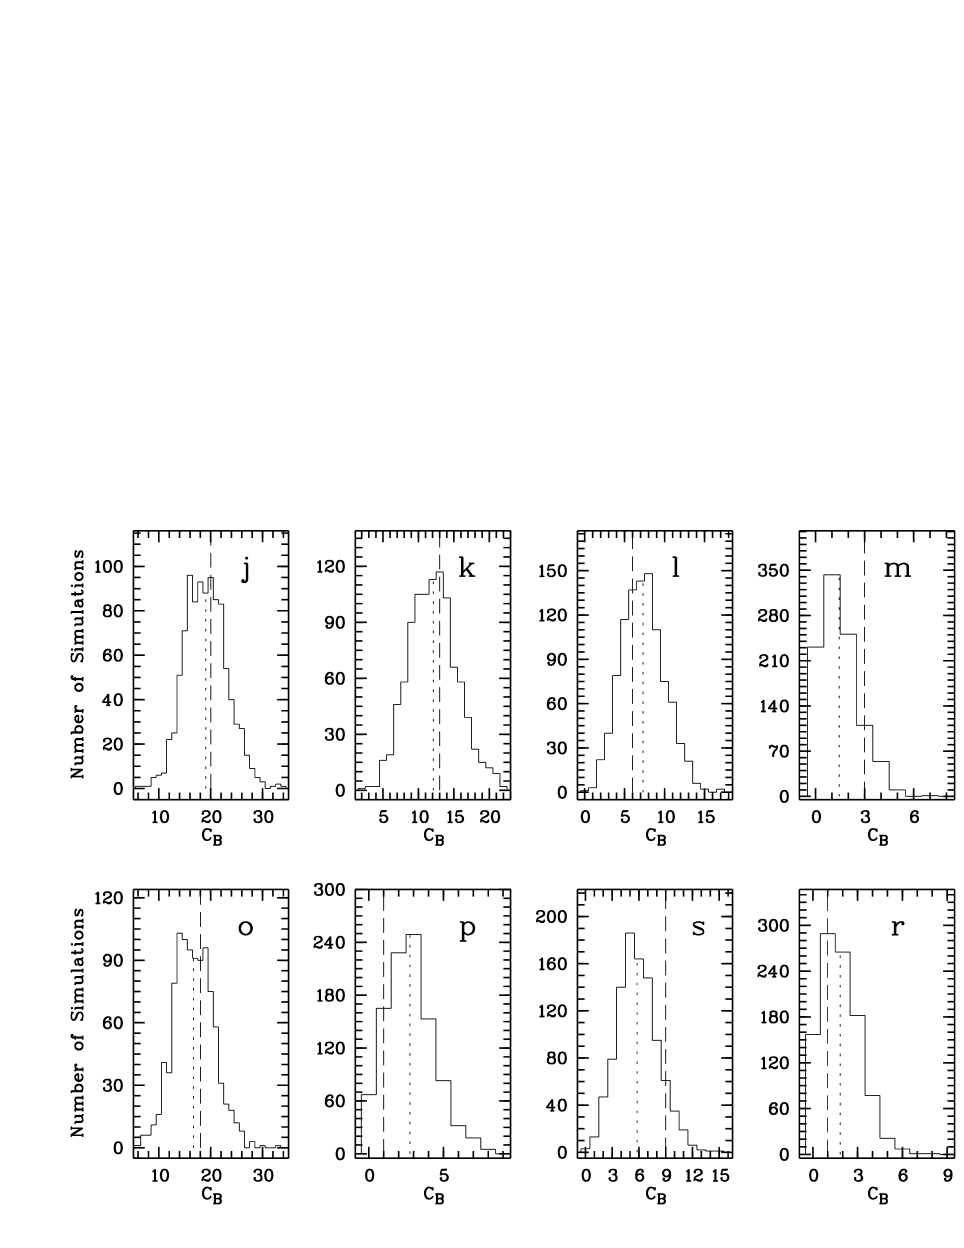
In order to test our results if only for internal consistency, we compare the subsamples of QSOs and AGN defined above with three samples of GRBs containing bursts up to a given positional error radius (see Table 1). The results are listed in Table 2. For every comparison we give the expected chance coincidences derived from 1000 randomly simulated GRB samples. Further we characterize the distribution of by its standard deviation. Since the distribution of coincidences is not Gaussian, we also give the number of coincidences obtained with the real GRB samples, , , and , together with the probability P to measure a lower value than the one obtained. Histograms of the distribution of , i.e. the number of coincidences for the artificial sets of GRBs (null hypothesis), are shown in Fig. 3 for all analyzed subclasses. The expected value of coincidences (or the mean of the distribution), , is shown as dotted line and the obtained value of real coincidences, is indicated by a dashed line.
Three classes, the “active galaxies”, all quasars and the radio-quiet quasars show coincidences in excess of the expected value at the 90%-level or more. Since the radio-loud quasars alone do not show any excess coincidences, we conclude that only radio-quiet quasars may be related to GRBs. All other classes are compatible with the null hypothesis of no relation with GRBs. In particular, the highly-polarized and the radio-loud subsamples show no significant probability of being associated with GRBs.
3.2 Radio-quiet Quasars and Active Galaxies
Only two classes, active galaxies and radio-quiet quasars show coincidences in excess of random expectation above the 95%-level. The sample sizes range from 71 to 7146 members and the mean distance to the nearest neighbour within a given sample varies from 04 to (see Table2). In this section we will test whether any excess correlation may be influenced by the size of the comparison sample and/or the distance to the nearest neighbour. The expected number of chance coincidences was obtained by comparing the positions of the sources with randomly simulated positions of the GRBs (as explained in Sect. 2). Therefore, our results are robust against large-scale structure in the burst locations. A possible influence of any small-scale structure in the burst locations remains to be checked. We will also study the effect of the non-homogeneous distribution of objects in the comparison samples. In summary, we have to check for any hidden, yet unreported characteristics in the sky distribution of GRBs and/or in the sky distribution of AGN and QSOs which may be responsible for the high levels of correlation with GRBs.

| Redshift | Number | Distance to | =17 | =18 | |||
|---|---|---|---|---|---|---|---|
| of | next Source | ||||||
| Range | sources | () | |||||
| Radio-quiet Quasars | |||||||
| 0.00—0.58 | 0.35 | / | / | ||||
| 0.58—1.03 | 0.81 | / | / | ||||
| 1.03—1.41 | 1.24 | / | / | ||||
| 1.41—1.73 | 1.57 | / | / | ||||
| 1.73—2.00 | 1.89 | / | / | ||||
| 2.00—2.21 | 2.11 | / | / | ||||
| 2.21—2.50 | 2.33 | / | / | ||||
| z 2.50 | 2.98 | / | / | ||||
| Active Galaxies | |||||||
| z 0.17 | 0.07 | / | / | ||||
| z 0.17 | 0.40 | / | / | ||||
As mentioned above the position errors of GRBs are a function of the measured -ray flux above 25 keV. A restriction to bursts with the smallest errors leaves us with the brightest bursts and thus more coincidences for nearby GRB sources are expected. Therefore, sample selection by redshift offers an additional possibility to test our result, as we would expect more coincidences for the low-redshift sources. The main advantage of redshift-selected subsamples is given through their intrinsic parameters (for example the mean distance to the next source) which are different from the total sample. Therefore, they allow to test our results against these parameters. Table 3 lists the redshift bins, their mean redshift, the number of sources in each bin, and the mean distance to the nearest neighbour.
3.2.1 Distance to the nearest neighbours
Table 2 shows that comparison samples with the highest correlation with GRBs (with the exception of the total quasar sample) have the smallest mean distance to the nearest neighbour. Active galaxies have a mean distance of 1021 to their nearest neighbour and radio-quiet quasars have only 0409. The subsamples defined by redshift allow to increase significantly the distance to the nearest neighbour, as is obvious from Table 3. In particular, in the lowest redshift sample of radio-quiet quasars a mean distance of 2121 is achieved. Samples with comparable values of nearest neighbour distance, e.g. all AGN (2117), radio-quiet AGN (2218) and radio-loud quasars (2316) do not show coincidences with GRBs in excess of random expectation. We correlated the redshift-selected samples of QSO/AGN with randomly simulated versions (see Sect. 2) of the two GRB samples with 17 and 18. The results are given in Table 3. For the two subsamples of radio-quiet quasars with lowest redshift, probabilities of % are found for a correlation with both GRB samples. Such a positive result is not obtained for the “active galaxies”, which show probabilities as low as 87% for the GRB sample with the smallest error radii.
The subsample for the radio-quiet quasars shows that our result is robust against an increase of the mean distance to the nearest neighbour. On the other hand, the higher-redshift subsamples demonstrate that even samples with a small distance to the nearest neighbour may well yield negative results.
3.2.2 Small-scale structure in the GRB distribution
In order to test the positive result obtained for radio-quiet quasars and to investigate in more detail the results obtained for active galaxies for a possible bias by the small-scale structure of the GRB distribution, we tested our results using shifted GRB samples (cf. Sect. 2.3). This covers two different effects: First, local differences in the BATSE exposure time of certain sky regions causing fluctuations of the local GRB density are smeared out. Second, any possible internal structure of the GRB distribution (e.g. similar to the Great Wall structure of galaxies) is tested.
The results are presented in the usual way in Table 4. They strengthen the results obtained in the previous section. In the first two redshift subsamples ( and ) the radio-quiet quasars reach probability levels of 99% for correlation with GRBs for both burst samples. In contrast, the two subsamples of the active galaxies do not exceed a probability of 94% for correlation with GRBs.
| Redshift | =17 | =18 | ||
|---|---|---|---|---|
| Range | /P(%) | /P(%) | ||
| Radio-quiet Quasars | ||||
| 0.00—0.58 | / | / | ||
| 0.58—1.03 | / | / | ||
| 1.03—1.41 | / | / | ||
| 1.41—1.73 | / | / | ||
| 1.73—2.00 | / | / | ||
| 2.00—2.21 | / | / | ||
| 2.21—2.50 | / | / | ||
| z 2.50 | / | / | ||
| Active Galaxies | ||||
| z 0.17 | / | / | ||
| z 0.17 | / | / | ||
| Redshift | =17 | =18 | ||
|---|---|---|---|---|
| Range | /P(%) | /P(%) | ||
| Radio-quiet Quasars | ||||
| 0.00—0.58 | / | / | ||
| 0.58—1.03 | / | / | ||
| 1.03—1.41 | / | / | ||
| 1.41—1.73 | / | / | ||
| 1.73—2.00 | / | / | ||
| 2.00—2.21 | / | / | ||
| 2.21—2.50 | / | / | ||
| 2.50 | / | / | ||
| Active Galaxies | ||||
| z 0.17 | / | / | ||
| z 0.17 | / | / | ||
3.2.3 Non-Homogeneity of the Comparison Samples
In Sect. 3.2.1 we were able to rule out a bias caused by the mean distance to the nearest neighbours for the radio-quiet quasars whereas our results for the active galaxies were not convincing. We are aware that the non-homogeneity of the comparison sample is not sufficiently characterized by the mean distance to the nearest neighbours. To test for a possible bias of this effect, we count only bursts with only a single QSO or AGN in its 1 error circle (see singular coincidences in Sect. 2.4). The expected chance coincidences and their distribution were obtained again with simulated GRB positions.
Table 5 gives the results and confirms a high probability for correlation with GRBs in excess of random expectation for the two lowest redshift quasar samples, reaching a probability above the 99% level. In contrast to this, we do not find any support for a correlation with GRBs for the “active galaxies”.
4 Results
We first summarize all classes for which no coincidences in excess of random expectation were found. In the second subsection we will strengthen the case for a correlation between GRBs and radio-quiet quasars.
| Main | Subclass | Number | ||||
|---|---|---|---|---|---|---|
| Class | or | of | ||||
| selection | sources | |||||
| QSO | radio-loud | |||||
| QSO | highly polarized | |||||
| BL | all | |||||
| BL | confirmed | |||||
| BL | highly polarized | |||||
| BL | radio-selected | |||||
| BL | X-ray selected | |||||
| AGN | AGN | |||||
| AGN | Seyfert 1 | |||||
| AGN | Seyfert 2 | |||||
| AGN | Probably Seyfert | |||||
| AGN | LINER | |||||
| AGN | radio-quiet | |||||
| AGN | radio-loud | |||||
| Active galaxies (AG) | ||||||
| Nuclear H II region | ||||||
(a): per source in 10-2 yr-1
4.1 Upper Limits
Quasars and AGN are often discussed in the frame of the standard model assuming a massive compact object in the center, most probably a super-massive black hole. Many spectral features, like optical polarization or radio-loudness, are interpreted as evidence of a nuclear jet. Most of the samples and subsamples of QSO and AGN analyzed here show no evidence for a correlation with GRBs. However, the measured values can be used to estimate upper limits for the emission of GRBs. To determine the 3 upper limit we use always our analysis + the 18 burst sample which reaches the highest significance. The 3 upper limit is given by:
where is the number of coincidences with the real GRBs, and is the number of coincidences expected for a simulated burst sample. is approximated by the standard deviation of as provided in Table 2, together with the other two values. The resulting upper limits are listed in Table LABEL:ul. As a quantity independent of the amount of members in the different subclasses we define the emission rate, :
| (2) | |||||
| Magnitude | Number | =17 | =18 | |||||
| of | ||||||||
| Range | sources | |||||||
| –23.0 — –24.1 | 836 | / | / | |||||
| –24.2 — –25.0 | 847 | / | / | |||||
| –25.1 — –25.6 | 784 | / | / | |||||
| –25.7 — –26.1 | 820 | / | / | |||||
| –26.2 — –26.6 | 910 | / | / | |||||
| –26.7 — –27.1 | 875 | / | / | |||||
| –27.2 — –27.9 | 993 | / | / | |||||
| –28.0 — –31.9 | 871 | / | / | |||||
This rate is given by the derived upper limits divided by the size of the comparison sample, and by the observation time of BATSE (3.42 years). Further it is corrected for the 68% confidence interval we used, and the probability of detecting a burst (38%, cf. Meegan et al. 1996). All numbers refer to the 134 GRBs in the 3B catalogue having 18.
Our initial positive result for a correlation of GRBs with “active galaxies” (AG) was not confirmed in the previous chapter. Thus we give an upper limit for AGs in Table LABEL:ul. The positive result obtained initially might be due to the non-homogeneity of the sky distribution of AG. However, an additional bias due to a small-scale structure of the GRB distribution can not be excluded at this point.
4.2 Radio-quiet Quasars
Because of the inverse relation between burst flux and positional error radius we expected to strengthen the result obtained in our first search for correlation for the low-redshift quasars. In Sect. 3.2. we were able to show that the result is influenced neither by the distance to the nearest neighbour, nor the small-scale structure of the burst locations, nor by the non-homogeneity of their sky distribution. In this section we will try to strengthen our positive correlation for radio-quiet quasars.
Seyfert galaxies are closely related to radio-quiet quasars. Because many radio-quiet quasars show a Seyfert-like spectrum, it appears that the main difference between these two classes is the absolute magnitude. Given the negative result obtained for the Seyfert galaxies, it seems reasonable to presume that the absolute magnitude influences the emission rate of GRBs. Therefore, we also defined subsamples according to absolute magnitude as listed in the compilation of Véron-Cetty & Véron (1996). Again, the values obtained were compared with randomly simulated GRB samples and the results are provided in Table 7. The probability levels do not support coincidences in excess of random expectation for the fainter magnitudes () at more than the 95%-level. However, excess coincidences are indeed found for quasars brighter than . It appears that only intrinsically bright quasars show a detectable emission rate of GRBs. This interpretation is in agreement with the negative result found for the Seyfert galaxies.
| Methoda | =17 | =18 | ||
|---|---|---|---|---|
| Radio-quiet Quasars with : | ||||
| Magnitude -24.2 and | ||||
| 1 | / | / | ||
| 2 | / | / | ||
| 3 | / | / | ||
a Numbers denote the different samples: 1 = simulated control sample; 2 = shifted control sample; 3 = singular coincidences
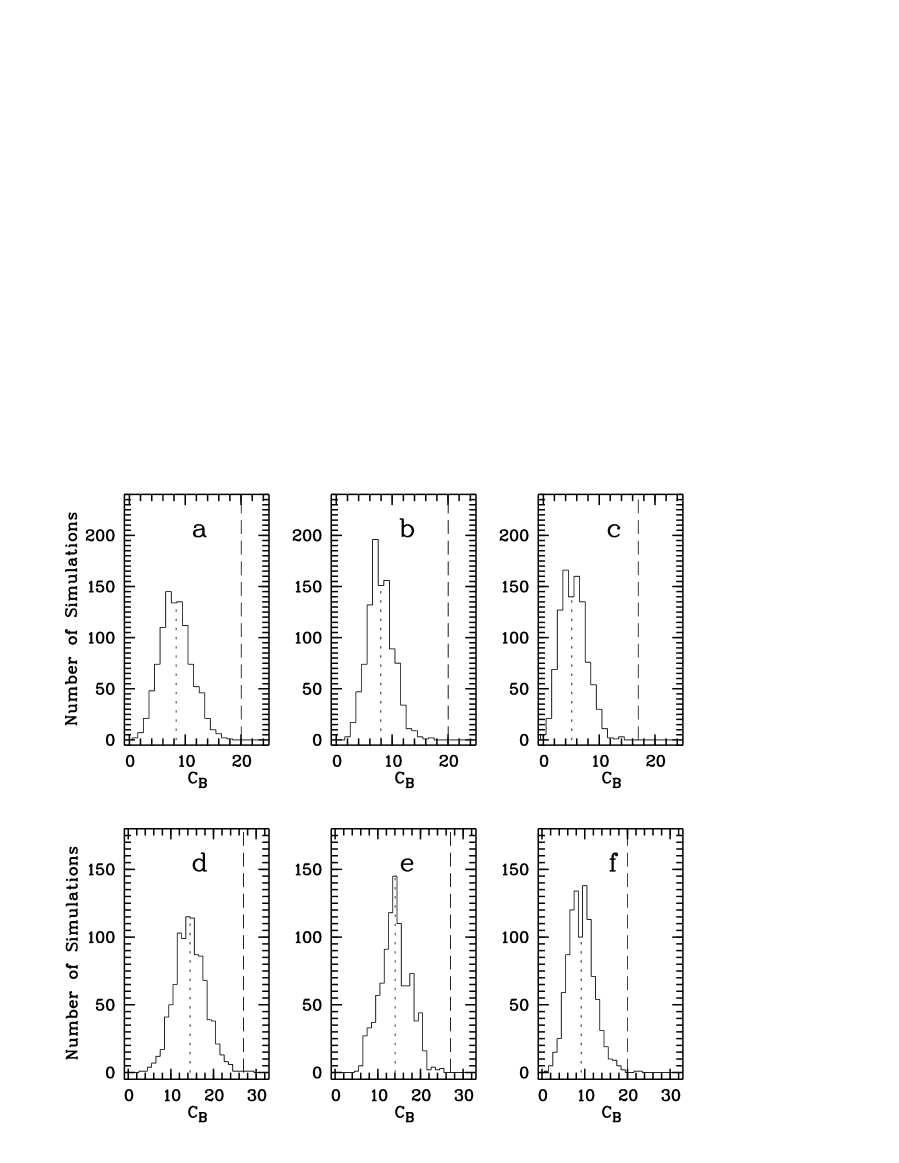
We conclude that there is an increased probability for the nearby and for the absolutely brighter radio-quiet quasars to correlate with GRBs. It is therefore tempting to construct an “optimized quasar sample” with even higher probability for emitting GRBs. We defined such a sample by and . It contains 967 radio-quiet quasars and was tested with the three methods described in Sect. 2, for the two GRBs samples with the smaller error radii. Results are provided in Table 8. The corresponding distribution of the positional coincidences for the null-hypothesis of the “optimized quasar sample” are plotted in Fig. 4. The value expected at random is shown as a dotted line and the value obtained for the real GRBs is indicated by a dashed line. For all six comparisons the probability for a real correlation with GRBs exceeds 99.7%. Moreover, in four of the six comparisons the 1000 simulations of GRBs positions did not show a single case with a number of coincidences as high as for the real GRBs.
Frequently, two catalogues of objects detected in different wavebands are cross-identified from a study of the radial histogram of the distances between suspected counterparts. We did not use this method until this point because many bursts have more than one QSO or AGN in their error circle, which would significantly increase the chance coincidences at large distances between GRBs and objects of the comparison sample. However, the “optimized quasar sample” ( and ) allows to illustrate our result with the radial histogram of the distances between suspected counterparts. The differential distribution of coincidences is given by the number of quasars, in an annulus between a radius and . The distribution of the real coincidences is a function of the positional errors which is not very well determined. However, the real coincidences must be located within a distance less than 3 times the positional error radius, , assuming a two-dimensional Gaussian distribution. The number of randomly expected coincidences is proportional to the cumulative area of all annuli. Thus, the number of sources in a given annulus as a function of the radius is given by
where A(r) is the probability for real coincidences per unit area, and B is the probability for chance coincidences per unit area. We divide by and set
Thus, we may rewrite:
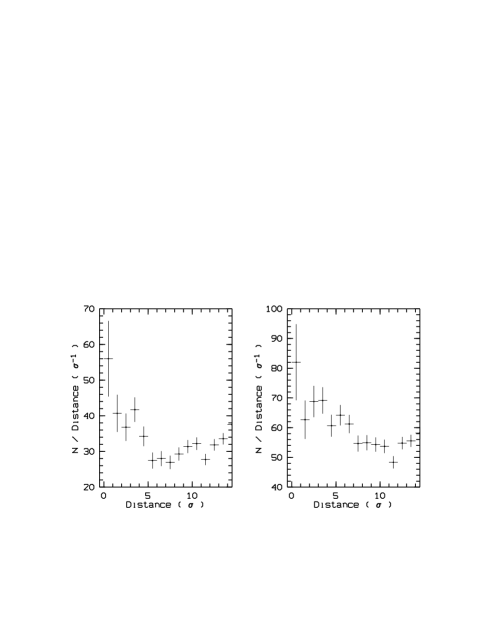
To allow for the very different sizes of the GRB positional errors we scale the distance between GRB and radio-quiet quasars in units of the positional error , i.e. we choose to obtain the normalized differential distribution, which should be constant for . In Fig. 5 the normalized differential distribution for the optimized quasar sample is given. In the normalized differential distribution every coincidence between a gamma-ray burst and a quasar is counted. This results in a doubling of the background value for the first bin as opposed to counting every GRB only once. Nevertheless, the coincidences we find in excess of random expectation between 2 and 5 more than compensate for the poor statistical significance of the first bin (cf. Fig. 5).
By substituting with () in equation 2 we obtain the emission rate for the detected radio-quiet quasars:
Using the results obtained for the ”optimized quasar sample” given in the first line of table 8 we determine an emission rate of burst of 0.01460.004 y-1 per radio-quiet quasar.
5 Discussion
5.1 Correlation with radio-quiet quasars
We have found evidence that intrinsically bright radio-quiet quasars with coincide with GRBs from the 3B catalogue at a confidence level of more than 99%.
The correlation with low-redshift objects is not surprising. For statistical reasons our study had to be restricted to GRBs with the smallest positional errors, which tend to be the brightest GRBs. These GRBs are preferably nearby since the luminosity distribution of GRBs cannot be very flat (Hakkila et al. 1995), and thus one introduces a strong selection effect for low-redshift quasars. Based on the different methods which we applied to test our results, we are confident to have excluded any bias from an inhomogeneous sky distribution of quasars. In addition, we showed our result to be robust against a possible small-scale structure in the sky distribution of -ray bursts.
The restriction to intrinsically bright quasars with seems to be a real physical selection indicating that the GRB emission rate is at least lower for intrinsically faint quasars. This interpretation is supported by the negative result obtained for the Seyfert galaxies which are intrinsically fainter than radio-quiet quasars but otherwise have very similar properties.
We cannot exclude that other classes of AGN and QSOs emit bursts with a comparable rate since the derived 3 upper limits (see Table LABEL:ul) are above the emission rate of the radio-quiet quasars (0.0146 y-1 per quasar). The lower emission rate of radio-loud quasars argues against a direct connection between radio jets and GRB emission.
5.2 Comparison with previous results
Two previous studies may appear in contradiction with our results. However, a thorough analysis shows that one of these is not comparable with our study, and that the other in fact does not contradict our results.
5.2.1 The Kurt & Komberg (1995) analysis
Kurt & Komberg (1995) compared the two-point angular correlation function of 458 gamma-ray bursts with the two-point angular correlation function of a sample of 413 unresolved extragalactic radio sources (QSO, BL Lac and radio galaxies). They found that the correlation function of GRBs does not differ from a random distribution over all angular scales while the one for the radio sources shows significant autocorrelation on small angular scales at a level of . Kurt & Komberg conclude that GRBs do not belong to a normal population of galaxies with . This may not be correct in this generalization, particularly since these authors dealt with compact radio sources and did not consider radio-quiet objects. Moreover, Drinkwater & Schmidt (1996) have recently pointed out the very different clustering properties of radio galaxies and radio-loud quasars, both of which are well-mixed in Kurt & Komberg’s sample. Because we found only coincidences in excess of random expectation for radio-quiet quasars, our result is not in contradiction to that of Kurt & Komberg (1995). Furthermore, we found no hint for a correlation between radio-loud objects and GRBs which agrees with their conclusion.
5.2.2 The Webber et al. (1995) correlation
Webber et al. (1995) compared 60 GRBs located to within very small error boxes of 0.25 deg2 or less with several catalogues of extragalactic objects. More than half of their sample of GRBs was taken from the first Interplanetary Network (IPN) GRB Catalog (Atteia et al. 1987), seven GRBs from the COMPTEL catalogue of bursts (Hanlon et al. 1994) and 16 bursts from the third IPN (Hurley, private comm.). They find that any correlation between these catalogued extragalactic objects and the GRBs are consistent with chance expectation. In order to compare the bursts with the extragalactic objects they count the number of the closest bursts falling in bins of width 05 in radial separation independent of the actual shape of the error box. They found two coincidences: QSO 2219420 (z = 1.3) in the error box of GRB 790419 and QSO 0116–288 (; which was discovered in a deep optical follow-up search of the GRB error box by Pedersen et al. 1983) in the error box of GRB 781119 (obviously mis-printed as GRB 791119 in Webber et al. 1995). Webber et al. (1995) simulated 100 sets of quasar positions and obtained a background value of . Motivated by the large increase of known quasars since the 1989 compilation of AGN and QSOs by Véron-Cetty & Véron as used by Webber et al. (1995), we reanalyzed Webber’s sample of GRBs with the 1995 compilation of radio-quiet QSO. Because the error boxes of the seven bursts localized by COMPTEL have areas well within 0.25 deg2, which is larger than most of the error boxes of the IPN GRB Catalog, we excluded the former here. For the 28 bursts from the first IPN GRB Catalog (Atteia et al. 1987), we compared the positions of radio-quiet QSO with the exact (elongated) shape of the error boxes and arrived at the same result as Webber et al. (1995): one quasar each is located in the error boxes of GRB 790419 and GRB 781119. Then we determined the expected background value with 1000 simulations for the 28 burst positions. Accepting quasars within a bin width of 05 we derive the same result as reported by Webber et al. (1995), namely that a correlation between quasars and the GRBs is consistent with chance expectation. In a second approach, rather than using a standard radial distance of 05 for all bursts, we converted the area of a given error box to a corresponding error circle for each burst. With this approach we expect random coincidences as compared to the above value of . Thus, the probability to find two radio-quiet quasars in the error boxes of the GRBs is only 1.2%. This result corresponds to a probability of 98.8% for a positive correlation, i.e. much higher than derived by Webber et al. (1995) and confirming our results.
5.3 Host questions
Our result of a correlation between GRBs and intrinsically bright, radio-quiet quasars does not necessarily imply that GRBs are produced in the nuclei of these quasars, but possibly in their host galaxies. Thus, there are two different questions related to the hosts of GRB sources: Are host galaxies bright enough to be detectable in previous or future deep searches? What do we know about the host galaxies of radio-quiet quasars?
5.3.1 Deep optical searches and the GRB hosts
Earlier deep optical searches of small GRB error boxes (by imaging in bandpasses from U to K) did not find suitable host galaxies (Schaefer 1992). This has become known as the “no-host” problem for cosmological GRB scenarios (Fenimore et al. 1993a). Recently, near-infrared imaging of six small GRB error boxes (a sample of GRBs different from that used by Schaefer (1992)) in the JHK′ bands has shown that the “no-host” problem does not exist (Larson et al. 1996). On the contrary, even an overabundance of brighter (K 15.5 mag) galaxies was found. Whether these might be hosts for radio-quiet quasars remains to be seen.
As the detectability of quasars is concerned, the lack of excess quasars in GRB error boxes is neither contradicting our results nor surprising. In photometric studies, radio-quiet quasars are not separated from other types of AGN or radio-loud quasars, and thus the existence of any excess of radio-quiet quasars is easily missed. We should note here that a recent deep optical imaging (Vrba et al. 1995) has revealed marginal evidence for a quasar excess at the rate of one per high Galactic latitude GRB error box. Further studies able to distinguish between the different types of AGN are certainly needed to clarify this situation.
In addition, there are two probable kinds of quasars which are difficult to detect in optical, photometric searches. First, there are only a few quasars showing Seyfert 2 type spectra. If the ratio of Sy1/Sy2 type spectrum quasars were equally large as the ratio of Sy1/Sy2 galaxies, then a large number of quasars will have been missed in optical studies. Ultra-luminous infrared galaxies discovered by IRAS (Sanders et al. 1988) might be a second possibility to explain bursts lacking optical counterparts. These are suggested to be young quasars in a dust-enshrouded initial phase.
5.3.2 The hosts of radio-quiet AGN
Until quite recently radio-quiet quasars were thought to be associated mainly with spiral galaxies, and radio-loud ones with elliptical galaxies (see Bahcall et al. 1995 for an overview of references to previous, apparently contradicting results). However, very recent deep images taken with the Hubble Space Telescope suggest that quasars reside in a wide variety of environments, not confirming the above preconception. If radio-quiet quasars are indeed equally likely to be associated with both spirals and ellipticals, then their clustering properties are difficult to predict. Together with the reasonable assumption that GRBs are an extremely rare phenomenon in the life of a galaxy, the lack of autocorrelation among GRBs seems more natural.
On the other hand, the production of GRBs must be related to some specific property of the quasar, otherwise one would expect also a correlation of GRBs with normal spirals, which is not observed. In the next section it is shown that the detected number of GRB and the total number of quasars is in agreement with the emission rate determined in section 4.2. Because the number of spirals exceeds the number of quasars by a factor of order , our result argues strongly against a relation between GRB and normal spirals.
5.4 Luminosity function of quasars
In a Friedmann universe with zero cosmological constant the luminosity distance dl is defined as
whith the Hubble constant, the deceleration parameter and the velocity of light. The comoving volume can be approximated by:
For this correspond to:
assuming Mpc-1 km s-1. From Figure 2 in Hewett et al. (1993) the cumulative space density of quasars for the optimized quasar sample can be estimated. Assuming we get for the redshift range and for the redshift range , respectively. To derive the total number of quasars we further assumed that holds for redshifts below and that 15% of the quasars are radio-loud. Under these assumptions we can estimate that in total 2.9 104 quasars meet the criteria of the optimized quasar sample. The number of quasars studied, 967, therefore corresponds to 3.4% of the total sample. This number has to be compared with the percentage of GRBs cross-identified with a radio-quiet QSO. According to Table 8 we found counterparts to 12.5 GRBs for a total sample of 134 bursts studied, or a detection rate of 9.3%2.8%. Thus, the expected detection rate is within two sigma of the observed one, a reasonable agreement given the small number statistics.
One should also be aware that there are two biasing effects which increase the rate of optical counterparts. The first is that more luminous quasars at a similar redshift show a higher probability to be detected in most kinds of surveys. Our finding that more luminous quasars have a higher probability of being a GRB counterpart suggest that the basic quasar sample used is already biased towards a higher rate of counterparts. A further bias towards a higher rate of counterparts is caused by the clustering of radio-quiet quasars (Shanks & Boyle 1994). Because the clustering occurs on small scales it does not affect our results given the large error boxes of the GRBs. On the other hand, unknown quasars show a higher probability to be located near to a known quasar in comparison to an arbitrary location on the sky.
5.5 Models for GRBs from quasars
Merging neutron stars and black holes are one possibility to explain quasars as counterparts of GRBs and are discussed in the first of the following subsections. There are not many publications explaining GRB with emission by the active nucleus itself. Because our result strongly suggests such a mechanism we show in a second subsection that the gamma-ray emission of radio-quiet quasars/AGN can reach the energy range of GRBs. Finally, we discuss the model of Leiter (1980) which may explain the observed correlation.
5.5.1 Merging neutron stars and black holes
An interesting scenario to explain GRB from AGN and quasars was proposed by Epstein et al. (1993). Because compact-star binaries have a higher mass than normal stars they settle to the center of the nuclear stellar cluster (fraction of a parsec) before they coalesce. The binary merging will typically occur in a time span of a second and will accelerate debris to very high velocities reaching almost the speed of light. The quiescent emission of the quasar nucleus is then up-scattered to the range of gamma-rays by this accelerated hot material (debris), i.e. the spectrum is shifted by in photon energy and the flux is boosted by . The GRB spectra and their light curves are therefore explained by the relative orientation between the observer, the beam direction of the emission of the active nucleus, and the path of the accelerated material. This scenario predicts that the spectra and variability of the GRBs would be correlated with that of the host AGN.
5.5.2 Steady gamma-ray emission from quasars
Already the HEAO-1 observations (Rothschild et al. 1983) revealed AGN to show emission up to the 100 keV energy range (mainly from Seyfert 1s). Emission up to 100 MeV was detected from radio-loud quasars and BL Lac objects, for which synchrotron emission is the favoured mechanism. However, no emission above 500 keV was detected from radio-quiet AGN or QSOs with the three CGRO instruments BATSE, COMPTEL and OSSE (Schönfelder 1994). It appears that two different mechanisms are at work in the high-energy band depending on the radio-loudness of the objects. The existence of two mechanisms is supported by the well-established difference between radio-loud and radio-quiet QSOs seen in X-rays (cf e.g. Wilkes & Elvis 1987; Schartel et al. 1996). Our result fits into this phenomenological picture, because we found GRB counterparts only for radio-quiet quasars. On the other hand, the maximum energy of photons from GRBs reaches up to several GeV and thus is significantly higher than the observed steady 500 keV emission from radio-quiet AGN and QSOs. Thus, there is a clear difference in the gamma-ray spectra of GRBs and the steady emission of radio-quiet quasars.
Possibly, the MISO and Ariel 5 observations of NGC 4151 (Perotti et al. 1981), a radio-quiet Seyfert galaxy, may give some clues the understanding of our results. The flux above 500 keV from NGC 4151 was found to be variable by a factor of 3 to 10 on a time scale up to 1 year as measured with Ariel 5 in December 1976, and MISO in May 1977 and September 1979. The observed -ray fluxes are more than an order of magnitude higher than the limits reported from the OSSE/COMPTEL monitoring of NGC 4151 (Schönfelder 1994) or any previous measurement. Therefore, such a possible gamma-ray high state seems to be extremely rare. The variability by a factor of 3 to 10 in the 500 keV range on a time scale of less than one year should be compared with a hard X-ray variability of only up to a factor of two (Perotti et al. 1981).
5.5.3 The model of Leiter (1980)
One model to explain the variability found at the highest measured energies was suggested by Leiter (1980). If a massive (M ) Kerr black hole exists in the nucleus of NGC 4151, then the Penrose Compton-scattering mechanism can lead to the production of -rays with a cutoff at an energy of about 3 MeV. The burst is triggered by sporadic injection of hot plasma caused by turbulence in the inner region of the accretion disk. The resulting -ray burst is emitted within an angle of 40\degr from the equatorial plane of the Kerr black hole. The duration of such an event is given by the size of the target region divided by the speed of light which is located between the event horizon and the ergosphere. In most unified models it is usually assumed that radio-loud quasars contain a rotating black hole matching the criteria of Leiter’s simulations. But for radio-quiet quasars black holes without rotation are generally favoured. However, the accretion of matter through an accretion disk permanently transfers angular momentum to the black hole. The increasing angular momentum causes an increase of the ergosphere. Finally, the ergosphere is larger than the event horizon creating a very small target region for Penrose Compton-scattering. Further investigations have strengthened the possibility to produce GRBs in hot tori around black holes (Jaroszynski 1996).
If we assume that at least a part of the optical luminosity of the quasar is caused by turbulence in the accretion disk, then the positional coincidence we found between GRB and intrinsically bright quasars can be explained with a higher injection rate of hot plasma and a higher transfer of angular momentum according to Leiter’s model. Since particularly the X-ray emission of quasars is interpreted as a measure of the activity of the inner part of the accretion disk, a search for positional coincidences between X-ray bright, radio-quiet quasars and GRBs would be most promising. It is interesting that the model proposed by Leiter already predicts a focusing orthogonal to the angular momentum of the black hole. This may explain our negative result obtained for radio-loud quasars and BL Lac objects if we assume that the radio-jet is emitted along the rotation axis.
6 Concluding remarks
The aim of our study was to develop a method to handle the large error boxes of GRBs and to study the positional coincidences with QSOs and AGN. We found the surprising result that the nearest and intrinsically brightest radio-quiet quasars have a probability of 99.7% of being associated to the 134 best localized (and thus in general brightest and nearest) GRBs of the 3B catalogue. While previous claims of correlations have usually been found spurious in light of improved (and larger) data samples, it is not the fact of the mere correlation which is surprising, but rather the high probability we find.
If our results are confirmed in future studies with improved statistics then bright quasars emit -ray bursts at an emission rate of bursts per year and quasar for the BATSE sensitivity limit, based on a comparison of the 134 brightest BATSE bursts with 967 quasars of an “optimized quasar” sample. In order to determine the energy emitted during a burst we consider only the 20 GRBs with a single quasar in their error box. For 16 of them the fluxes are given in the 3B catalog, thus yielding a mean total emission of erg for the 20–50 keV band, of erg in the 50–100 keV band, and erg in the 100–300 keV range, respectively. An isotropic emission over was assumed and the following parameters were used: H0=50 km s-1 Mpc-1, and assuming power law spectra with .
The deviation of the cumulative peak flux distribution of GRBs from the –3/2 slope should then be used with caution to study the curvature of space-time, because quasars themselves show an intrinsic evolution.
We neither wish to discuss the implications of our results on models, nor to build a theoretical scenario of GRB emission from radio-quiet quasars. However, the brief review of the scenarios proposed by Epstein et al. (1993) and Leiter (1980) shows that there are already theoretical ideas matching our findings, and (in the case of Leiter’s scenario) that phenomena related to neutron stars (or stellar-sized compact objects) are not the only possible explanation for GRBs. Also, the measurements of NGC 4151 provide evidence for emission from radio-quiet AGN and QSO in the energy range required for GRBs. This implies that in the Epstein et al. (1993) scenario the boosting during the GRB is rather moderate. Thus, our finding of a positive correlation of GRBs with radio-quiet AGN combined with some previously suggested scenarios of cosmological GRBs may provide a new avenue towards understanding the GRB puzzle.
Acknowledgements.
We thank W. Wamsteker and D. Reimers for fruitful discussions. We appreciate the comments of two anonymous referees. JG is supported by the Deutsche Agentur für Raumfahrtangelegenheiten (DARA) GmbH under contract No. FKZ 50 OR 9201.References
- [] Atteia J.-L., Barat C. Hurley K., et al., 1987, ApJS 64, 305
- [] Bahcall J.N., Kirhakos S., Schneider D.P., 1995, ApJ 450, 486
- [] Bahcall J.N., Kirhakos S., Saxe D. H., 1996, ApJ (subm.) (see http://www.sns.ias.edu/~jnb)
- [] Briggs M.S., Paciesas W.S., Pendleton G.N., et al., 1996, ApJ 459, 40
- [] Caldwell J.A.R., Ostriker J.P., 1981, ApJ 251, 61
- [] Cortiglioni S., Mandolesi N., Morigi G., et al., 1981, Ap&SS 75, 153
- [] Deng X., Sun X., Deng Z., 1995, Acta Astrophysica Sinica 15, No. 4, 282
- [] Dermer C.D., 1992, Phys. Rev. Lett. 68, 1799
- [] Drinkwater J.M., Schmidt R.W., 1996, PASA 13, 127
- [] Eichler D., Livio M., Piran T., Schramm D., 1989, Nat. 340, 126
- [] Epstein R.I., Fenimore E.E., Leonard P.J.T., Link B., 1993, Ann. NY Acad. Sci. 688, 565
- [] Fenimore E.E., Epstein R.I., Ho C., Klebesadel R.W., et al., 1993a, Nat. 366, 40
- [] Fenimore E.E., Klebesadel R., Laros J., et al., 1993b, in Compton Gamma-Ray Observatory Symposium, eds. M. Friedlander et al. , AIP 280, 744
- [] Fenimore E.E., Blom J.S., 1995, ApJ 453, 25
- [] Gorosabel J., Castro-Tirado A.J., Lund N., Brandt S., Guizy S., Shlyapnikov A., 1995, Proc. 29th ESLAB Symp., eds. K. Bennett and C. Winkler, Ap&SS 231, 297
- [] Greiner J., 1995, Proc. 17th Texas Symp. on Relativistic Astrophysics and Cosmology, Ann. NY Acad. Sci. 759, p. 429
- [] Greiner J., Wenzel W., Hudec R., et al., 1996, 3rd Huntsville workshop 1995, AIP (in press)
- [] Hakkila J., Meegan C.A., Pendleton G.N., et al., 1994, ApJ 422, 659
- [] Hakkila J., Meegan C.A., Pendleton G.N., et al., 1995, ApJ 454, 134
- [] Hanlon L.O., Bennett K., Collmar W., et al., 1994, A&A 285, 161
- [] Hartmann D.H., Greiner J., Briggs M.S., 1995, A&A 303, L65
- [] Hartmann D.H., 1995, in Flares and Flashes, eds. J. Greiner et al. , IAU Coll. 151, Lecture Notes in Physics 454, Springer, p. 367
- [] Hartmann D.H., Briggs M.S., Mannheim K., 1996, 3rd Huntsville workshop 1995, AIP (in press) (astro-ph/9601057)
- [] Heckman T.M., 1980, A&A 87, 152
- [] Hewett P.C., Foltz C.B, Chaffee F.H., 1993, ApJ 406, L43
- [] Howard S., Fishman G.F., Meegan C.A., et al., 1993, AIP Conf. Proc. 280, 1st Compton Symposium, eds M. Friedlander, N. Gehrels, D. Macomb, New York, p. 793
- [] Inzani P., Sironi G., Mandolesi N., Morigi G., 1982, in AIP Conf. Proc. 77, ed. R.E. Lingenfelter et al. , p. 79
- [] Jaroszynski M., 1996, A&A 305, 839
- [] Kellermann K.I., Sramek R., Schmidt M., Schaffer D.B., Green R., 1989, AJ 98, 1195
- [] Klebesadel R.W., Strong I.B., Olson R.A., 1973, ApJ 182, L85
- [] Kolatt T., Piran T., 1996 (in press) (astroph/9605025)
- [] Kurt V.G., Komberg B.V., 1995, Astron. Astroph. Trans. 8, 89
- [] Larson S.B., McLean I.S., Becklin E.E., 1996, ApJ 460, L95
- [] Leiter D., 1980, A&A 89, 370
- [] Li H., Dermer C.D., 1992, Nat 359, 514
- [] Marani G.F., Nemiroff R.J., Norris J.P., Bonnell J.T., 1996, ApJ (subm.) (astroph/9607158)
- [] Meegan C.A., Pendleton G.N., Briggs M.S., et al., 1996, ApJ Suppl. 106, 65
- [] Nemiroff R.J., Marani G.F., Cebral J.R., 1994, in Gamma-Ray Bursts, eds. G.J. Fishman, J.J. Brainerd, K. Hurley, AIP Proc. 307, 137
- [] Paczyński B., 1986, ApJ 308, L43
- [] Paczyński B., 1991, Acta Astron. 41, 257
- [] Peacock J. A., Nicholson D., 1991, MNRAS 253, 307
- [] Pedersen H., Motch C., Tarenghi M., et al., 1983, ApJ 270, L43
- [] Pendleton G.N., et al. 1996, 3rd Huntsville workshop 1995, AIP (in press)
- [] Perotti F., Ventura D.A., Villa G, et al., 1981, ApJ 247, L63
- [] Piran T., 1992, ApJ 389, L45
- [] Podsiadlowski P., Rees M.J., Ruderman M., 1995, MNRAS 273, 755
- [] Prilutski O.F., Usov V.V., 1975, Ap&SS 34, 395
- [] Quashnock J.M., 1996, ApJ 461, L69
- [] Rothschild M.E., Mushotzky R.F., Baity W.A., et al., 1983, ApJ 269, 423
- [] Rutledge R.E., Hui L., Lewin W.H.G., 1995, MNRAS 276, 753
- [] Sanders D.B., Soifer T.B., Elias J.H., et al., 1988, ApJ 325, 74
- [] Schaefer B.E., 1992, in Gamma-Ray Bursts: Observations, Analyses and Theories, eds. C. Ho, R.I. Epstein, E.E. Fenimore, Cambridge Univ. Press, p. 107
- [] Schartel N., Walter R., Fink H.H., Trümper J., 1996, A&A 307, 33
- [] Schönfelder V., 1994, ApJS 92, 593
- [] Schmidt M., Higdon J.C., Hueter G., 1988, ApJ 410, L85
- [] Shanks T., Boyle B.J., 1994, MNRAS 271, 753
- [] Stocke J., Liebert J., Schmidt G., et al., 1985, ApJ 298, 619
- [] Véron-Cetty M.-P., Véron P., 1996, A catalogue of quasars and active nuclei (7th Edition), ESO Scientific Report, (in press) (CDS catalogue # 7188)
- [] Vrba F.J., Hartmann D.H., Jennings M.C., 1995, ApJ 446, 115
- [] Webber W.R., Harrison T.E., McNamara B.J., Lopez A., 1995, AJ 110, 733
- [] Wilkes B.J., Elvis M., 1987, ApJ 323, 243
- [] Wills B.J., Wills D., Breger M., et al., 1992, ApJ 398, 454