Atomic hydrogen in the spiral galaxy NGC 3631
Abstract
New high resolution, high sensitivity WSRT H i synthesis observations of the spiral galaxy NGC 3631 are presented. In the total atomic hydrogen map, the spiral arms are well distinguished from the interarm regions, while the sensitivity allows detection of H i in all but a few isolated regions of the areas between the spiral arms. Most of the atomic hydrogen is located within the optical disc, but the H i extends to some . The H i follows the spiral arms, and streaming motions of up to km s-1 (projected) can be identified from the velocity field. Assuming a constant inclination angle of 17∘, a rotation curve is derived which is slightly falling in the outer parts of the disc. Analysis of a residual velocity field, obtained after subtraction of an axisymmetric model based on the rotation curve, confirms the existence of streaming motions near the spiral arms in an otherwise undisturbed disc.
keywords:
galaxies: individual (NGC 3631) — galaxies: kinematics & dynamics — galaxies: ISM — radio lines: galaxies — galaxies: structure1 Introduction
In the study of star formation (SF) processes in discs of spiral galaxies, it seems natural to distinguish explicitly between arm and interarm environments. This is however not usually done, partly because of the problems such an approach entails regarding the spatial resolution of especially radio and molecular observations. But also in the optical regime, where it is easy to isolate spiral arms on images of nearby galaxies, photometric properties are usually studied by means of azimuthally averaged profiles. Knapen & Beckman (1996) and Beckman et al. (1996) used optical images to derive radial profiles and scale lengths for the spiral arm and interarm regions separately for 3 galaxies: M51, M100=NGC 4321 and NGC 3631, and found significant differences between arm and interarm profiles, with larger scale lengths in the arms in all three galaxies considered. For M100, Knapen & Beckman (1996) also included H, H i, radio continuum and CO observations, and concluded that the shape of the radial (whole disc, and arm/interarm) profiles is determined by SF more than by any other factor. Knapen & Beckman noted in particular that the H i is enhanced in the region of the star-forming spiral arms, which they interpret as a result, through photodissociation of part of the molecular gas, rather than as a cause of the SF.
In another line of work, massive star formation efficiencies (MSFE) along the spiral arms are compared directly with values in the adjacent interarm regions (Cepa & Beckman 1990; Knapen et al. 1992, 1996). Such a comparison can only be made using CO, H i, and H data of sufficient spatial resolution to isolate the spiral arms. For M51 and M100, two galaxies where observations of these three tracers could be used, enhancement of the efficiencies along the spiral arms could be directly interpreted as evidence for triggering of the SF in the arms (Knapen et al. 1992, 1996).
In order to study the rôle of atomic hydrogen and the interplay between gas and stars at the scale of spiral arms, H i observations at resolutions equivalent to at most the width of a spiral arm are needed. In a typical galaxy at a distance of Mpc, such as M100, M51, or in fact NGC 3631, this implies the need for a spatial resolution of . Since the H i emission from the interarm is generally a factor 3–5 lower than that from the arms, the need for observing the interarm H i also implies that observations of high sensitivity are needed. The observations described in the present paper were designed precisely to meet these goals: to reliably measure interarm H i emission over the disc of NGC 3631.
Candidate spiral galaxies for a study of the SF processes in their arms and disc should be objects with well-defined spiral arms, usually of late morphological type. They should also be relatively face-on objects, with say , since projection effects and reduced effective spatial resolution make it much more difficult to distinguish spiral arms in more inclined galaxies. This is a class of spiral galaxies not traditionally studied in great detail through H i synthesis observations, since the velocity information that can be deduced for such low-inclination galaxies is necessarily limited. In our H i study of M100 () we had to adopt and fix an inclination angle when calculating a rotation curve (Knapen et al. 1993), and I will have to repeat that procedure in the present study.
We have chosen the grand-design galaxy NGC 3631 for our H i study. We follow the approach followed before for M100, where the H i data (Knapen et al. 1993) were used for detailed studies of efficiencies, SF processes, and for determining the location of the density wave resonances in the disc (Knapen et al. 1996; Knapen & Beckman 1996; Sempere et al. 1995, respectively). In forthcoming papers, we will describe similar work for NGC 3631, using the H i data as presented in this paper.
NGC 3631 was first observed at radio wavelengths by Roberts (1968). Other single-dish H i observations include those by Fisher & Tully (1981), Tifft & Cocke (1988) and Staveley-Smith & Davies (1988). No synthesis observations have been described so far. NGC 3631 is a late-type (Sc), face-on spiral galaxy, looking conspicuously “normal” at optical wavelengths. It is non-barred, has no obvious companions, and shows no other signs of important dynamical perturbations. The distribution of H ii regions in the disc was described by Boeshaar & Hodge (1977), who also studied the spiral arm shape. Recently, we obtained a new high-quality H image of the galaxy, from which we catalogued more than 1300 individual H ii regions (Rozas, Beckman & Knapen 1996).
After discussing the details of the radio and optical observations and data reduction in Sect. 2, the distribution of H i at different resolutions is described in Sect. 3. Sect. 4 is devoted to the kinematics, and includes a derivation of the rotation curve from the velocity field. The main results of the paper are briefly summarized in Sect. 5.
2 Observations and reduction
2.1 Atomic hydrogen
A field centred on NGC 3631 was observed in the atomic hydrogen 21 cm line with the Westerbork Synthesis Radio Telescope (WSRT) during the months of April and May, 1991. The total observing time of 44 hours was made up out of two periods of 12 h, one of 9 h, one of 8 h and one of 3 h. The total bandwidth of the observations was 2.5 MHz, centred at a heliocentric velocity of 1160 km s-1, and divided into 128 evenly spaced channels of 4.13 km s-1 each. The observational parameters are fully detailed in Table 1. The data were reduced using the Newstar programs. Since there were many continuum sources within the field, 20 of them were subtracted from the UV data. The data were then Fourier transformed to a 512512 grid of 40 60 () pixels. The resulting 128-channel datacube was Hanning-smoothed along the velocity coordinate, resulting in a dataset with a velocity resolution of 8.25 km s-1.
| Galaxy | NGC 3631 |
|---|---|
| Telescope | WSRT |
| Date of observation | April/May 1991 |
| Duration of observation | 44 h |
| Number of interferometers | 40 |
| Baselines (min-max-incr) | 36–2700–72 |
| Synthesized beam (FWHM) | 152 112 |
| Pos. angle synth. beam | 127 |
| FWHP primary beam | 37′ |
| Velocity central channel | 1160.0 km s-1 (heliocentric) |
| Bandwidth | 2.5 MHz |
| Number of channels | 128 |
| Channel separation | 4.13 km s-1 |
| Velocity resolution | 8.25 km s-1 |
| Field centre (1950) | ( ; 53∘ 26′ 43′′) |
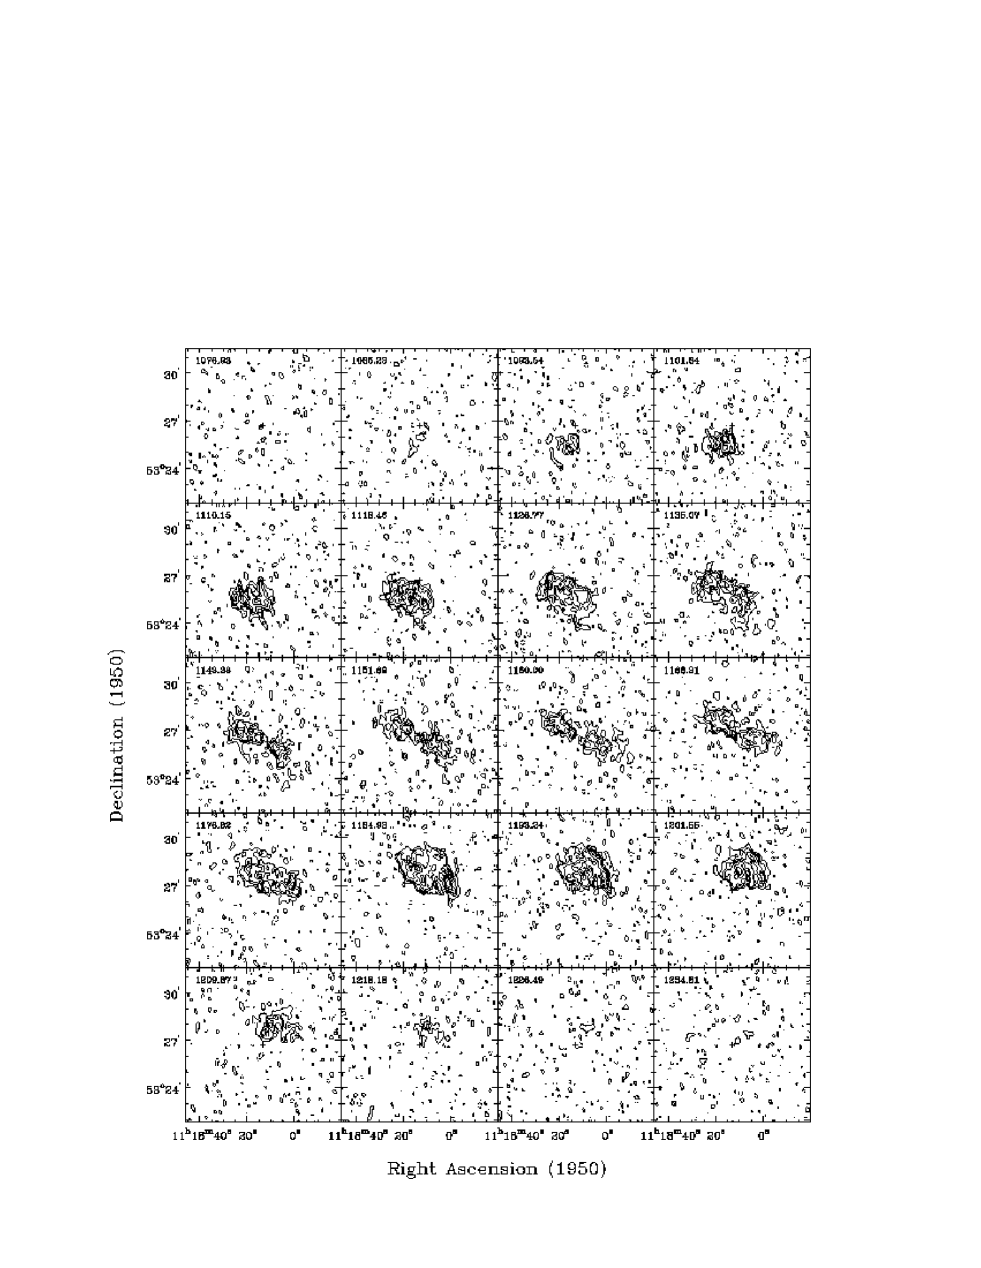
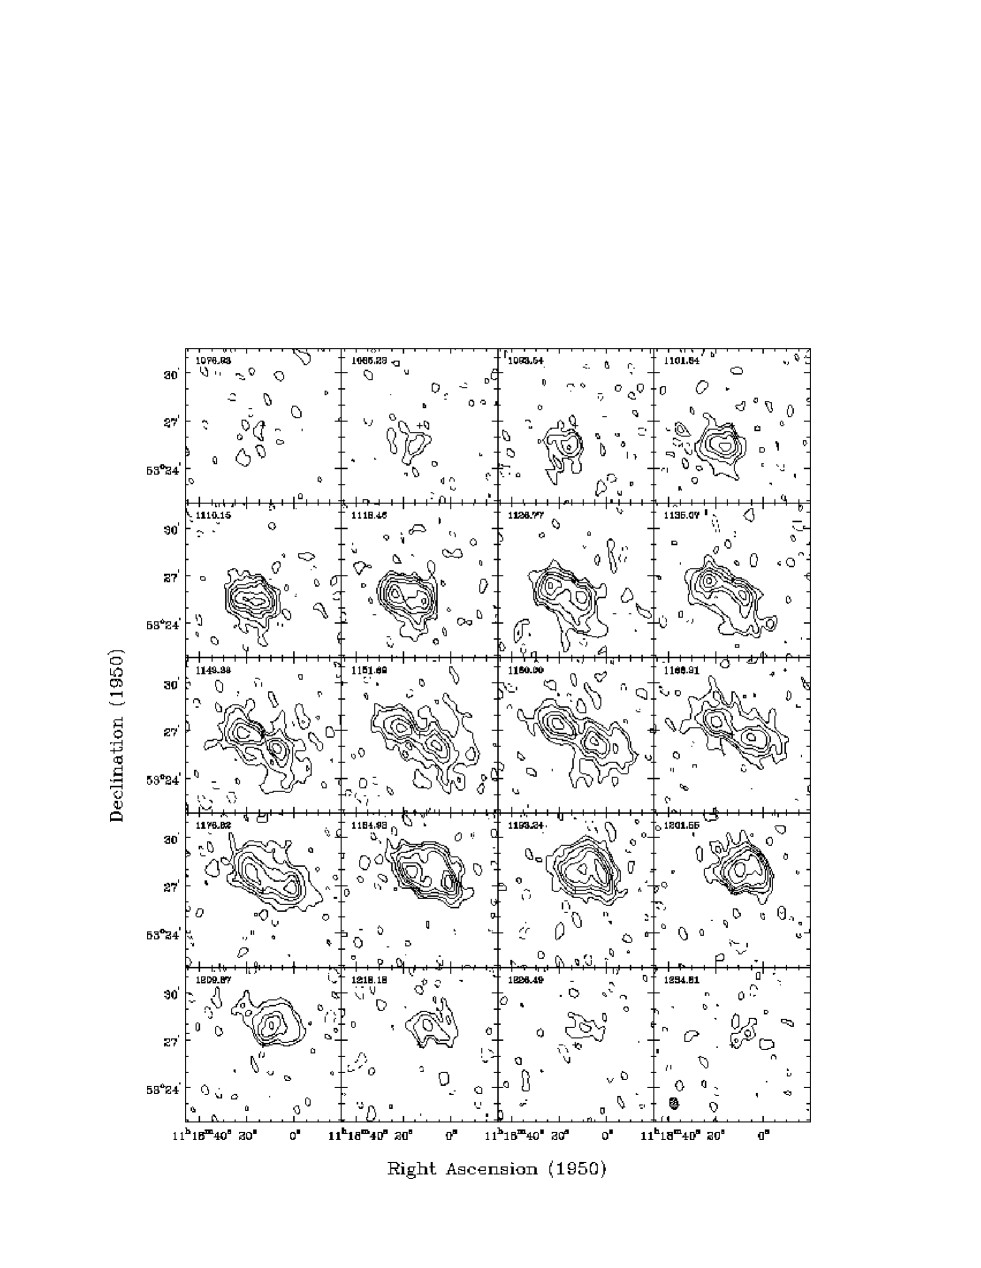
After convolving the datacube to a resolution of some 60′′, 28 channels free of line emission were identified on the low-velocity side, and 23 channels in the high-velocity side. A number of channels with higher noise was discarded on either side. Since we are interested in structure at several scales and sensitivities, the data-cube was convolved from the original resolution of to resolutions of 21′′ 14′′, 30′′ 20′′, 45′′ 30′′ and 60′′ 40′′. The continuum was determined for each of these data sets by fitting a linear relation to the line-free channels, and subtracted from the line emission channels. The resulting five data sets were cleaned. Clean components were subtracted until the noise level, and subsequently the maps were restored by convolving the components with the appropriate Gaussian beam and adding the residuals. Five data cubes were thus produced, consisting of 58 line channels each, at resolutions ranging from (hereafter full resolution) to 60′′ 40′′. The cleaned channel maps at 21′′ 14′′ and 45′′ 30′′ resolution are shown in Figures 1a and 1b, respectively. Note that only every second channel map is shown. Noise properties of these datacubes and conversion factors (equivalent of 1 mJy beam-1) are listed in Table 2.
The data cubes at various resolutions were used to calculate total H i (zero-th moment), velocity (first moment) and velocity dispersion (second moment) maps. A careful inspection of the data cubes showed that such an analysis is in fact valid over almost the complete disc, with the possible exception of the central region (of size approximately one beam), where the H i profiles are not Gaussian-shaped and/or not single-peaked. I now briefly describe the procedure followed for the full resolution data set. The first step was to produce a conditionally transferred data cube, in which values were only retained at positions where the intensity in the smoothed data cube at 30′′ 20′′ was larger than 2.5 times the rms noise of the smoothed maps. Pixel values at all other positions were set to undefined. Then, noise peaks outside the area where H i emission is expected were removed by setting pixel values at those positions to undefined. This was done interactively by inspecting the (high resolution) channel maps one by one, continually comparing with the same channel and referring to adjacent channels in the smoothed cube (at 30′′ 20′′). Finally, the resulting data set was used as input for the GIPSY program moments to calculate the total intensity, velocity and velocity dispersion maps. Only emission occurring at the same position in at least three adjacent channels was considered true signal, and used for the calculation of the moment maps.
The procedure for making the moment maps of the lower-resolution data sets is completely analogous. For the 21′′ 14′′ resolution data set, for instance, the smoothed cube at 45′′ 30′′ was used for reference. A data set of 90′′ 60′′ was used for reference for both the 45′′ 30′′ and 60′′ 40′′ cubes, but in those cases additional restrictions were employed in the moment calculation, where only values of (and ) were used.
| Synthesized Beam | rms Noise in | Conversion factor |
|---|---|---|
| (FWHM) | channel maps | mJy) |
| (mJy beam-1) | ||
| 0.84 | 3.59 | |
| 0.95 | 2.09 | |
| 1.11 | 1.02 | |
| 1.39 | 0.45 | |
| 1.60 | 0.25 |
2.2 Optical imaging
Images in the and broad-bands were obtained in service time with the 1m Jacobus Kapteyn Telescope (JKT) on La Palma, on Dec. 20, 1993. An EEV CCD chip was used of 12421152 pixels of 031 projected size, giving a field of view of around 6 arcmin. The raw images were bias-subtracted and flat-fielded using dawn sky exposures, and photometrically calibrated using standard stars observed during the night. The resolution (seeing) in the reduced images is around 15 . The image as used in the present paper has a pixel scale of 062 . The position of foreground stars in the images was used to place the images on a correct RA-dec grid. Since the present images were too small to contain a sufficient number of bright stars to warrant a good astrometrical solution, they were compared with the H image of Rozas et al. (1996), which has a larger field of view, and for which satisfactory astrometry could be performed using star positions from the HST GSC. The resulting error in the astrometry of the optical images as used here is less than . We show the -band image of NGC 3631 in a gray-scale representation in Fig. 3.
3 Distribution of H i and continuum emission
3.1 Global H i properties

The global H i line profile is shown in Fig. 2. It was produced by adding all the flux in each separate channel map of the 30′′ 20′′resolution data set, within a square region encompassing the extent of the H i emission. The systemic velocity (see Sect. 4) of 1155.7 km s-1 is indicated by an arrow in the figure. The H i flux integral is Jy km s-1, in good agreement with the single-dish values given by Tifft & Cocke (1988) of 54.50 Jy km s-1 (no error indicated), and Staveley-Smith & Davies (1988) of Jy km s-1. Using a distance to NGC 3631 of 15.4 Mpc (derived from assuming km s-1 Mpc-1), the total atomic hydrogen mass can then be evaluated as (H i). Note, however, that this value does depend on the true distance to the galaxy, and also on the assumption that all the atomic hydrogen is optically thin. The new value compares favourably to the value reported by Fisher & Tully (1981) of (H i) (corrected to Mpc), but not to the older value of (H i) (also at Mpc) from Roberts (1968). In general, one can state that the integrated H i flux as derived from the WSRT synthesis observations agrees very well with previous determinations made using single-dish telescopes.
3.2 Total H i distribution
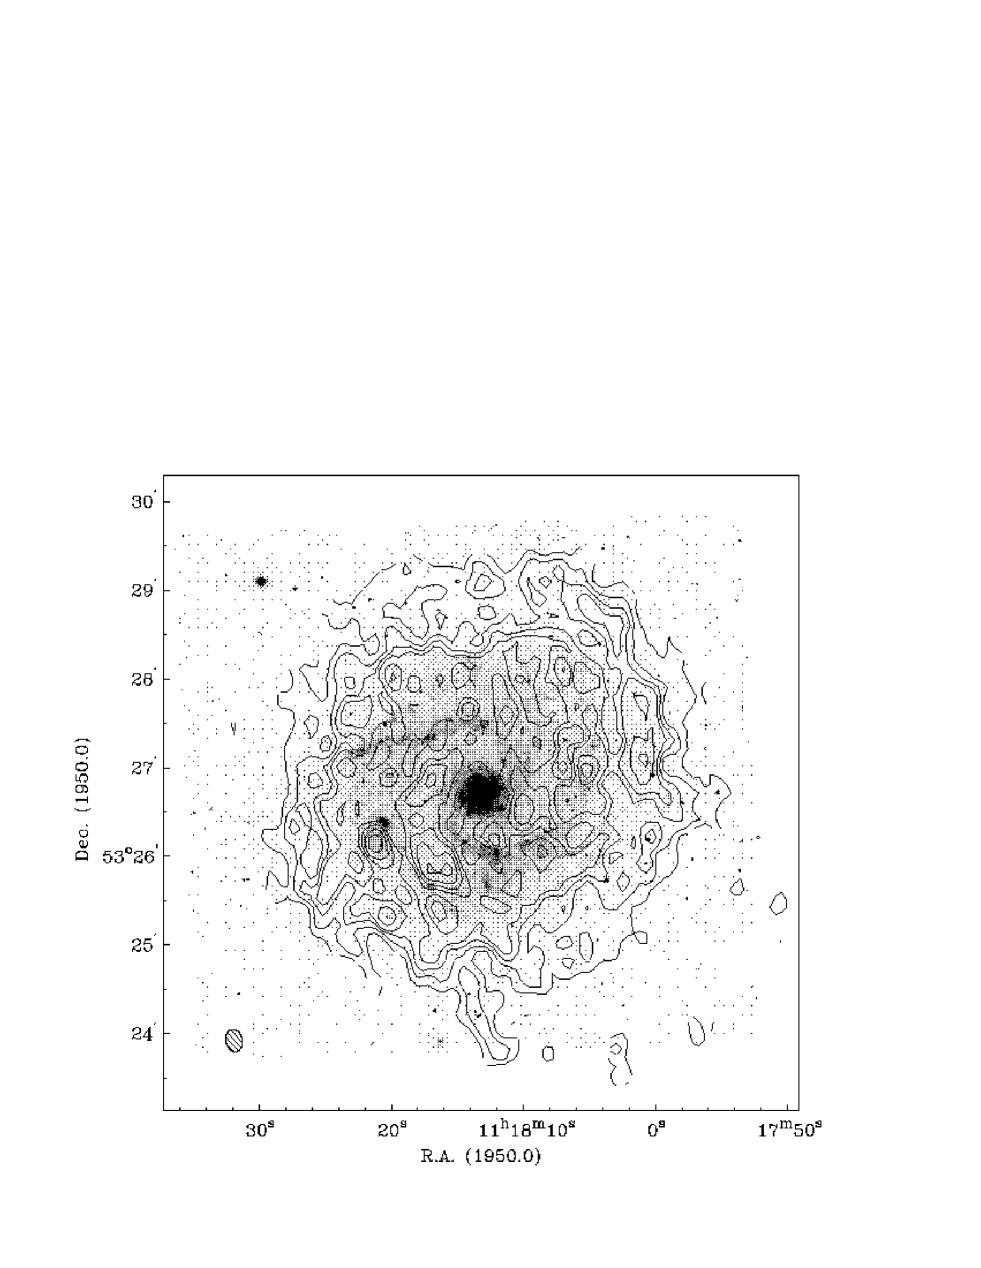
Figure 3 is an overlay of the total H i (zero-th moment), or column density of hydrogen, map of NGC 3631 on the -band CCD image. The H i generally traces the spiral arms, although the correspondence between optical and H i features is not unique. The H i extends further out than the optical disc, especially in the SW region of the H i extension (see below and Fig. 4b), but it does not do so in the dramatic fashion as seen in e.g. M101 (Allen et al. 1974; van der Hulst & Sancisi 1988) or NGC 628 (Kamphuis & Briggs 1992), two galaxies of morphological type comparable to NGC 3631.
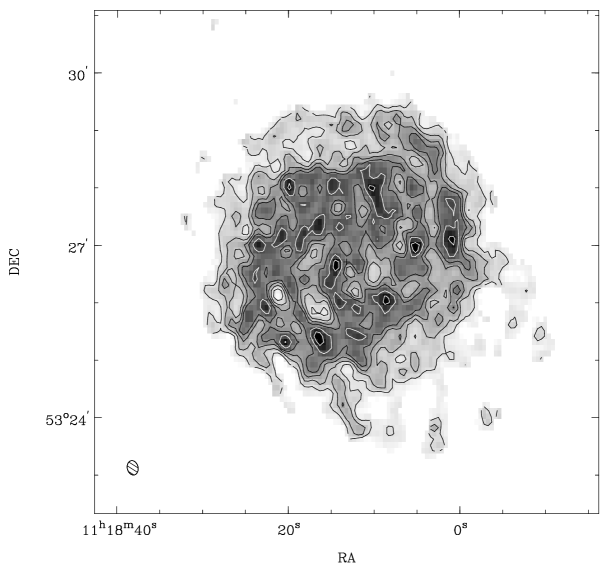
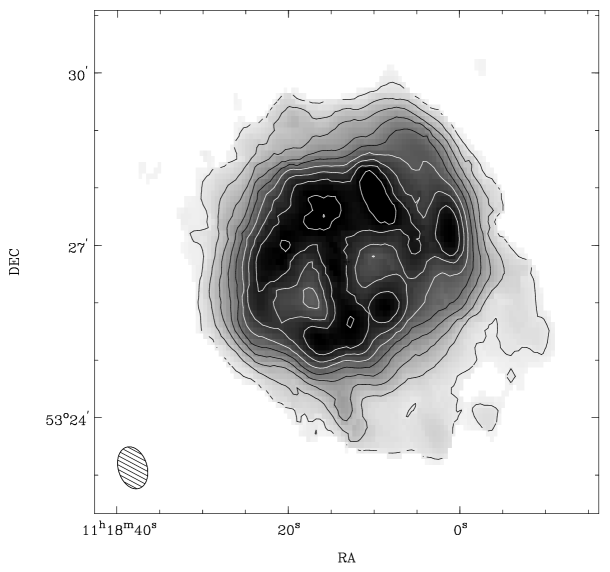
Figures 4a and 4b show the H i column density distribution (zero-th moment maps) in NGC 3631 at resolutions of and 45′′ 30′′, respectively. The higher resolution map (Fig. 4a) shows that the H i is mostly concentrated in the spiral arms, but that H i is detected all over the disc, including the interarm zones and the central region of the galaxy. At 45′′ 30′′resolution (Fig. 4b) the general arm pattern can still be recognized but is mostly lost in the lower resolution. An interesting feature is the extension on the SW side of the disc, at low levels. This is reminiscent of the distribution of H i in M100, but is not accompanied by a kinematic signature, as is the case in M100. Similar H i asymmetries were first recognised by Baldwin, Lynden-Bell and Sancisi (1980), and seem to be a frequent phenomenon.
3.3 Radial H i profile

A radial H i surface density profile was derived from the 30′′ 20′′ total H i map by averaging in elliptical rings with fixed inclination and position angles ( and PA respectively, see Sect. 4), and is shown in Fig. 5. The extent of the optical disc (; from de Vaucouleurs et al. 1991) is indicated in the Figure. The profile shows clearly some features that were already obvious from the overlay of the total H i map on the -band optical image (Fig. 3), namely that the H i disc is not a whole lot more extended than the optical disc, and that most of the H i sits well inside the optical disc. The radial H i profile shows a central depression, not uncommon at all for both barred and non-barred galaxies (see e.g. Broeils & van Woerden 1994). The profile peaks at a radius of just over 1 arcmin, and falls off rapidly after that radius, coinciding with the end of the region of the star forming spiral arms as seen in the optical image. This situation is reminiscent of that in M100, where also the H i is enhanced in the region of the SF spiral arms. Knapen & Beckman (1996) interpret this enhancement in M100 as a result of the SF activity, leading to photodissociation of part of the molecular gas and to the production of H i, rather than as the origin of the SF. Careful comparison with especially molecular gas observations is needed to confirm that a scenario of H i production as a result of SF activity is in fact the preferred one also for NGC 3631.
The radial H i profile extends out to around , but inspection of especially Fig. 4b shows that the H i only extends to this radius in the SW, elsewhere the disc can not be defined for radii larger than . This implies that the surface density beyond 3 arcmin in Fig. 5 is no longer a ring average, as in the inner parts, but is due mostly or even exclusively to the H i in the SW extension. Comparison of the whole radial H i profile of NGC 3631 with those for other Sc galaxies (Broeils & Rhee 1996) shows that the H i disc in NGC 3631 is rather small. For NGC 3631 we find a value for the ratio of H i to diameter of 1.1 (using M⊙ pc-2 for the definition of ). Broeils & Rhee (1996) find that these ratios for the around 15 Sc galaxies in their sample are between 1.1 and 2.5, placing NGC 3631 at the lower extreme. The peak surface density in NGC 3631, of some 7 M⊙ pc-2, and the average surface density of around 4.5 M⊙ pc-2, are quite normal when compared to both the Sc galaxies, and also to the galaxies of other morphological types, from Broeils & Rhee (1996).
3.4 21 cm Continuum
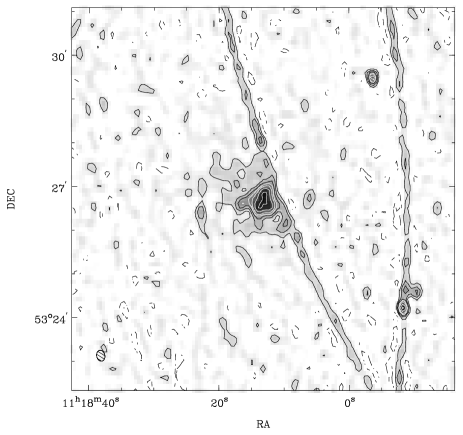
The 21 cm continuum map, at resolution, is shown in Fig. 6. This is the image that was subtracted from the data cube of the same resolution. As described in Sect. 2, a number of continuum sources were deleted from the data set at the stage preceding the making of the channel maps, but still a number of grating rings are present in the final continuum map. This makes interpretation of the features in the map, and especially the determination of fluxes, very difficult. What can be deduced from the map is that the 21 cm continuum emission from NGC 3631 is centrally peaked, and follows the spiral arm shape. No obvious radio continuum point sources are seen in the disc, thus no recent supernova events can be identified.
4 Kinematics
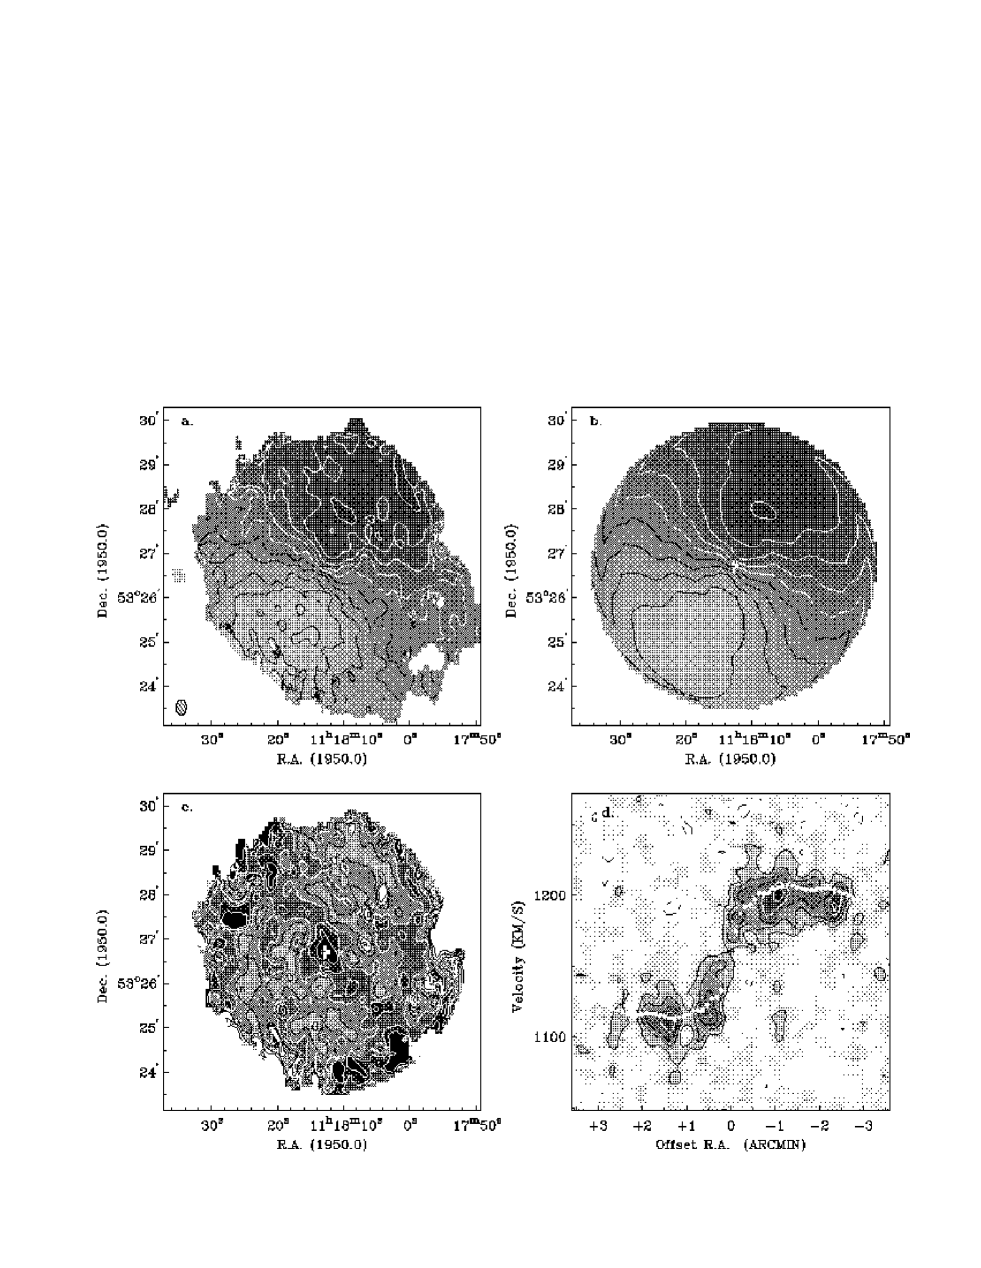
The velocity field (first moment map) of NGC 3631 at 21′′ 14′′ resolution is shown in Fig. 7a in a contour plus grayscale representation. Similar maps were in fact produced at all resolutions; only one is shown in the present paper. The velocity field in Fig. 7a shows a generally regular shape, but a few features are worth pointing out explicitly. The shape of the isovelocity contours indicates that the position angle of the major axis is practically constant over the disc. The closed contours representing more extreme velocity values point out a constant or slightly falling rotation curve in the outer half of the disc, shown to be indeed the case in the next paragraph. At several positions in the disc, notably about 1′ W and E of the nucleus, and showing up most clearly along the minor axis, are deviations from the regular shape of the isovelocity contours that can be recognized as streaming motions due to a density wave near the H i spiral arms (e.g. Rots 1975). From the displacement of the contours one can estimate an amplitude of km s-1 along the line of sight, or km s-1 in the plane of the disc, after deprojection, assuming an inclination angle of 17∘ (RC3, see also next paragraph). Such values are somewhat large, but not outside the range of values found in other galaxies for density wave streaming motions (e.g. Visser [1980] for M81, Rots et al. [1990] for M51, and Knapen et al. [1993] for M100).
4.1 Rotation curve
I derived the rotation curve from the velocity field (first moment maps) at different resolutions, using a procedure described in detail by Begeman (1989). In this procedure, the galaxy is divided into a set of concentric rings, each of which is described by a set of parameters (inclination angle), (position angle of the major axis), and (rotational velocity). Additional parameters are the centre of each ring, and the systemic velocity of the galaxy. These parameters are fitted using a least squares algorithm. Data points within each ring are weighted by , where is the azimuthal angle from the major axis. Data points within 20∘ from the minor axis are excluded from the fits.
NGC 3631 is a galaxy with a low inclination angle (, de Vaucouleurs et al. 1991) which makes it impossible in practice to fit both and . Rather than assuming a constant rotational velocity throughout the disc, a constant inclination angle was used. Using the value of (RC3) results in values for the rotational velocity of km s-1, which agree quite well with the synthetic rotation curve given by Rubin et al. (1985) for a galaxy like NGC 3631. Rubin et al. give a value of km s-1 for an Sc galaxy of mag, the absolute magnitude of NGC 3631 assuming Mpc and the value for from the RC3. The agreement is surprisingly good given the high uncertainty in the determination of an inclination angle of only 17∘. Note that the use of a different value for does not change the shape of the rotation curve, but only scales the values for (larger for smaller ).
Starting out with the 60′′ 40′′ velocity field, I first fitted the position of the dynamical centre as 1′′) by fixing , and at reasonable values. This position was determined from the part of the disc at radii larger than 40′′, where the errors in the fit were acceptable. The dynamical centre coincides with the optical centre of the galaxy (as given in the RC3) in declination, but is offset from it by 0.55 seconds of time, or some 5 arcsec, in right ascension. As a second step, the position of the centre and the inclination angle were fixed, which resulted in a satisfactory fit to the systemic velocity of the galaxy, km s-1. This is in good agreement with the values determined from single-dish H i observations (e.g. km s-1, Staveley-Smith & Davies 1988).
The final rotation curve fit for the whole disc was now made fixing the position of the centre and at the values described above, at 17∘, and fitting and at radial points with 20′′ (similar to half beam) spacing. Fits for the receding and approaching halves of the galaxy were also made.

Rotation curves for the whole disc, and for receding and approaching halfs separately, were then fitted for all other resolutions, using as width of the rings always half the (minor axis) beam size. Following exactly the same procedure as described for the 60′′ 40′′ velocity field, values for the dynamical centre and systemic velocity were first checked, and and subsequently fitted for all the other cubes at lower resolution. The resulting final rotation curve for NGC 3631 is shown in Fig. 8. This Figure is a composite of the fits to the 21′′ 14′′ resolution velocity field (for radii out to 24 ) and to the 60′′ 40′′ velocity field (larger radii). The top panel shows the rotation curve for the whole disc, and approaching and receding sides separately, while the lower panel shows the run of the fitted position angle of the major axis (measured N over E) against radius. It is clear that is essentially constant over most of the disc, at a value of . It reaches significantly larger values (up to ) only around , which is probably caused by the streaming motions prevalent there (see previous section).
The rotation curve rises slowly out to , after which it declines somewhat. This decline does however depend critically on the constancy of the assumed inclination (a chance of only 1 or 2∘ would suffice to cause the observed drop). Over most of the disc the rotation curves for approaching and receding sides of the disc behave very much like the total rotation curve. Apart from the outer points, the only deviations are found in the inner . These may well be caused by the adopted central position, which was determined mostly from the outer regions of the disc, and from data at 60′′ 40′′ resolution. An overlay of the (21′′ 14′′) rotation curve on a position-velocity diagram along the major axis (Fig. 7d) confirms that the derived rotation curve is very reasonable, even though the inclination of the galaxy is low.
4.2 Model velocity field
The fitted runs of and for the 21′′ 14′′ data (whole disc fit; see previous section) were used to construct an axisymmetric model velocity field. All other parameters ( and central position) were kept at the values described above. The resulting model velocity field is shown in Fig. 7b. The counterclockwise deviation of the isovelocity contours near the outer edge of the model is due to a pair of high values of , which may be artifacts. The model looks generally smooth, although it is clear that the streaming motions discussed before show up to a certain degree. The model was subtracted from the velocity field to produce a residual velocity map, which is shown in Fig. 7c. Values for the residual velocity of km s-1 occur exclusively in the outer 40′′ of the map. Near the centre, where large velocity gradients occur, residual velocities are positive, around km s-1. In the disc, the residual velocity field shows a continuous region of negative values (dark in Fig. 7c), aligned more or less along the direction of the minor axis. This feature may well result from the fact that data points within 20∘ from the minor axis were excluded from the fit leading to the rotation curve. The residual velocity map also shows the spiral arms, in the form of positive residual velocities where streaming motions can be identified in the velocity field (Fig. 7a). This is most obvious in the form of the curved feature in Fig. 7c starting N of the nucleus, curving to the left (E) and then down (S), although other features in the map can also be identified to lie near or on the spiral arms (compare Fig. 3). The absence of a symmetric pattern surrounding the centre confirms that this galaxy does not have a dynamically important non-axisymmetric component (such as a bar).
5 Summary
| Parameter | Value | Notes |
| Morphological type | SA(s)c | 1 |
| Optical centre (1950) | , 53∘ 26′ 43′′ | 1 |
| Dynamical centre (1950) | (007), 53∘ 26′ 430 (1′′) | 2 |
| Systemic velocity (heliocentric) | 1155.70.8 km s-1 | 2 |
| Distance | 15.4 Mpc | 3 |
| 1 | ||
| Optical size () | 25 | 1 |
| H i radius | 40 02 | 2 |
| Inclination | 17∘ | 1, 4 |
| Position angle of major axis | 150∘ | 2 |
| H i flux integral | 51.6 Jy km s-1 | 2 |
| Total atomic hydrogen mass | 2 |
note 1: RC3 (de Vaucouleurs et al. 1991)
note 2: This paper
note 3: From the systemic velocity, assuming km s-1 Mpc-1
note 4: Adopted (see Sect. 4)
In this paper, I describe new WSRT H i aperture synthesis observations of the grand-design late-type spiral galaxy NGC 3631. The highest spatial resolution of the produced data set is of , which allows resolving the spiral arms from the interarm disc, but data cubes at several lower resolutions were also produced, with the lowest resolution described here being . These H i data will be used in subsequent work for detailed studies of SF processes in and outside the spiral arms, and of the spiral structure. The main parameters for NGC 3631, as taken from the literature or determined in the present paper, are listed in Table 3, and the main results can be summarized as follows:
-
1.
H i is detected all over the disc of the galaxy, with good detections, even at the highest resolution, in the interarm regions and in the centre. The H i generally follows the spiral arm pattern as seen in optical images.
-
2.
The H i extends to about , but most of the H i is found well within the optical disc. The radial H i profile peaks just outside , in the region of the star-forming spiral arms. The profile shows a slight central depression.
-
3.
Streaming motions due to density waves can be identified near the locations of the spiral arms in the high-resolution velocity field. They have maximum amplitudes of km s-1, or km s-1when assuming an inclination angle of 17∘. No significant other deviations from axisymmetry are seen in the velocity field.
-
4.
A rotation curve as derived from the velocity field rises slowly to its maximum at , after which it declines somewhat. The exact values of the rotational velocity could not be determined due to the ambiguity between the angle of inclination and , but assuming we find that km s-1, in general agreement with synthetic rotation curves for a galaxy like NGC 3631 (Rubin et al. 1985). The position angle of the major axis is practically constant over the disc.
-
5.
After subtracting a model velocity field, obtained from the rotation curve, from the original velocity field, the residual map confirms the existence of streaming motions in the H i, and the absence of significant other disturbances in the disc.
Acknowledgments
The keen eye of the referee, Prof. H. van Woerden, helped improve the manuscript. I thank Drs. K. Begeman, A.H. Broeils, R.P. Olling and D. Sijbring for help with aspects of the data reduction. The Westerbork Synthesis Radio Telescope is operated by the Netherlands Foundation for Research in Astronomy with financial support from the Netherlands Organization for Scientific Research (NWO). The Jacobus Kapteyn Telescope is operated on the island of La Palma by the Royal Greenwich Observatory in the Spanish Observatorio del Roque de los Muchachos of the Instituto de Astrofísica de Canarias.
References
- [1] Allen, R.J., Goss, W.M., Sancisi, R., Sullivan, W.T. III, & van Woerden, H. 1974, in “The Formation and Dynamics of Galaxies”, ed. J. R. Shakeshaft (Reidel: I.A.U. Symposium #58), p. 425
- [2] Baldwin, J.E., Lynden-Bell, D. & Sancisi, R. 1980, MNRAS 193, 313
- [3] Beckman, J.E., Peletier, R.F., Knapen, J.H., Corradi, R.L.M., & Gentet, L. 1996, ApJ, 467, 175
- [4] Begeman, K. 1989, A&A 223, 47
- [5] Boeshaar, G.O. & Hodge, P.W. 1977, ApJ 213, 361
- [6] Broeils, A.H. & van Woerden, H. 1994, A&As 107, 129
- [7] Broeils, A.H. & Rhee, M.-H., A&A, submitted
- [8] Cepa, J. & Beckman, J.E. 1990, ApJ 349, 497
- [9] de Vaucouleurs, G., de Vaucouleurs, A., Corwin, H.G., Buta, R.J., Paturel, G. & Fouqué, P. 1991, Third Reference Catalogue of Bright Galaxies (RC3), Springer, New York
- [10] Fisher, J.R. & Tully, R.B. 1981, ApJS 47, 139
- [11] Kamphuis, J. & Briggs, F. 1992, A&A 253, 335
- [12] Knapen, J.H., Beckman, J.E., Cepa, J., van der Hulst, J.M. & Rand, R.J. 1992, ApJL 385, L37
- [13] Knapen, J.H., Cepa, J., Beckman, J.E., del Rio, M.S. & Pedlar, A. 1993, ApJ 416, 563
- [14] Knapen, J.H., Beckman, J.E., Cepa, J. & Nakai, N. 1996, A&A, 308, 27
- [15] Knapen, J.H. & Beckman, J.E. 1996, MNRAS, 283, 251
- [16] Roberts, M.S. 1968, AJ 73, 945
- [17] Rots, A.H. 1975, A&A 45, 43
- [18] Rots, A.H., Bosma, A., van der Hulst, J.M., Athanassoula, E., & Crane, P.C. 1990, AJ 100, 387
- [19] Rozas, M., Beckman, J.E. & Knapen, J.H. 1996, A&A, 307, 735
- [20] Rubin, V.C., Burstein, D., Ford, W.K. & Thonnard, N. 1985, ApJ 289, 81
- [21] Sempere, M.J., García-Burillo, S., Combes, F. and Knapen, J.H. 1995, A&A, 246, 45
- [22] Staveley-Smith, L. & Davies, R.D. 1988, MNRAS 231, 833
- [23] Tifft, W.G. & Cocke, W.J. 1988, ApJS 67, 1
- [24] van der Hulst, J.M. & Sancisi, R. 1988, AJ 95, 1354
- [25] Visser, H.C.D. 1980, A&A 88, 159