LUMINOSITIES AND STAR FORMATION RATES OF GALAXIES OBSERVED WITH
THE ULTRAVIOLET IMAGING TELESCOPE:
A Comparison of Far-UV, H, and
Far-IR Diagnostics
Abstract
During the UIT/Astro Spacelab missions, the Ultraviolet Imaging Telescope obtained spatially resolved far-UV ( Å) imagery of galaxies exhibiting recent massive star formation. The sample includes disk systems, irregular, dwarf, and blue compact galaxies. The objects span an observed FUV luminosity range from to magnitudes. We estimate global star formation rates by comparing the observed FUV fluxes to the predictions of stellar population models, and compare the FUV-derived astration rates to those derived from H and far-IR photometry.
Motivation
Many aspects of galaxy evolution are driven by the spatial distribution and formation history of high-mass (M M⊙) stellar populations. Massive OB stars emit most of the radiation in the vacumn ultraviolet ( Å) while cooler, solar-type stars emit minimal radiation at these wavelengths. Therefore UV imagery provides a snapshot of the recently formed stellar populations in galaxies. Prior to 1990, only limited samples of UV photometry were available for galaxies, consisting mostly of integrated fluxes code82 ; donas87 ; buat92 and modest resolution images derived from sounding rockets, e.g., jhill84 .
The Data
During the Astro/UIT Spacelab missions in December, 1990 and March, 1995 the Ultraviolet Imaging Telescope stecher92 obtained deep, high spatial resolution (3′′, FUV ( Å) imagery of galaxies exhibiting recent massive star formation. The images cover the full angular extent of each system, most of which have diameters exceeding . The spatial resolution of the FUV images is an improvement of –20 over previously available data. These data permit determination of both global FUV properties with improved photometric precision, and detailed investigation of galaxian morphology at intermediate (spiral arms, nuclear rings) waller97 ; rwomar96 ; dsmith96 ; fanelli97 , and small (star-forming complexes) sneff97 scales.
Results
We derive global star formation rates by comparing the observed FUV fluxes to the predictions of stellar population models. For this interation, a simple model was chosen: a power law IMF with slope = 1.35, solar abundances, and mass range, M / M. Assuming continuous star formation, the observed flux can be compared to the model FUV luminosity to derive a star formation rate. Astration rates derived from FUV data can be compared to those derived from H and far-IR fluxes to explore the utility of star formation rates estimated from FUV data, and the star formation history of these systems (Table 1).
| Rate | |||
|---|---|---|---|
| (FUV) | |||
| (H) | |||
| (FIR) |
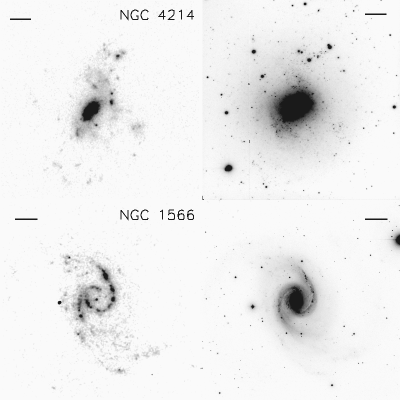
The objects span an observed (uncorrected for internal extinction) FUV luminosity range from to magnitudes (Figure 1).
The global (FUV–V) colors span a range from to , a much larger range than that found using optical bandpasses alone.
Late Hubble types are bluer in these colors, as expected.
Massive star formation rates of SFR M⊙ yr-1 are found based on the observed FUV luminosity.
For the Sm/Im galaxy NGC 4214 the ratio of FIR / FUV star formation rates is indicating that the FUV emission directly traces a significant fraction of the recently formed high-mass stars.
For the bluest systems, the ratio of FUV / H astration rates is found to be comparable.
In some dusty, FIR-luminous systems, substantial FUV light is observed, e.g., the merging system NGC 4038/39 (the “Antennae”) sneff97 . Although the FIR / FUV astration rate ratio is , the detection of extensive FUV emission indicates that massive star formation can be directly probed in these systems, despite the presence of significant extinction.

The UIT Galaxy Atlas
We marcum97 are constructing an Atlas which combines the FUV imagery obtained by the Ultraviolet Imaging Telescope and associated optical imagery obtained at ground-based telescopes. Our primary goal is to provide a morphological Atlas of Galaxies extending from far-UV ( 1500 Å) to near-IR ( 2.2) wavelengths. Comparison of the UV images with images at visible/NIR wavelengths will provide critical information on the intensity, spatial pattern, and temporal evolution of the massive stellar populations; the distribution of dust along the arms and central bars of spiral galaxies, and the relationship between recent star formation and the interstellar medium.
References
- (1) Code, A.D., & Welch, G.A. 1982, ApJ, 256, 1
- (2) Donas, J., Daharveng, J.M., Lage, M., Milliard, B., & Huguein D. 1987, A&A 180, 12
- (3) Buat, V. 1992, A&A 264, 444
- (4) Hill, J.K., Bohlin, R.C., & Stecher, T.P. 1984, ApJ 277, 542
- (5) Stecher, T. P. et al. 1992, ApJ 395, L1
- (6) Waller, W.H., Stecher, T.P., & the UIT Science Team 1997, this volume
- (7) O’Connell, R. W., & Marcum, P. 1996, in HST and the High Redshift Universe, eds. N.R. Tanvir, A. Aragon-Salamanca, & J.V. Wall.
- (8) Smith, D.A., et al. 1996, ApJ 473, L1
- (9) Fanelli, M. N., et al. 1997, ApJ, in press
- (10) Neff, S.G., & Stecher, T. P., & the UIT Science Team 1997, this volume
- (11) Marcum, P., et al. 1997, ApJS, in preparation