Origin of the viewing-angle dependence of the optical continuum emission in quasars
Abstract
The orientation-dependence of the optical continuum emission in radio-loud quasars is investigated using a new, complete sample of low-frequency-selected quasars, the Molonglo Quasar Sample (MQS). The optical continuum is found to be highly anisotropic, brightening continuously from lobe- to core-dominated quasars by 3–5 mag. It is argued that aspect-dependent extinction, rather than relativistic boosting as has been previously proposed, provides the simplest explanation consistent with the data. The reddening hypothesis is supported by both the steeper optical slopes and the larger Balmer decrements found in lobe-dominated quasars, as well as the stronger anisotropy seen at blue wavelengths. The dust responsible is shown to be physically associated with the quasar, lying mostly at radii between the broad and narrow-line regions in a clumpy distribution. Such a geometry is reminiscent of a torus. However, substantial numbers of dust clouds must lie within the torus opening angle, contributing to an increasing average optical depth with increasing viewing angle away from the jet axis, . In addition, the ratio of [O iii] 4959,5007 to [O ii] 3727 line flux is shown to be aspect dependent, and is consistent with partial obscuration of [O iii] at large . Trends of broad-line equivalent widths with are also presented, including evidence for the luminosity dependence of (Mg ii 2798).
keywords:
Galaxies: active — quasars: general — quasars: emission lines — continuum: optical1 Introduction
Attempts to disentangle aspect-dependence from the underlying physics of active galactic nuclei (AGN) have been addressed widely under the umbrella of the ‘unified schemes’ (see review by Antonucci 1993). Indeed, orientation has been proposed to be the only difference between lobe- and core-dominated radio-loud quasars (Orr & Browne 1982; Kapahi & Saikia 1982), the latter viewed from smaller angles to the radio jet and having Doppler-boosted cores.
At optical wavelengths the picture is less clear (e.g. Miller 1995). Comparisons of core- and lobe-dominated quasars, matched in radio flux density, have shown convincingly that core-dominated quasars are brighter optically by at least 1 mag (Wills & Lynds 1978; Browne & Wright 1985). However, the precise way in which the optical continuum brightness changes as a function of viewing angle is not well constrained: the aim of this work is to establish this. Previous studies (Browne & Murphy 1987; Jackson & Browne 1989) have reported a global decrease of the equivalent width of narrow [O iii] 5007 with an increasing ratio, , of radio-core to lobe flux density, a widely-used orientation indicator (Hine & Scheuer 1980; Orr & Browne 1982). If the narrow [O iii] emission is assumed to be isotropic, this trend points to an increase in optical continuum brightness in core-dominated quasars of 2-3 mag (Jackson & Browne 1989). Although this large change has been taken as evidence in favour of a relativistically-boosted component of optical continuum, the effect is weaker than predicted by Doppler-beaming models and would require another anisotropic optical component, such as from a disk, to dominate at low .
Doppler-boosting will have greatest effect at very small viewing angles to the radio jet, i.e. high , reflecting the approximate beaming solid angle. The presence of relativistically-boosted continuum is associated with the polarised light seen predominantly in ‘blazars’ (Impey, Lawrence & Tapia 1991; Wills et al. 1992). In contrast, disk emission will show the greatest proportional enhancement at low values of (i.e. with its axis inclined ∘ to the radio jet). The variation in optical continuum brightness as a function of expected for a geometrically-thin, optically-thick disk (Netzer 1987) and for Doppler-boosting models (Orr & Browne 1982; Browne & Murphy 1987) is shown in Figure 1. [These models show the reciprocal of the continuum enhancement factor, , for easy comparison with the slopes of later Figures, e.g. 7 and 8]. Obscuration of the central source at large angles to the jet axis will also result in anisotropy but with weaker angle-dependence than in the beaming case.

A two-component picture has also been proposed at X-ray energies (Kembhavi, Feigelson & Singh 1986; Browne & Murphy 1987; Baker, Hunstead & Brinkmann 1995) where the radio-core and X-ray luminosities of high- quasars appear to be tied even more closely.
Previous optical studies, however, have used data from statistically incomplete samples of quasars and are affected by complicated selection effects. Indeed, as a direct consequence of aspect-dependent optical emission, serious orientation biases will affect most magnitude-limited samples. For example, Kapahi and Shastri (1987) pointed out that the different properties (de Ruiter et al. 1986) of the low-frequency-selected 3CR and B2 radio quasar samples could be explained fully in terms of selection effects in the fainter B2 sample if the optical continuum in quasars were anisotropic.
In this paper, the aspect-dependence of the optical continuum is examined for a new, highly-complete sample of low-frequency-selected radio quasars, the Molonglo Quasar Sample (MQS). Radio and optical data have now been obtained for practically the whole sample, allowing aspect-dependent trends involving the optical continuum, narrow- and broad-line equivalent widths and Balmer decrements to be investigated thoroughly.
2 The Molonglo Quasar Sample
2.1 Selection Criteria
The Molonglo Quasar Sample (MQS) was drawn initially from the 408-MHz Molonglo Reference Catalogue (MRC; Large et al. 1981). By selecting the sample at low frequency, where the steep-spectrum extended emission dominates, orientation biases should be minimised. MRC sources in a declination strip ( and Galactic latitude ) were selected down to a limiting flux density of 0.95 Jy. ‘Stellar’ optical counterparts were sought by eye from the UK Schmidt IIIaJ survey plates down to the magnitude limit, . Quasar candidates close to the plate limit had their identifications checked on deep optical -band CCD images (, taken at Las Campanas).
In this way, a total of 113 quasar candidates was found (as of 1996 May) from the original MRC source list, resulting in a quasar detection fraction of about 20%. Spectroscopic confirmation is currently available for 108/113 quasars whose redshifts span the range . Six BL-Lacs are included in this number but five of them have no redshift determinations. Radio and optical data for the MQS will be published shortly in a pair of papers: Kapahi et al. (Paper I) and Baker et al. (Paper II), in preparation. Although the sample size may rise marginally on completion of the optical identifications for all the radio sources in the strip, the conclusions of this paper will not be affected significantly.
2.2 Radio Observations
Extensive follow-up radio observations have been undertaken for the MQS, including radio imaging with the Molonglo Observatory Synthesis Telescope (MOST) at 843 MHz and the VLA at 5 GHz. The VLA images, with a resolution of about 1″ and a typical dynamic range of 1000:1 (Paper I), have allowed the separation of compact and extended radio components from which the core-to-lobe flux density ratios, , have been estimated.
In addition, the VLA core flux densities of 82 quasars have been confirmed independently using the Parkes-Tidbinbilla Interferometer (PTI; Norris et al. 1988). The 275-km-baseline PTI was used at 2.3 GHz on 1993 Jan 22-25 to probe the radio cores on 01 scales. The PTI flux densities at 2.3 GHz confirmed the 5-GHz VLA measurements for strong cores to within 10%, and typically within 30% for weak cores ( mJy, signal-to-noise ratio ), confirming that the radio cores have flat spectra and vary little on timescales of several years. Following this check, VLA 5-GHz core measurements were used in preference for MQS sources with clearly defined cores: PTI core flux densities were however used instead, under the assumption of a flat core spectrum, if the VLA core was blended at 1″ resolution.
Lower limits to were estimated for core-dominated quasars where faint extended structure was swamped by the core emission. Conversely, upper limits to were assigned to several quasars where the VLA cores were either blended with steep-spectrum components or the radio data precluded easy separation. The -values have been K-corrected to an emitted frequency of 10 GHz using spectral indices calculated between 408 MHz and 5 GHz. This rest frequency was chosen in order to minimise spectral index corrections at the median redshift of the MQS, . -values have not been calculated for the CSS class due to the complex nature of their radio structures (Fanti & Fanti 1994), and they are considered separately. For this study, CSS quasars are defined as having 408 MHz to 5 GHz spectral indices, (), with no sign of spectral flattening at higher radio frequencies, and linear sizes kpc. The properties of the CSS quasars will be addressed in a future paper.
2.3 Optical Spectroscopy
Low-resolution (FWHM 25 Å) optical spectra, spanning the wavelength range 3400-10000Å, have been obtained for 78 quasar candidates to date with the RGO Spectrograph and FORS on the Anglo-Australian Telescope (AAT). Spectra were taken through a 2″-wide slit oriented at parallactic angle to minimise dispersive losses. Many spectra were taken under non-photometric conditions, although typical flux calibration errors lie within a factor of two. Another two MQS quasars have high signal-to-noise EFOSC spectra available (Wall & Shaver, private communication). Full observational details and a homogeneous set of 80 spectra were presented for the MQS in Paper II. Most spectra have signal-to-noise ratios in continuum, even for targets as faint as 22 mag.
Although their classification and redshifts have been confirmed, spectra for fifteen quasars were unavailable at the time of this analysis or were judged too poor for emission-line measurements. Another five candidates await spectroscopic confirmation, including two lobe-dominated and three CSS targets. On the whole, these late identifications were a consequence of ambiguity due to radio-optical positional offsets and not due to, for example, weak emission lines. It is assumed the exclusion of these twenty objects, spanning a range of radio properties and optical magnitudes, should not introduce significant biases. As mentioned above, six BL Lacs without emission lines (Å) are also excluded. One low-redshift () quasar which could be otherwise be classified as a broad-line radio galaxy is included, however. Another seven quasars have spectral data published in the literature only and are included in the analysis (see Paper II).
The optical spectra were reduced using standard techniques within the starlink figaro package, as described in Paper II. In each case, a power-law continuum was fitted by eye and emission-line fluxes integrated down to this level. Within a given spectrum, errors in continuum and line flux are generally large, 20-30%, due mostly to uncertainties in positioning the continuum. Smaller errors were measured for the emission-line equivalent widths, typically 5-15%. Due to the low spectral resolution, broad-line blends, such as Ly N v, have not been deconvolved. For the complete sample, all emission-lines in the observed wavelength interval were measured (including upper limits) and so the data should not be biassed by non-detections.
3 Statistical Analysis
Due to the significant numbers of upper and lower limits in the MQS dataset, the statistical techniques of survival analysis have been adopted. The ASURV package (Rev 1.2; La Valley, Isobe & Feigelson 1992) was used to allow the incorporation of randomly censored datapoints into standard correlation and regression tests (Feigelson & Nelson 1985; Isobe, Feigelson & Nelson 1986). Because most tests accept data limits in only one direction at a time, lower limits to only were incorporated in most cases as these are most prevalent. Unless otherwise stated, Kendall’s generalised tau test was used to obtain correlation probabilities, (corr), and both the EM-Algorithm and Buckley-James methods averaged to obtain regression estimates. Where probabilities are stated, all the above tests gave similar results, otherwise the coefficients were viewed with caution. The probabilities quoted in the following sections are given as percentages and indicate the probability that the correlation (on the scale plotted) is real.
4 Anisotropic Optical Continuum Emission
Direct relationships between the compact radio properties and the magnitudes and slopes of the optical continuum are explored first. In common with other studies the ratio is used as a statistical indicator of radio-source orientation (Orr & Browne 1982) and (unless otherwise stated) a typical Lorentz factor is adopted for consistency with other work (eg. Ghisellini, Maraschi & Treves 1985; Browne & Murphy 1987). Although recent work points to a range of Lorentz factors being present in quasar samples (e.g. Padovani & Urry 1992), in practice this will have the effect of increasing the dispersion in beamed properties only at large (see Figure 1) and will still be useful for illustrative purposes. Values of km s-1Mpc-1, and are taken throughout.
4.1 Optical and Radio-Core Brightness
The relationship between 5-GHz radio-core and optical luminosity for the whole sample is plotted in Figure 2. The optical luminosity has been calculated using homogeneous optical magnitudes, , measured from IIIaJ plates from the COSMOS Southern Sky Survey (Yentis et al. 1992) at the Anglo-Australian Observatory. Optical spectral indices were measured between 3400 and 10000Å from the observed AAT spectra; a mean value of () was used otherwise (e.g. Browne & Murphy 1987). Radio-core luminosities assume a flat spectral index. A trend is visible in Figure 2 such that quasars with luminous radio cores at 5 GHz are also brighter optically. The correlation is highly significant (%), having an overall best-fit slope of . Because the MQS is complete, correlated distance effects should be insignificant, and as confirmation the correlation remains significant in the flux-flux plane (%).
Core-dominated quasars (), highlighted in Figure 2, lie on a tighter, steeper trend than lobe-dominated quasars. The slope, , is also slightly steeper than that reported by Browne & Murphy (1987) for a sample of more luminous quasars with . Although the two luminosities are not proportional, this suggests a particularly close relationship between the total optical and radio-core emission in core-dominated sources, perhaps due to relativistic beaming. In addition, the correlation for core-dominated quasars appears slightly displaced from that for lobe-dominated sources. This indicates further that the optical brightness is not as strong a function of viewing angle as the radio, or, that two components of optical emission are present in quasars.

4.2 Optical Magnitudes and
COSMOS optical magnitudes are plotted against in Figure 3 with group medians superposed. A weak trend (%) is observed such that core-dominated quasars tend to be brighter than their lobe-dominated counterparts by almost 1 mag in the unbiased MQS. The median optical magnitudes over three ranges of support this trend, brightening from in quasars with to in quasars with . Interestingly, the median optical magnitude of CSS quasars is at least 1 mag fainter on average () than non-CSS quasars ().

Figure 4 shows the -distributions for faint and bright quasars, separated at the median magnitude of the whole MQS, (Paper II). The expected -distribution for randomly-oriented quasars, according to the relativistic-beaming model of Orr & Browne (1982) with , is also shown in Figure 4 as a dashed line for comparison. Statistical tests confirm that the two -distributions are different (%). This difference is not a result of intrinsic luminosity effects, however, as the redshift distributions of the faint and bright sub-samples are indistinguishable by two-sample tests.
Looking at Figure 4 more closely, the -distribution of faint MQS quasars () appears largely consistent with the model distribution for random orientations, except at high . In fact, both quasar subsets show an excess of sources with , suggesting some orientation bias due to the presence of a relativistically-beamed component. In particular, luminous but more distant quasars will be brought into the flux-limited sample as a result of extreme Doppler boosting. Larger numbers of beamed, distant quasars would be expected in the sample if the distribution of Lorentz factors had a tail to high values . This could explain the proportion of core-dominated quasars in the MQS of about 25%, somewhat higher than the 20% predicted by the simple model of Orr & Browne with a single . Also, the -distribution for the brighter () sub-sample in Figure 4 peaks at higher -values than for fainter quasars by about a factor of ten (Kapahi, Subrahmanya & D’Silva 1989). This indicates that brighter quasars tend also to have stronger cores, but they are not necessarily the most highly boosted. Such a picture suggests that anisotropic processes occurring at lower are dominated by a process other than relativistic boosting.


The differences in Figure 4 become stronger if the sample is split in optical luminosity rather than apparent magnitude. Redshift-dependent selection effects should have little effect on luminosity trends for the MQS as the distributions of redshift are similar for quasars with and . Figure 5 shows the distributions of redshift for MQS quasars with , and CSS radio morphologies. For the three subsets, the median redshifts are 0.99, 0.81 and 0.78, respectively, and they span similar ranges.
4.3 Optical Spectral Slope and
Together with the brightening of the optical continuum in core-dominated quasars, as inferred from Figures 2 and 4, any observed change of continuum slope might give a clue to the mechanism for the enhancement. Figure 6 shows the observed (3400–10000 Å) optical spectral index, , plotted as a function of . High- and low-redshift MQS quasars have been marked separately because numerous line blends, particularly the 3000-Å bump (Wills, Netzer & Wills 1985), make it more likely that the true continuum is masked at the restframe wavelengths observed in the high-redshift objects (see Paper II).
Although the scatter in Figure 6 is very large, an upper envelope is apparent in the low- subset, such that the maximum observed decreases towards high . At least, the reddest quasars are all at low . In this low-redshift subset the continuum slope measurement is more reliable. As mentioned in Section 2.3, a number of quasars have been left out of this plot awaiting good quality optical spectra (see Paper II), and their final inclusion will test whether the apparent paucity of red quasars at high redshifts is real, or a temporary selection effect. The spectral properties of quasars as a function of is discussed later (see Section 7).

As shown in Paper II, a correlation between optical magnitude and spectral index also exists in the MQS, such that flatter optical continua are found preferentially in optically-bright quasars. The relationships of with both and , along with the dependence of optical magnitude on (Figure 4), suggest that the optical continuum is both brighter and harder in core-dominated quasars. As selection effects work in the opposite direction, the simplest explanation is that bright, red quasars are rarer than bright, blue ones because they are drawn from a higher luminosity population.
The large range of optical spectral indices observed in the MQS could be interpreted in terms of two components of optical continuum emission in quasars — a hard component which dominates at small angles and a steep-spectrum component which is strong at larger inclinations. Or, the greater tendency for lobe-dominated quasars to have red spectra could point to aspect-dependent dust extinction as the culprit.
5 Narrow-Line Equivalent Widths
In order to correct for intrinsic luminosity effects and therefore reveal the aspect-dependence of the optical continuum in a flux-limited sample, an orientationally-independent property is needed as a benchmark. Extended narrow-line emission is a natural choice as it is mostly emitted far ( kpc) from the nucleus and is thought to be isotropic (Pierce & Stockton 1986; Stockton & MacKenty 1987; Baum & Heckman 1989). Previous studies (Wills & Browne 1986; Browne & Murphy 1987; Jackson & Browne 1989) tended to use the narrow [O iii] 5007 line for this comparison because it is prominent and occurs in a spectral region relatively free from line blends.
Equivalent widths, , have been measured for the MQS for a range of strong emission lines (Paper II). The -dependence of the equivalent widths is now investigated, beginning with the narrow lines. CSS sources are excluded from correlations involving , but are otherwise included.
5.1 Equivalent Widths of [O iii]
Figure 7 shows the relationship for the [O iii] 4959,5007 doublet for the MQS, limited observationally to quasars with . Although the scatter on Figure 7 is substantial, a clear anticorrelation is apparent with a Kendall’s tau likelihood of being real of 99.7%, upon inclusion of the lower limits to . The anticorrelation in Figure 7 spans about a factor of ten in , in quantitative agreement with the earlier data of Jackson & Browne (1989). Again, this is less than expected by Doppler-boosting alone (see Figure 1) but is consistent with two-component models for the optical continuum. The large scatter on the plot cannot be attributed solely to measurement errors; factors contributing to the scatter are discussed later.

5.2 Equivalent Widths of [O ii]
Due to the high signal-to-noise ratio and blue coverage of the MQS spectra, narrow [O ii] 3727 equivalent widths have also been measured for a large number of quasars (up to ). In Figure 8, ([O ii]) is plotted against for MQS quasars (note the scale is different from Figure 7). Despite the large scatter, a significant anticorrelation is observed (%), with core-dominated quasars having smaller ([O ii]) than their lobe-dominated counterparts by factors of 100–1000. Such a decrease is remarkably consistent with the expected aspect-dependence of a relativistically-beamed optical continuum component.

Measurement uncertainties are larger, on average, for weaker [O ii] than [O iii] due to the underlying broad 3000-Å restframe feature. To minimise this uncertainty, the polynomial continuum fit was tied when possible to the H –[O iii] region and extrapolated out to the wavelength of [O ii]. The -measurement errors shown take account of the difference between using the extrapolated or local continuum level. This approach is justified a posteriori by the finding that the 3000Å bump strength appears to depend on (Baker & Hunstead 1995). However, in quasars with , little line-free continuum is available and the equivalent width may be underestimated by up to 50% in individual cases, e.g. several high-, low-, low- objects in Figure 8. Over the range available, no redshift dependence was found for ([O ii]), ruling out any strong luminosity dependence affecting higher- quasars.
The strong decrease of ([O ii]) with in the MQS indicates that the continuum is highly anisotropic. However, the weaker trend observed for [O iii] implies that the line luminosities themselves, or their ratio, must be -dependent as a consequence of obscuration or ionisation effects.
5.3 -Dependence of the [O ii]/[O iii] Ratio
Figure 9 shows the ratio of [O ii] 3727/[O iii] 49595007 line flux as a function of for the MQS. A strong anticorrelation is found (%), the ratio [O ii]/[O iii] falling off by at least a factor of ten. (Note that one quasar stands out on the plot, 1247-290, having both low and [O ii]/[O iii] — its spectrum in Paper II confirms that [O ii] is unusually weak in this object.) This trend might imply that either [O ii] or [O iii] emission is anisotropic. Alternatively, high- quasars on the plot may produce harder ionising radiation, thus reducing the [O ii]/[O iii] ratio, for example if they have more powerful jets (see Section 7).

6 Broad-Line Equivalent Widths
Originating closer to the quasar nucleus, perhaps in a disk or wind, broad-line emission is likely to be anisotropic (Osterbrock & Mathews 1986; Collin-Souffrin 1992; Peterson et al. 1992), and a relationship with is of additional interest in trying to understand the broad-line region (BLR).
a)

b)

c)

6.1 Broad Mg ii, C iii] and C iv.
The -dependence of the equivalent widths of the broad lines Mg ii 2798, C iii] 1909 and C iv 1549 is presented in Figure 10. A strong dependence of (Mg ii) on is present in Figure 10a) with 99.7% significance in the unbiased MQS. Mg ii 2798 is the most commonly-detected line over the redshift range of the MQS; data have been measured for 67 quasars with . A similar anticorrelation of (Mg ii) with was reported by Browne & Murphy (1987) and Baldwin, Wampler & Gaskell (1989) although these samples are affected more strongly by selection effects.
No significant trends with are found for C iii] and C iv, although these plots include less points than for Mg ii. Both plots are, however, qualitatively consistent with the Mg ii trend, and show a paucity of high- core-dominated quasars, i.e. the upper right-hand corner is empty. Such bright, strong-lined objects should not have been missed due to the selection criteria.

On closer inspection, the Mg ii anticorrelation in Figure 10 shows a strong redshift dependence, having a much steeper gradient in the subsample (Figure 11). Both subsamples are well populated with data and show significant anticorrelations. The stronger -dependence at high- cannot be explained solely by overestimation of the observed continuum level due to the presence of the 3000-Å bump, as this is expected to vary by less than a factor of two in (see Baker & Hunstead 1995). Therefore, this trend must reflect a real luminosity dependence or evolution of the quasar spectra.
6.2 The Balmer Lines
Figure 12 shows the -dependence of the equivalent widths of H for MQS quasars with . No strong dependence of (H ) is observed, although the plot is qualitatively consistent with those in Figure 10. The small dispersion, roughly a factor of two, agrees with the previously-reported close proportionality between the non-thermal optical-continuum luminosity and H -line luminosity seen in all types of AGN (Yee 1980; Shuder 1981) and taken to imply a direct link via photoionisation. This confirms that the relationship is not an artifact due to selection effects in the early samples.


Figure 13 presents the plots for the H 6563 and H 4340 lines. (H ) shows the greater scatter in Figure 13, probably indicating substantial contamination by [O iii] 4363. Although the number of quasars with measurable H () is small, there is a formal correlation probability of 99.5% that (H ) decreases at high . (H ) shows no significant anticorrelation with . Again, both plots are still consistent with the trends in Figure 10, notably the paucity of points in the high-, high- quadrant.
6.3 Balmer Decrements
The Balmer-line ratios H /H and H /H are now investigated. Figure 14 shows that both Balmer decrements tend to decrease with . The anticorrelation for H /H has a 97% significance despite including only 13 points. The H /H correlation is weaker than H /H ((corr)% excluding the extreme point) and also shows more scatter, probably due to significant contamination of H by [O iii] 4363. A similar decrease in H /H ratio with was reported previously by Jackson & Browne (1991) for a heterogeneous sample. Blending of H and H with narrow lines or Fe ii will contribute to the scatter.

The Balmer decrements of core-dominated quasars () approach the canonical ‘case-B’ H /H value of 2.85 (e.g. Davidson & Netzer 1979; Osterbrock 1989), suggesting that these simple assumptions are valid for these quasars. In contrast, quasars at low show H /H ratios of up to ten, implying they are reddened. The -dependence of H /H suggests that quasars viewed at large angles to their radio-jet axis suffer greater extinction than those viewed pole on.
7 Discussion
The correlations and trends presented above confirm that core-dominated MQS quasars are indeed brighter optically than their lobe-dominated counterparts. This is clear from direct comparison of optical magnitudes in the unbiased MQS (Figures 3 and 4) and is even more convincing if the optical continuum is normalised to more isotropic components, such as the narrow-line flux (Figures 7 and 8). In addition, Figures 6 and 14 show that lobe-dominated quasars have both redder continua and larger H /H ratios than core-dominated quasars. These results are now discussed and a consistent picture proposed.
7.1 Narrow-Line Equivalent Widths
The decrease with increasing of both the narrow [O iii] and [O ii] equivalent widths (Figures 7 and 8) suggests the optical continuum is brighter in core-dominated quasars by a factor of between 10 and 100. However, the amount by which the of the two narrow lines drops is different. If the drop were due entirely to continuum changes, this would imply the continuum strength changes more in the blue (see Figure 17 and later discussion). Otherwise, either [O ii] or [O iii] must be emitted anisotropically, or their ratio must change with . In support of [O iii] being anisotropic, [O iii] has been shown to be weaker in radio galaxies than quasars of matched extended luminosity (Jackson & Browne 1990; Jackson & Eracleous 1995). It has been argued that this is due to obscuration of the nuclear [O iii] component in radio galaxies. In contrast, the indistinguishability of [O ii] line luminosity between radio galaxies and quasars matched in extended radio flux density (Bremer et al. 1992; Hes, Barthel & Fosbury 1993) suggests [O ii] emission is more isotropic. As is clear in Figure 9, the [O ii]/[O iii] line ratio itself is - dependent, consistent with partial obscuration of [O iii] in lobe-dominated quasars.
Alternatively, the overall decrease in at high may arise if core-dominated quasars in the sample include highly-beamed objects of low instrinsic power, with weak extended radio and narrow-line emission. This argument follows from the global correlation observed between narrow-line and radio luminosity for radio-loud AGN (Saunders et al. 1989; Rawlings 1994). However, the majority of core-dominated quasars in the MQS still have low-frequency flux densities well in excess of the measured core flux (confirmed by the 01 resolution PTI flux densities) and would remain in the sample on the basis of their extended emission alone. No significant trends were found between the radio and narrow-line luminosities of MQS quasars, as expected over the relatively small radio luminosity range of the MQS (1–2 decades). This makes it unikely that intrinsic power effects dominate the - plots. However, the strength of [O ii] relative to [O iii] may be reduced (by about an order of magnitude) in some luminous core-dominated quasars as a consequence of an - or luminosity-dependent ionisation parameter (e.g. Saunders et al. 1989; Netzer 1990).
At low , the small numbers of objects with very high suggests that most of these are excluded from quasar samples (e.g. Francis 1993; Zwitter & Calvani 1994), for example if they were classified as radio galaxies. Spectroscopy of a complete sample of 2-Jy southern radio sources by Morganti et al. (1995) shows that radio galaxies do indeed have larger [O iii] and [O ii] equivalent widths than comparable quasars. These are also consistent with the trends shown for the MQS.
7.2 Scatter on Plots
The scatter on the plots for both [O ii] and [O iii] (Figures 7 and 8) is very large. It is larger than the measurement errors, and so a number of intrinsic processes presumably contribute.
Detailed investigation of the effects of radio and optical variability is precluded by the present single-epoch data, although variability is expected to be small for lobe-dominated quasars in any case. Radio-core variations (from comparing VLA and PTI data, assuming a flat spectral index) were less than a factor of two for all sources. Optical continuum variability in quasars has been estimated to contribute only 0.2 magnitudes on average (Treves et al. 1989; Hook et al. 1991), and line variability is negligable within the measurement uncertainties, especially for the narrow lines. The effect of missing extended line flux through a narrow slit (see Paper II) is also negligable over the sample.
Extended emission-line regions are ubiquitous in AGN and the total energy output in narrow-line luminosity is probably related closely to the power of the radio jet emanating from the nucleus. The observed scaling of the narrow-line luminosity with radio-jet power (Saunders et al. 1989) itself shows scatter comparable with that seen in Figures 7 and 8. In addition, the intensity of [O ii] is known to be more sensitive than [O iii] to the ionisation parameter (Netzer 1990) and intrinsic differences in ionisation level will also cause a spread in the ratio of [O ii]/[O iii] (Figure 9). Differences in local environment may also cause dispersion in narrow-line luminosities (e.g. McCarthy 1993). Scatter in may also increase due to variations in the broad-band continuum shape itself from source to source (Elvis 1994).
7.3 Reddening in MQS Spectra
The combination of trends with , especially the decrease in H /H (Figure 14) and (Figure 6) and the changing relationship between the radio-core and optical luminosity (Figure 2) with increasing , suggests that the continuum anistropy is not due solely to relativistic beaming. Extinction would seem to provide the explanation: this is investigated further below. To illustrate the increasing extinction at low , Figure 15 plots the implied visual extinction, , against . The estimated values of were converted from the H /H Balmer decrements (Figure 14) assuming a roughly reddening law (e.g. Osterbrock 1989).


Figure 16 shows the remarkably tight correlation (%, slope )) between H /H and for low-redshift MQS quasars. This confirms that the two are closely associated, presumably a consequence of dust extinction. This clear association supports the use of both H /H and as reddening indicators, with additional caveats. We assume is still representative once H has been redshifted beyond Å.
It is noted that broad Balmer-line ratios may be affected by collisional excitation and optical-depth effects within the BLR (e.g. MacAlpine 1985) and this will contribute to the scatter. H /H ratios up to can be reproduced in such models. However, these secondary processes presumably do not dominate this study because H /H approaches the canonical case-B value in quasars which we assume to be unobscured (i.e. high and flat ).
7.4 Equivalent Widths and Reddening
To illustrate the link between reddening and narrow-line , Figure 17 shows the equivalent widths of narrow [O ii] 3727 and [O iii] 4959,5007 plotted against the optical spectral index, . Both ([O ii]) and ([O iii]) correlate remarkably strongly with , with correlation probabilities % and slopes for [O ii] and for [O iii]. Such a relationship confirms the view that the range in is due predominantly to the joint weakening and steepening of the optical continuum as a consequence of extinction. As expected, the Balmer decrements also correlate with the narrow [O iii] and [O ii] equivalent widths.

Figure 18 shows broad-line as a function of . No strong correlations with are observed for any of the lines, H , Mg ii, C iii] or C iv.

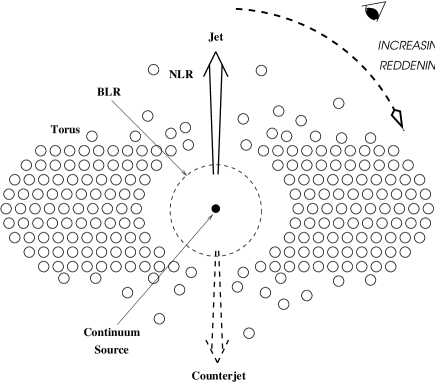
Assuming the optical spectral slope is a statistical reddening indicator, the results in Figure 18 are consistent with reddening of both the broad lines and continuum by a similar amount in each object. The narrow lines, in contrast, must be reddened less than the continuum because their equivalent widths are strongly dependent on . In other words, in the reddest objects, both the continuum and the broad lines are weak (i.e. broad constant), but the narrow lines remain strong (i.e. large). From these arguments, the material causing the extinction must be physically associated with the quasar itself, and located at radii outside both the BLR and optical continuum source but inside the narrow-line region (NLR).
7.5 Testing the Reddening Hypothesis
Next, the hypothesis that dust extinction can account for all the observed anisotropy of the optical continuum, as inferred from the -dependence of the narrow oxygen-line equivalent widths, is tested semi-quantitatively. This comparison assumes that the range in of a given forbidden line is due solely to changes in the strength of the underlying continuum. Also, the Balmer lines and continuum are assumed to suffer the same extinction. An approximate reddening law is used (as in Osterbrock 1989).
Increasing the Balmer decrement from H /H to 10 (i.e. an equivalent ) in low- quasars (Figure 14) predicts about 5 mag of continuum extinction at 3727Å. This is consistent with the observed range of [O ii] equivalent widths in the MQS (Figure 8). At the wavelength of [O iii], 4 mag extinction is expected at low for the same but ([O iii]) varies less than this (approximately 2.5 mag). The missing 1–2 mag can be accounted for if the [O iii] line luminosity (but not [O ii]) increases by this amount over the range . Reddening a continuum with with up to 3.7, the predicted range of is 0.5-4, i.e. slightly steeper than observed (maximum ). This may indicate that either the intrinsic spectra are flatter than (eg. Binette, Fosbury & Parker 1993) or the broad lines are reddened more than the continuum by dust internal to the Balmer-line-emitting clouds (e.g. Wills et al. 1993).
If a smaller amount of reddening is postulated, enough to explain only the ([O iii]) trend with , a larger discrepancy must be explained in ([O ii]). As discussed above, such a difference could arise from ionisation differences leading to weaker [O ii] luminosities in core-dominated quasars. Also, a range of Balmer decrements smaller than observed would be predicted, i.e. H /H –6.
7.6 A New Perspective
The most plausible dust geometry consistent with the reddening trends discussed above is a torus with its axis aligned with the radio jets (see Figure 19). Traditionally, an opaque torus with a sharp opening angle has been proposed to obscure the BLR in narrow-line AGN (Krolik & Begelman 1986). In contrast, the pronounced reddening observed in lobe-dominated MQS quasars implies that significant quantities of dust must lie within the putative torus opening angle. In fact there may not be a well-defined opening angle at all.
In this new picture, the total opacity of the dusty material observed to redden the broad lines and optical continua of MQS quasars increases systematically as the quasar is viewed at larger angles to the jet axis. In directions perpendicular to the jet, the column density must be sufficient to obscure the broad lines completely, consistent with the unification of quasars and radio galaxies. Such a strong variation of column density with viewing angle might be achieved either geometrically, or with a latitude-dependent dust density.
To prevent the destruction of the dust grains by thermal spallation (Krolik & Begelman 1988), the dust would presumably have to be in a clumpy distribution. Therefore, at low opacities, the reddening might be expected to be ‘quantised’ with some fraction of quasars at any given viewing angle being affected strongly. In this case, the spectral slopes and Balmer decrements of individual quasars might exhibit large scatter with , as in Figure 6, but their average would be more representative, consistent with the smooth trends seen in composite MQS spectra (Baker & Hunstead 1995). Scatter would also be expected in the narrow-line – plots.
The dusty material inferred to be present at high latitudes to the plane of the proposed torus may be related to the scattering clouds along the jet axis which reflect nuclear light towards the observer in some AGN (Antonucci & Miller 1985; Goodrich 1990; di Serego Alighieri et al. 1996). Both dust and hot electrons have been proposed as the scattering medium. Indeed, substantial amounts of reddening would be expected to result in dichroic polarisation of the quasar light. Lobe-dominated quasars may also show polarised broad-line emission, similar to that observed for radio galaxies. Also, the distribution of the dust in the torus region will have implications for modelling the infrared emission from quasars (eg. Pier & Krolik 1992; Efstathiou & Rowan-Robinson 1995). The observed anisotropy of the infrared emission (Heckman et al. 1994) may imply that the dust remains optically thick down to long wavelengths. At higher energies, reddened quasars might show more UV and/or X-ray absorption than their core-dominated counterparts, providing a valuable probe of the inner regions of the torus. Optical absorption lines might also be more common in lobe-dominated quasars as a consequence.
Although red quasars have been noted in the literature before (Smith & Spinrad 1980; Mathur 1994), their relationship to other quasars and the origin of their steep continua has remained unclear. The extinction of the BLR and continuum in quasars viewed at large angles to the radio jet is consistent with the unification by obscuration of radio sources, implying a smooth transition from quasars to radio galaxies. An analogous reddening geometry has been proposed for Seyfert galaxies, such that extinction is least in Seyferts observed with the minor axis of the host galaxy oriented close to the line of sight (de Zotti & Gaskell 1985). The aspect-dependent extinction model is also in agreement with the large extinctions () inferred towards narrow-line AGN (Simpson, Ward & Wilson 1995) and recent discoveries of broad Balmer emission lines in the infrared, and the subsequent re-classification, of a number of radio galaxies (e.g. Lacy et al. 1995). In this way, dust would also affect the relative numbers of classified broad and narrow-line objects, perhaps relieving some problems with simple interpretation of the radio-loud unified scheme (Singal 1993; Laing 1994; Kapahi et al. 1995). Preferential reddening of lobe-dominated quasars will also introduce yet another orientation-dependent sample selection bias on the basis of optical colour, such that faint, red low- objects are more likely to be missed on blue photographic plates. It is also possible that the effects of dust extinction are more prominent in faint quasar samples, such as the MQS, than in brighter samples, prompting the further investigation of the luminosity dependence of reddening.
7.7 Broad Lines
In general, is not a strong function of for the broad lines, suggesting the lines themselves suffer extinction. However, there is a tendency for broad to be weaker in core-dominated quasars; this is not a selection effect. The decrease of with is clearest for the low-ionisation line Mg ii. This trend suggests that these broad lines are either emitted more isotropically than the continuum, or suffer less reddening. Perhaps dust surviving at very small radii within the BLR obscures the continuum more than the broad-line clouds. If dust is distributed throughout the BLR, then of low-ionisation or semi-forbidden lines in particular might be expected to show some correlation with , or : excluding CSS quasars on Figure 18, the reddest quasars also have the highest (Mg ii).
The roughly constant of the Balmer recombination lines, notably H , must imply that even if a relativistically-beamed component is present in luminous, high- quasars, it does not dominate the photoionising continuum we see. Aspect-dependent reddening would explain naturally the constancy of (H ) with , albeit fortuitously. An alternative picture is that the optical continuum originates in the same region as H (Binette et al. 1993).
The redshift/luminosity dependence of (Mg ii) is quite striking; the line is observable over the largest range of redshifts in the MQS. This dependence may indicate the presence of either a stronger continuum or a higher ionisation parameter in high luminosity quasars. Trends with redshift are not seen for the narrow [O ii] and [O iii] lines and the range in redshift is too small to judge this for C iii] and C iv.
8 Conclusions
(1) The analysis of optical spectra for the MQS presented in this paper provides strong evidence that the optical continuum emission in radio quasars is highly aspect dependent, enhanced in core-dominated quasars by 3–5 mag.
(2) The bulk of the aspect dependence in lobe-dominated MQS quasars, both of the optical continuum and the broad emission lines, arises from anisotropic extinction. Reddening is favoured from the -dependence of the optical continuum slope and Balmer decrement; it is favoured similarly by the wavelength dependence of the continuum changes, varying more with viewing angle in the blue. Furthermore, the values of H /H in unobscured quasars (i.e. high , flat ) support the ‘case-B’ recombination picture.
(3) Extinction affects the continuum and broad lines more than the narrow lines, suggesting that the dust distribution responsible is physically associated with the active galaxy and lies at distances between the BLR and NLR. A dusty torus is a plausible candidate. However, substantial numbers of dust clouds must lie within the torus opening angle, contributing to the average column density that increases with viewing angle away from the radio-jet axis.
(4) The ratio of [O ii]/[O iii] is also -dependent, consistent with anisotropic obscuration of [O iii] at small radii and [O ii] being more isotropic than [O iii] and arising at larger distances from the nucleus.
(5) Aspect-dependent reddening in quasars implies that magnitude-limited samples must be affected strongly by orientation-dependent selection biases, affecting not only optical brightness but also colour and broad-line properties.
Acknowledgments
Special thanks to Richard Hunstead, Vijay Kapahi, C.R. Subrahmanya and Pat McCarthy for extensive work on the identification and follow-up of the MQS. Thanks also to the referee, Neal Jackson, plus Richard Saunders, Ian Browne, Peter Barthel, Steve Rawlings and Chris Simpson for valuable discussions and Raylee Stathakis and Elaine Sadler for AAT Service observations. The AAT observatory staff are also thanked. JCB acknowledges a graduate scholarship from the Research Centre for Theoretical Astrophysics, University of Sydney, for part of this work.
References
- [1]
- [2] Antonucci R.R.J., 1993, ARAA, 31, 473
- [3] Antonucci R.R.J., Miller J. S., 1985, ApJ, 297, 621
- [4] Baker J.C., 1994, PhD Thesis, University of Sydney
- [5] Baker J.C., Hunstead R.W., 1995, ApJL, 452, L95
- [6] Baker J.C., Hunstead R.W., Brinkmann W., 1995, MNRAS, 277, 553
- [7] Baldwin J.A., Wampler E.J., Gaskell C.M., 1989, ApJ, 338, 630
- [8] Baum S.A., Heckman T., 1989, ApJ, 336, 681
- [9] Binette L., Fosbury R.A., Parker D., 1993, PASP, 105, 1150
- [10] Bremer M.N., Crawford C.S., Fabian A.C., Johnstone R.M., 1992, MNRAS, 254, 614
- [11] Browne I.W.A., Murphy D.W., 1987, MNRAS, 226, 601
- [12] Browne I.W.A., Wright A.E., 1985, MNRAS, 213, 97
- [13] Collin-Souffrin S., 1992, in Holt S.S., Neff S.G., Urry C.M., eds, Testing the AGN Paradigm, AIP, New York, 119
- [14] Davidson K., Netzer H., 1979, Rev. Mod. Phys., 51, 715
- [15] de Ruiter H.R., Rogora A., Padrielli L., 1986, in Swarup G., Kapahi V.K., eds, Proc. IAU Symp 119, Quasars, Reidel, Dordrecht, 197
- [16] de Zotti G., Gaskell C.M., 1985, A&A,147, 1
- [17] di Serego Alighieri S., Cimatti A., Fosbury R.A.E.., Perez-Fournon I., 1996., MNRAS, 279, L57
- [18] Efstathiou A., Rowan-Robinson M., 1995, MNRAS, 273, 649
- [19] Elvis M., 1994, in Courviosier T.J.-L., Blecha A., eds, Multi-wavelength continuum emission of AGN, Kluwer, Dordrecht, 25
- [20] Fanti C., Fanti R., 1994, in Bicknell G.V., Dopita M.A., Quinn P.J., eds, Procs. First Stromlo Symposium, The Physics Of AGN, A.S.P. Conf. Ser., Vol 54, 341
- [21] Feigelson E.D., Nelson P.I., 1985, ApJ, 293, 192
- [22] Francis P.J., 1993, ApJ, 405, 119
- [23] Ghisellini G., Maraschi L., Treves A., 1985, A&A, 146, 204
- [24] Goodrich R.W., 1990, ApJ, 355, 88
- [25] Heckman T.M., O’Dea C.P., Baum S.A., Laurikainen E., 1994, ApJ, 428, 65
- [26] Hes R., Barthel P.D., Fosbury R.A.E., 1993, Nature, 362, 326
- [27] Hine R.G., Scheuer P.A.G., 1980, MNRAS, 193, 285
- [28] Hook I.M., McMahon R. G., Boyle B.J., Irwin M.J., 1994, MNRAS, 268, 305
- [29] Impey C.D., Lawrence C.R., Tapia S., 1991, ApJ, 375, 46
- [30] Isobe T., Feigelson E.D., Nelson P.I., 1986, ApJ, 306, 490
- [31] Jackson N., Browne I.W.A., 1989, Nature, 338, 485
- [32] Jackson N., Browne I.W.A., 1990, Nature, 343, 43
- [33] Jackson N., Browne I.W.A., 1991, MNRAS, 250, 422
- [34] Jackson N., Eracleous 1995, MNRAS, 276, 1409
- [35] Kapahi V.K., Saikia D.J., 1982, JAA, 3, 465
- [36] Kapahi V.K., Shastri P., 1987, MNRAS, 224, 17p
- [37] Kapahi V.K., Subrahmanya C.R., D’Silva S., 1989, in Osterbrock D.E., Miller J.S., eds, Proc. IAU Symp. 134, Active Galactic Nuclei, Kuwer, Dordrecht, 531
- [38] Kapahi V.K., Athreya R.M, Subrahmanya C.R., Hunstead R.W., Baker J.C., McCarthy P.J., van Breugel W., 1995, Supp. JAA, 16, 125
- [39] Kembhavi A., Feigelson E.D., Singh K.P., 1986, MNRAS, 220, 51
- [40] Krolik J.H., Begelman M.C., 1986, ApJL, 308, L55
- [41] Krolik J.H., Begelman M.C., 1988, ApJ, 329, 702
- [42] Lacy M., Rawlings S., Eales S., Dunlop J.S., 1995, MNRAS, 273, 821
- [43] Laing R., Jenkins C.R., Wall J.V., Unger S.W., 1994, in Bicknell G.V., Dopita M.A., Quinn P.J., eds, Procs. First Stromlo Symposium, The Physics Of AGN, A.S.P. Conf. Ser., Vol 54, 201
- [44] Large M.I., Mills B.Y., Little A.G., Crawford D.F., Sutton J.M., 1981, MNRAS, 194, 693
- [45] LaValley M., Isobe T., Feigelson E.D., 1992, B.A.A.S., 24, 839
- [46] MacAlpine G.M., 1985, in Miller J.S., eds, Astrophysics of Active Galaxies and Quasi-stellar Objects, University Science Books, Mill Valley, 259
- [47] Mathur S., 1994, ApJ, 431, 75
- [48] McCarthy P.J., 1993, ARAA, 31, 639
- [49] Miller, J.S., 1995, Proc. Natl. Acad. Sci USA, 92, 11422
- [50] Morganti R., Tadhunter C.N., Fosbury R.A.E., Oosterloo T., Danziger I.J., di Serego Alighieri S., Siebert J., Brinkmann W., 1995, PASA, 12, 3
- [51] Netzer H., 1987, MNRAS, 225, 55
- [52] Netzer H., 1990, in Courvoisier T.J.-L., Mayor M., eds, Active Galactic Nuclei, Springer-Verlag, Berlin, 57
- [53] Norris R.P, Kesteven M.J., Wellington K.J., Batty M.J., 1988, ApJS, 67, 85
- [54] Orr M., Browne I.W.A., 1982, MNRAS, 200, 1067
- [55] Osterbrock D.E., 1989, Astrophysics of Gaseous Nebulae and Active Galactic Nuclei, University Science Books, Mill Valley
- [56] Osterbrock D.E., Mathews W.G., 1986, ARAA, 24, 171
- [57] Padovani P., Urry C.M., 1992, ApJ, 387, 449
- [58] Peterson B.M., Ferland G.J., Horne K., Welsh W.F., Nahar S.N., 1992, in Duschl W.J., Wagner S.J., eds, Physics of Active Galactic Nuclei, Springer-Verlag, Berlin, 160
- [59] Pier E.A., Krolik J.H., 1992, ApJ, 401, 99
- [60] Pierce M.J., Stockton A., 1986, ApJ, 305, 204
- [61] Rawlings S., 1994, in Bicknell G.V., Dopita M.A., Quinn P.J., eds, Procs. First Stromlo Symposium, The Physics Of AGN, A.S.P. Conf. Ser., Vol 54, 253
- [62] Saunders R., Baldwin J.E., Rawlings S., Warner P.J., Miller L., 1989, MNRAS, 238, 777
- [63] Shuder J.M., 1981, ApJ, 244, 12
- [64] Singal A.K, 1993, MNRAS, 262, L27
- [65] Simpson C., Ward M., Wilson A.S., 1995, ApJ, 454, 683
- [66] Smith H.E., Spinrad H., 1980, ApJ, 236, 419
- [67] Stockton A., MacKenty J., 1987, ApJ, 316, 584
- [68] Treves D., Pitella G., Kron R.G., Bershady M., 1989, AJ, 98, 108
- [69] Wills B.J., Browne I.W.A., 1986, ApJ, 302, 56
- [70] Wills B.J., Netzer H., Wills D., 1985, ApJ, 288, 94
- [71] Wills B.J., Wills D., Breger M., Antonucci R., Barvainis R., 1992, ApJ, 398, 454
- [72] Wills B.J., Brotherton M.S., Fang D., Steidel C.C., Sargent, W.L.W. 1993, ApJ., 415, 563
- [73] Wills D., Lynds R., 1978, ApJS, 36, 317
- [74] Yee H.K.C., 1980, ApJ, 241, 894
- [75] Yentis D.J., Cruddace R.G., Gursky H., Stuart B.V., Wallin J.F., MacGillivray H.T., Collins C.A., 1992, in MacGillivray H.T., Thomson E.B., eds, Digitised Optical Sky Surveys, Kluwer, Dordrecht, 67
- [76] Zwitter T., Calvani M., 1994, MNRAS, 270, L27