RXTE Observation of Cygnus X-1 In Its High State
Abstract
We present the results from the RXTE observations of Cygnus X-1 in its high state. In the energy range of 2-200 keV, the observed X-ray spectrum can be described by a model consisting of a soft blackbody component and a broken power-law with a high energy cutoff. The low energy spectrum (below about 11 keV) varies significantly from observation to observation while the high energy portion changes little. The X-ray flux varies on all timescales down to milliseconds. The power density spectrum (PDS) can be characterized by excess red noise (“1/f”) at low frequencies and a white noise component that extends to 1-3 Hz before being cut off. At higher frequencies, the PDS becomes power-law again, with a slope of roughly -2 (i.e., “”). Broad peaks in the range of 3-9 Hz are present, and might be due to quasi-periodic oscillations. The PDS shows interesting spectral dependence: the 1/f component becomes more prominent when the low-energy spectrum becomes softer. The difference in the observed spectral and timing properties between the low and high states is qualitatively consistent with a simple “fluctuating corona” model.
1 Introduction
Cyg X-1 is a prototype black hole candidate (BHC; see a review by Tanaka & Lewin 1995). It spends most of the time in the low (or hard) state where the soft X-ray luminosity (2-10 keV) is low and the energy spectrum is characterized by a single power-law with a photon index of (Liang & Nolan 1984). The X-ray flux varies on all timescales down to a few milliseconds, and the power density spectrum (PDS) can be characterized by a flat component with a low-frequency cutoff in the range of 0.04-0.4 Hz (van der Klis 1995 for a review). An additional steepening of the PDS above 10 Hz was also detected (Belloni & Hasinger 1990). Cyg X-1 has only occasionally been observed in the high (or soft) state (see reviews by Oda 1977 and Liang & Nolan 1984), and is not well studied in such state. In the high state, the power-law photon index varies significantly between 2.6-4.2 below 10 keV (Oda 1977), and mildly between 1.6-2.3 above 10 keV (Liang & Nolan 1984), while it remains in the range of 1.3-2.3 (above and below 10 keV) in the low state. Therefore, it seems as if the hard power-law component exists in both high and low states, but the low energy ( keV) spectrum becomes much softer in the high state. No PDS has been reported for Cyg X-1 in the high state ( van der Klis 1995).
In this Letter, we present the results from the observations of Cyg X-1 in its high state by the Rossi X-ray Timing Explorer (RXTE; Bradt, Rothschild, & Swank 1993).
The ASM (Levine et al. 1996) light curve of Cyg X-1 revealed that it started a transition from the low state to the high state on 1996 May 10 (Cui 1996; Fig. 1a). During the transition, the soft X-ray flux (1.3-12 keV) increased by roughly a factor of 4, and the ASM hardness ratio, defined as the ratio of the 3-12 keV count rate to that in the 1.3-3 keV band, shows a steady trend of spectral softening (see Fig. 1b). This trend extends to higher energies. BATSE observations revealed about a factor of 2 decrease in the 20-100 keV flux (Zhang et al. 1996a; Fig. 1c). An anti-correlation between the soft (ASM) and hard (BATSE) X-ray fluxes during the transition, which was observed previously (Dolan et al. 1977; Ling et al. 1987), was firmly established.
Upon the discovery, a series of public Target-of-Opportunity observations with RXTE were carried out to monitor the temporal and spectral variability in the high state. As of 7/15/96, 12 brief pointed observations of Cyg X-1 have been made with RXTE. Here we concentrate on the first 4 observations. Table 1 summarizes the observation time and durations.
The RXTE mission is optimized for observing fast X-ray variability in a broad energy range. For the first time, timing resolution is achieved for both the PCA and HEXTE instruments (Bradt, Rothschild, & Swank 1993), which share a common field-of-view (FWHM). The PCA has a collecting area of about 6500 and covers an energy range from 2 to 60 keV with moderate energy resolution ( at 6 keV). The HEXTE has a total effective area of about 1600 in two clusters. It covers a wide energy range from about 15 to 250 keV with an energy resolution of at 60 keV.
2 Spectral Analysis
We have taken a conservative approach to spectral modelling, since the instrument calibration is still preliminary. Due to the high intensity of Cyg X-1, we have used earth-occultation data to estimate the total PCA background. This is adequate because the diffuse X-ray background contributes less than 1% of the source flux below 20 keV, where systematic uncertainties are dominant, and is negligible compared to the instrument background above 20 keV (Jahoda et al. 1996). A 2% systematic uncertainity has been added to the PCA data to represent uncertainties in the response matrix calibration.
Background-subtraction is straightforward for the HEXTE data because the two clusters in HEXTE alternately rock on and off source to provide nearly simultaneous background measurement. However, unmeasured deadtime effects due to large energy losses from charged particles are significant, so we allowed the relative normalization between the PCA and HEXTE to vary during the spectral fitting. We then verified that the resulting relative normalizations were consistent with what we expected from the magnitude of the known deadtime deficit.
The observed X-ray spectrum can be described by a model consisting of a soft blackbody component and a broken power-law with a high energy cutoff. The best-fit model parameters are listed in Table 2. The uncertainties shown represent 90% confidence intervals. Note that, due to the coupling between the two spectral components at low energies, we derived the uncertainty for the blackbody temperature first, froze it, and then derived the uncertainties for other parameters. The derived value is about 20 times larger higher than the interstellar value () (Bałucińska & Hasinger 1991). This could be due to large internal absorption by matter in the binary system. The stellar wind from the supergiant companion may be responsible for providing a large amount of intervening material. However, since we only see the tail of the blackbody spectrum in the PCA energy band, this result can be quite uncertain due to systematic uncertainties at the lowest energies. The spectrum was fit again with fixed at the interstellar value, and the results are also shown in Table 2 for comparison. The blackbody component is either not needed or very insignificant in each of the 4 cases although these fits have consistently higher .
Fortunately, Cyg X-1 was also observed by ASCA at about the same time as the third RXTE observation (Dotani et al. 1996). The ASCA spectrum was modelled with a soft blackbody component of temperature keV and a power-law with a photon index of (Dotani et al. 1996). Their best-fit value is (Negoro 1996). These results agree with ours (in the case of low ) reasonably well (see Table 2).
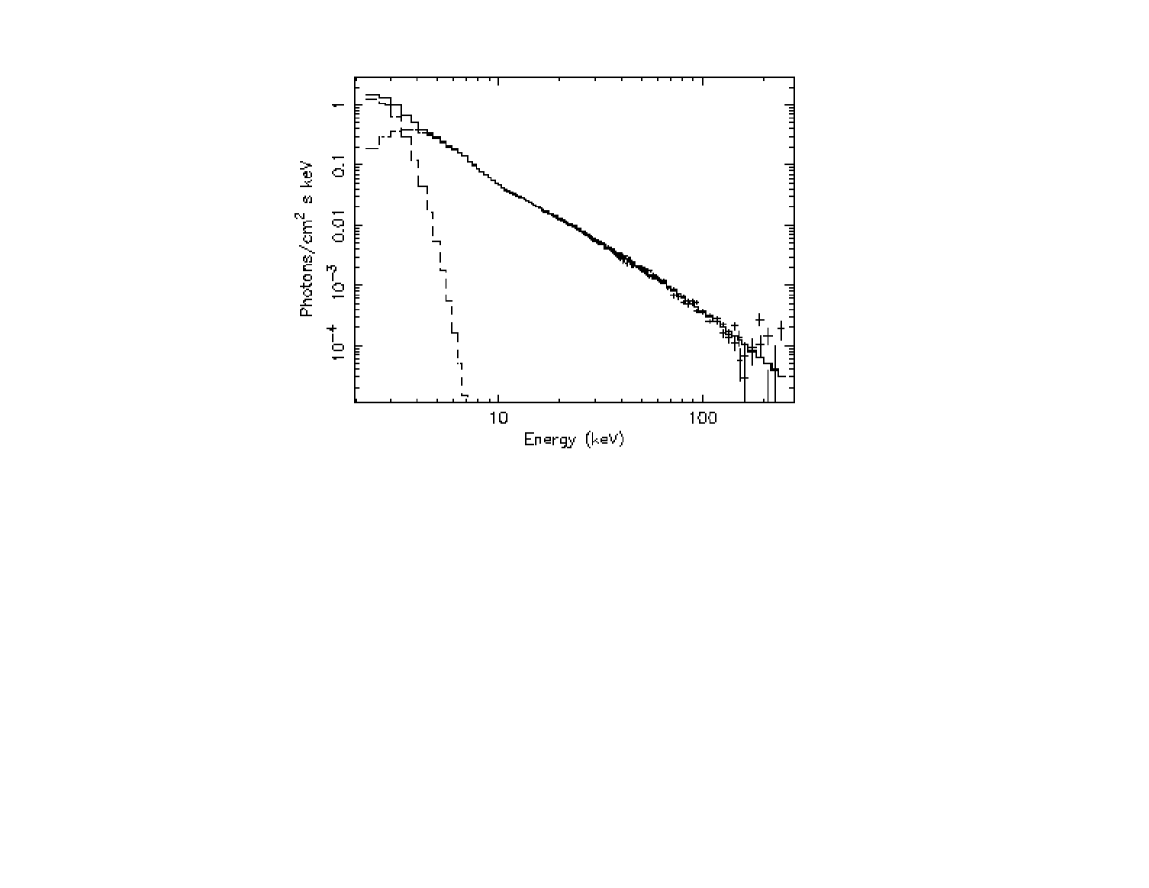
The results in Table 2 show that the low energy X-ray spectrum (i.e., ) varies significantly in the high state on a timescale of days. Above the break energy (11 keV) the spectral shape changes little. As an example, Fig. 2 shows a combined PCA/HEXTE photon spectrum for the first observation.
3 Timing analysis
From each of 4 PCA observations we chose a contiguous stretch of data 2048 (or 4096) seconds long, and generated a PDS in 3 energy bands: 2-6.5 keV, 6.5-13.1 keV, and 13.1-60 keV. The results were then logarithmically rebinned to reduce scatter at high frequencies. The resulting spectra are shown in Fig. 3. The fractional rms amplitude squared is defined as Leahy normalized power (with Poisson noise power subtracted) divided by the mean source count rate ( van der Klis 1995). The PDS’s have also been corrected for instrumental artifacts due to electronic deadtime and very high energy events (Zhang et al. 1996d). The PDS shows roughly the same shape in different energy bands for a given observation.
In the second observation, the energy spectrum was seen to be the hardest. At this time, the PDS can be characterized by a red noise component with a characteristic shape of 1/f at low frequencies (less than about 15 mHz), followed by a white noise component that extends to about 1 Hz, above which it is cut off. At higher frequencies, the PDS becomes power-law again, with a slope of roughly -2, i.e., “”. A broad peak is detected at about 3.6 Hz, and might be due to quasi-periodic oscillations. When the energy spectrum is softer in the first and third observations, the 1/f noise is more significant, and another feature at around 9 Hz becomes apparent. Therefore, the PDS shows interesting spectral dependence: the 1/f component becomes more prominent when the low energy spectrum becomes softer. The PDS is eventually dominated by the 1/f noise in the fourth observation when the energy spectrum is the softest. Similar spectral dependence of the PDS was also observed in another BHC, Nova Muscae 1991 (Miyamoto 1995), and maybe common in BHCs. In the last observation, the broad peaks at 3.6 and 9 Hz disappeared, but a fit to the PDS with a broken power-law reveals another broad feature that centers at 6 Hz.
4 Discussion
We interpret the soft blackbody component as the emission from a geometrically thin, optically thick cool accretion disk. The soft X-ray photons are Compton upscattered by a geometrically thick, optically thin corona surrounding the disk to produce the observed hard X-ray emission (Liang & Nolan 1984, and references therein). Then the spectrum can be approximated by a thermal component around the blackbody temperature, a power-law () at energies just above, and a flatter power-law component () at still higher energies before being cut off beyond , where is the electron temperature of the corona (Liang & Nolan 1984, and also see discussion by Ebisawa et al. 1996). However, the observed high energy cutoff is so gradual that models with a single electron temperature (e.g., Sunyeav & Titarchuk 1980) fail to fit the high energy portion of the spectrum. This slow high energy cutoff can be explained by invoking a stratified hot electron corona (Skibo & Dermer 1995). A similar low-energy spectral shape was observed in the low state by ASCA (Ebisawa et al. 1996). In their case, the soft blackbody component had a lower temperature ( keV), and the broken power-law was flatter ( and ), with a lower break energy ( keV).
In the high state the observed PDS shows a distinct 1/f component at low frequencies, which was not seen in the low state. This component may be due to the superposition of random accretion “shots” with long lifetimes (see discussion by Belloni & Hasinger 1990). Theoretical models have been proposed to associate these shots with instabilities in the accretion disk (e.g., Mineshige et al. 1994). Perhaps, the 1/f noise increases its power when the mass accretion rate is higher, which would explain why it was not observed in the low state (presumably with a lower accretion rate). Its dominance in the fourth observation seems to support this, although there is indication that the bolometric luminosity changes little going from the low state to the high state (Zhang et al. 1996c). The fourth observation may mark the start of the “true” high state, which is characterized by the soft energy spectrum and dominant 1/f noise, following a “settling period”. This is supported by the results from subsequent observations (Cui, Focke, & Swank 1996). Similar power-law PDS’s were observed in soft X-ray transient BHCs, Nova Muscae 1991 (Miyamoto 1995) and Nova Sco 1994 ( Zhang et al. 1996b), in their outburst states, and may be common among BHCs in their high states.
The white noise (or flat) component has been seen in both high and low states. It may be due to statistical fluctuations in the mass accretion stream near the inner edge of the accretion disk where dynamical timescale is very short (compared to the frequency range that has been covered), similar to the “shot noise” in many electronic systems (van der Ziel 1986). The hot corona in the system can act as a low-pass filter that cuts off the white noise at some characteristic frequency to produce the observed “flat-top” PDS shape. In this model, the cutoff frequency is determined by the characteristic photon escape time. Then, the higher cutoff frequency observed in the high state (1 Hz, compared to 0.1 Hz in the low state) can be explained by a smaller corona due to more efficient local cooling provided by a higher mass accretion rate. Because the corona is smaller in the high state, the number of scatterings that an X-ray photon experiences is, on average, less, therefore the emerging hard X-ray spectrum is softer, which agrees qualitatively with the observations. In the fourth observation, the white noise becomes negligible compared to the 1/f noise, and the observed PDS shape is consistent with the 1/f noise being cutoff at around 16 Hz (thus becoming at higher frequencies). Therefore the corona seems to be even smaller in this case, which would explain the softest energy spectrum among all observations (see Table 2).
What is the origin of the broad PDS peaks detected between 3-9 Hz? Similar features are often seen on the noise spectra of solid state devices. They are thought to be produced by a charge generation and recombination process due to the existence of impurities in semi-conductor material (van der Ziel 1986). In this case, the noise spectra are characterized by a flat component below a characteristic frequency and a power-law shape of above, which is the same as that of exponential accretion “shots” (Belloni & Hasinger 1990). Similar processes might be involved in mass accretion due to shocks and turbulences in the accretion disk that disrupt the flow. As a result, the lifetime distribution of the accretion shots may not be random, but limited to certain values due to activation or some other critical conditions (e.g., Mineshige et al. 1994) in such processes. It seems more likely, however, that the these features are related to resonances in the fluctuating corona because they appears to be more prominent at higher energies.
Note added in manuscript: after we submitted this paper, we became aware of another paper submitted at about the same time by Belloni et al. (1996) which is based on some of the same data presented here. We have independently reached at some similar conclusions. For example, their proposed “intermediate state” is similar to our “settling period”.
| Live Time (s) | |||
|---|---|---|---|
| No. | Observation Time (UT) | PCA | HEXTE11Both clusters are included. |
| 1 | 5/22/96 17:44:00-19:48:00 | 4208 | 1312 |
| 2 | 5/23/96 14:13:00-18:07:00 | 7936 | 5839 |
| 3 | 5/30/96 07:46:00-08:44:00 | 2384 | 2113 |
| 4 | 6/4/96 20:21:00-21:42:00 | 3280 | 2415 |
| blackbody | broken power-law11 and are soft and hard power-law photon indices, respectively, and is the break energy. | high-energy cutoff22 is the cutoff energy, and the e-folding energy. | ||||||||
|---|---|---|---|---|---|---|---|---|---|---|
| No. | 33H I column density along the line-of-sight. | Flux44The observed 2-10 keV flux (in units of ). | f55The observed fractional 2-10 keV flux from the blackbody component. | |||||||
| () | (keV) | (keV) | (keV) | (keV) | % | |||||
| 1 | ||||||||||
| (fixed) | ||||||||||
| 2 | ||||||||||
| (fixed) | ||||||||||
| 3 | ||||||||||
| (fixed) | ||||||||||
| 4 | ||||||||||
| (fixed) | ||||||||||
References
- (1) Bałucińska, M., & Hasinger, G. 1991, A&A, 241, 439
- (2) Belloni, T. & Hasinger, G. 1990, A&A, 227, L33
- (3) Belloni, T., et al. 1996, ApJ, submitted
- (4) Bradt, H. V., Rothschild, R. E., & Swank, J. H. 1993, A&AS, 97, 355
- (5) Cui, W. 1996, IAU Circ. 6404
- (6) Cui, W., Focke, W., & Swank, J. 1996, IAU Circ. 6439
- (7) Dolan, J. F., Crannell, C. J., Dennis, B. R., Frost, K. J., & Orwig, L. E. 1977, Nature, 267, 813
- (8) Dotani, T., Negoro, H., Mitsuda, K., Inoue, H., and Nagase, F. 1996, IAU Circ. 6415
- (9) Ebisawa, K., Ueda, Y., Inoue, H., Tanaka, Y., & White, N. E. 1996, ApJ, 459
- (10) Jahoda, K., et al. 1996, Proc. SPIE 2808, submitted
- (11) Ling, J. C., Mahoney, W. A., Wheaton, W. A., & Jacobson, A. S. 1987, ApJ, 321, L117
- (12) Levine, A., et al. 1996, ApJ, 469, L33
- (13) Liang, E. P., & Nolan, P. L. 1984, Space Sci. Rev., 38, 353
- (14) Miyamoto, S., et al. 1989, Nature, 336, 450
- (15) Miyamoto, S. 1995, in Proceedings of the IIAS workshop on mathematical approach to fluctuation, ed. T. Hida (Kyoto, Japan), vol. 2
- (16) Mineshige, S., Takeuchi, M, & Nishimori, H. 1994, ApJ, 435, L125
- (17) Negoro, H. 1996, private communication
- (18) Oda, M. 1977, Space Sci. Rev., 20, 757
- (19) Skibo, J. G., & Dermer, C. D. 1995, ApJ, 455, L25
- (20) Sunyeav, R. A., & Titarchuk, L. G. 1980, A&A, 86, 121
- (21) Tanaka, Y., & Lewin, W. H. G. 1995, in “X-ray Binaries”, eds. W. H. G. Lewin, J. van Paradijs, & E. P. J. van den Heuvel (Cambridge U. Press, Cambridge) p. 126
- (22) van der Klis, M. 1995, in “X-ray Binaries”, eds. W. H. G. Lewin, J. van Paradijs, & E. P. J. van den Heuvel (Cambridge U. Press, Cambridge) p. 252
- (23) van der Ziel, A. 1986, Noise in Solid State Devices and Circuits (New York: Wiley-Interscience)
- (24) Zhang, S. N., Harmon, B. A., Paciesas, W. S., & Fishman, G. J., 1996a, IAU Circ. 6405
- (25) Zhang, S. N., et al. 1996b, Nature, submitted
- (26) Zhang, S. N., et al. 1996c, ApJ, in preparation
- (27) Zhang, W., et al. 1996d, ApJ, 469, L29