02(08.12.2; 10.07.2; 10.08.1; 12.04.1) 11institutetext: Observatoire de Strasbourg, 11 Rue de l’Université, F-67000 Strasbourg, France. \offprintskerins@wirtz.u-strasbg.fr
Zero-metallicity very low mass stars as halo dark matter
Abstract
Hubble Space Telescope (HST) limits on the amount of halo dark matter (DM) in the form of very low-mass (VLM) stars close to the hydrogen-burning limit have been interpreted as excluding such stars as viable candidates. However, these limits assume that the stars are smoothly distributed and have at least the metallicity of Population II stars, whilst some baryonic DM formation theories predict that they may instead be clumped into globular-cluster configurations and have close to zero metallicity. I re-analyse the HST data employing the zero-metallicity VLM star models of Saumon et al. (1994), which predict colours below the cuts of previous analyses for stars below . From the models I derive new limits on the allowed halo fraction comprising VLM stars for both the unclustered and clustered cases. In the unclustered regime I find a 95% confidence upper limit on the allowed halo fraction of 1.4% inferred from 20 HST fields, comparable to limits derived by previous studies for non-zero metallicity populations. In the cluster scenario I show that clusters of mass and radius can satisfy both HST and the recent MACHO gravitational microlensing results, which indicate a lens halo fraction of 40% for a standard halo model, provided pc. However, existing dynamical limits restrict the allowed range to a tiny region characterised by and pc. Furthermore, consistency between MACHO and HST demands a present-day clustering efficiency of 92% or better. Intriguingly however, the cluster mass implied by these limits is theoretically well motivated and the VLM star scenario may also help to provide an explanation for the faint red ‘halo’ light recently reported around another galaxy.
keywords:
stars: low-mass, brown dwarfs – globular clusters: general – Galaxy: halo – dark matter1 Introduction
Recent advances in attempts to detect or constrain the nature of dark matter (DM) in the halo of our Galaxy have led to a variety of constraints on both baryonic and non-baryonic candidates (Carr [1994]; Jungman et al. [1996]).
The microlensing rate observed by the MACHO collaboration (Alcock et al. [1997]) towards the Large Magellanic Cloud (LMC) indicates that the likely halo DM fraction in compact form is around 40%, and comprises objects in the mass range , though the inferred fraction and mass range are sensitive to the assumed halo distribution function. This therefore suggests that the halo may comprise a roughly equal mixture of baryonic and non-baryonic matter, though there are non-baryonic candidates, such as primordial black holes and shadow matter, which can also explain the microlensing events. In any case, the MACHO results imply that no single candidate, baryonic or non-baryonic, can explain all of the halo DM unless the halo distribution function departs significantly from the usual assumption of an isothermal sphere.
If the DM responsible for the observed microlensing is baryonic then the inferred mass range implicates either white-dwarf remnants of an early generation of stars or very low-mass (VLM) stars close to the hydrogen-burning limit. However, in our Galaxy the number density of halo white dwarfs is strongly constrained by the present-day helium and metal abundances of the interstellar medium (Carr et al. [1984]; Ryu et al. [1990]; Adams & Laughlin [1996]) and, assuming the white dwarfs are younger than 18 Gyr, by number counts of high-velocity white dwarfs (Chabrier et al. [1996]). Counts of high-redshift galaxies also appear to rule out white dwarfs from contributing significantly to halo DM in other galaxies (Charlot & Silk [1995]).
VLM stars are currently even less favoured since photometric surveys appear to place even stronger limits on their contribution (e.g. Gilmore & Hewett [1983]; Richstone et al. [1992]; Bahcall et al. [1994], hereafter BFGK; Graff & Freese [1996], hereafter GF; Flynn et al. [1996]). The latest MACHO results also appear to argue against most of the DM comprising sub hydrogen-burning brown dwarfs unless the DM is distributed more like a maximal disc, in which case any halo must have a very low total mass interior to the LMC in order to remain consistent with local surface-density and rotation-curve constraints. Within the context of standard halo models therefore, there is great difficulty in explaining the high halo fraction detected by MACHO by invoking a single baryonic candidate.
In this paper I re-examine the VLM star hypothesis for the case where the stars have zero-metallicity, as may be the case if the halo is formed from primordial matter. In this case their colours will be different than assumed by previous studies, so constraints from these studies need not necessarily apply to zero-metallicity stars. I also examine the possibility of DM clustering, and how that effects number counts and microlensing statistics. Such clustering is predicted by some DM formation theories.
The plan of the paper is as follows: Sect. 2 calculates the space density constraints for a smoothly distributed population of zero-metallicity VLM stars imposed by number counts from 20 of the 22 HST fields obtained by BFGK. These calculations adopt the latest numerical predictions for zero-metallicity VLM star photometry. It will be shown that the limits on such a population are comparable to those for populations of non-zero metallicity, with the allowed halo fraction being at most 1.4%. Section 3 extends the analysis to include the effect of clustering and, using a combination of the HST number-count limits, MACHO observations and dynamical constraints on the permitted mass and radius of clusters, places upper limits on the cluster space density. It will be shown that whilst dynamical constraints strongly limit the allowed mass and radius of clusters, they nonetheless permit a cluster DM fraction which can simultaneously explain the MACHO and HST observations, though both the required mass and radius need to be finely tuned (, pc). I further show that the microlensing signatures of these clusters are essentially indistinguishable from the unclustered scenario, and in particular are not expected to modify the inferred halo fraction. Finally in this section, I use the halo DM fraction inferred by MACHO to compute the efficiency with which VLM stars must be clustered in order to remain compatible with HST observations. The required efficiency, better than 92% at the present day, places the strongest demand on the scenario. The main findings of the paper are discussed in Sect. 4.
2 Limits on zero-metallicity VLM stars
Saumon et al. ([1994]) have computed a grid of fully non-gray atmospheric models for zero-metallicity () VLM stars and brown dwarfs in the mass range . Their calculations take account of all the major sources of opacity for a pure H+He mixture including H2, H and H-, as well as other sources tabulated by Lenzuni et al. ([1991]). The resulting spectral energy distributions are found to deviate significantly from blackbody below an effective temperature of 4 000 K. Saumon et al. also present predictions for the photometry of VLM stars () from through to bands which show that these stars would appear significantly bluer than stars with metallicity comparable to that measured for the Galactic spheroid () or disc () populations.
In particular, Saumon et al. find that the expected colour for zero-metallicity VLM stars ranges between 1.27 for 0.2- stars to 1.57 at the hydrogen-burning limit (). This is somewhat below the threshold values assumed by BFGK, GF and Flynn et al. ([1996]) in their analyses, whose inferences are based on the number counts of stars with . Whilst one can not say for sure whether any dark halo population has a metallicity substantially less than that of the spheroid, there is clearly a need to re-examine the HST data using the zero-metallicity predictions of Saumon et al. in order to close up this last remaining ‘loophole’.
The positions of the 22 HST fields are tabulated in Gould et al. ([1996]), along with the corresponding minimum and maximum -band magnitudes for each field. (All selections were performed in the band.) Note that two locations (, and , ) each have 2 fields in very close proximity.
The limiting maximum -band magnitude, which determines the maximum distance out to which a VLM star will be seen, ranges from 22.56 to 24.40 and is determined for each field according to the ability to discriminate clearly between stellar and extended sources. The minimum -band magnitude ranges from 17.05 to 19.45 and sets the minimum distance at which the stars can be satisfactorily imaged. Objects with magnitudes below this limit produce saturated images. It should be noted that BFGK calculate the -band magnitude limits from the HST band (F814W filter) assuming the stellar spectral energy distributions listed by Gunn & Stryker ([1983]). They therefore do not strictly apply to VLM stars, though any differences in calibration will be small and are therefore neglected here.
In computing the minimum and maximum observable distances for each VLM star mass, and for each field, I follow Gould et al. ([1996]) in converting the -band extinction values determined by Burstein & Heiles ([1982]) to -band reddenings. The extinction is assumed to be confined to a disc of thickness pc. Within this disc the extinction per unit distance is taken to be uniform.
The halo mass within the volume defined by the minimum and maximum distances , , and the solid angle per field sr, is calculated assuming a spherically-symmetric softened isothermal halo density distribution of the form
| (1) |
where is the distance measured along the observer’s line of sight, and are Galactic coordinates, kpc is the Sun’s Galactocentric distance, is taken to be the local DM density normalisation and kpc is the assumed halo core radius. For the small solid angles considered here, this gives an integrated halo mass between and for field of
| (2) |
The integral can be performed analytically though the resulting expression is long.
Note that the integral limits in Eq. 2 are implicit functions of the VLM star mass . If one assumes that VLM stars have masses then a lower limit on the expected number of detectable VLM stars is
| (3) | |||||
for independent fields. The direction of the inequality reflects the fact that the dependency of on is steeper than the first power of . Fields 1 and 19, using the order in which they are listed in Tab. 1 of Gould et al. ([1996]), are discarded in this analysis because of their close proximity to fields 2 and 20, respectively. Whilst fields 1 and 2 do not actually overlap, field 1 is nonetheless excluded here to provide consistency with the cluster analysis of Sect. 3.2, where statistical independency of neighbouring fields is an important criteria. is therefore summed over rather than 22 fields.
The median value for is found to range from 330 pc for 0.092- stars up to 1 kpc for 0.2- stars. For the median values are 3.3 kpc and 10.1 kpc for 0.092- and 0.2- stars, respectively.
Applying Eq. 3 to VLM stars at the hydrogen-burning limit mass of , one finds an expectation number of stars in the HST fields of 6 310, and for 0.2- objects the expectation is nearly an order of magnitude larger at 60 100 stars. These numbers take account of the fact that data from one-third of field 4 (i.e. data from one of the three detector chips) had to be discarded by Gould et al. ([1996]) due to problems with receiving the data from HST, and that as much as 2% of each of the fields was discarded due to emission from background galaxies. The number of stars detected in the 20 fields with values in the range 1.2 to 1.7, spanning the range predicted by Saumon et al. ([1994]), is only 75. The 95% confidence level (CL) upper limit on the average, for a realisation of 75 stars, is 91. Therefore, even if one assumes that all of the stars detected by HST are halo VLM stars right on the hydrogen-burning limit, their contribution to the halo DM can be no more than 1.4% at the 95% CL, and the limit is correspondingly stronger than this for more massive objects. In fact it is likely that a significant fraction of these objects may belong to the disc or spheroid.
The limit of 1.4% is stronger than that inferred by BFGK for solar-metallicity VLM stars from their analysis of one of the HST fields. Their results translate to a 95% CL upper limit of less than 4% for stars with , adopting . The 95% upper limit inferred by GF for low-metallicity stars with corresponds to a halo fraction of less than 0.9% for the same field. However, both of these studies exclude from their analyses stars with , so the limits presented here, which are derived from 20 fields, constitute a completely independent check on previous results. The conclusion is that, regardless of their metallicity, VLM stars do not contribute significantly to the halo DM, at least under the assumption that they are smoothly distributed in the halo.
3 VLM star clusters
3.1 Rationale
The rationale for invoking clustered DM comes from a number of considerations. Firstly, visible globular clusters are observed out to great distances from the Galactic centre suggesting they may have an important role in halo formation, though they are identified with the spheroid population. Secondly, some of the most promising theories for the formation of large amounts of compact halo baryonic DM (Ashman [1990]; De Paolis et al. [1995]) predict that the DM should be clustered into dark globular clusters with a typical mass of around (Ashman [1990]). These theories predict that the clusters should comprise either brown dwarfs or VLM stars, due to high gas pressures suppressing the minimum fragmentation mass. They also explain the typical mass and spatial distribution of the visible cluster population since the theories are extensions of the Fall-Rees theory of globular-cluster formation (Fall & Rees [1985]). The baryon Jeans mass at the cosmological epoch of recombination is , which is also close to for a cosmological density of order unity and a baryon density satisfying cosmological nucleosynthetic constraints: , where is the Hubble constant in units of 100 km s-1 Mpc-1 (Krauss [1995]). Lastly, limits on the space density of clusters provide firm upper limits on the allowed space density of VLM stars, provided one assumes that the VLM star distribution follows the halo density on the large-scale average (i.e. scales larger than the typical cluster separation).
The effect that clustering can have on number-count statistics is well illustrated by considering the expectation distances both to the nearest unclustered VLM star and to the nearest cluster. Let us assume that VLM stars contribute some fraction to the halo DM and that their density is everywhere , where is given by Eq. 1. Let us also take the fraction of VLM stars residing in clusters to be everywhere , so that the fraction of unclustered VLM stars is correspondingly . Then, for VLM stars with mass , the local unclustered number density is
| (4) | |||||
whilst the local number density of VLM star clusters of mass is
| (5) | |||||
The expectation value for the distance to the nearest object appearing within a survey of solid angle , assuming a local number density , is (c.f. Kerins & Carr [1994])
| (6) | |||||
where is the gamma function. So, using Eq. 4 and Eq. 5, the expectation distances to the nearest unclustered VLM star and star cluster are, respectively,
| (7) | |||||
| (8) | |||||
where is normalised to a solid angle 20 times that of a single HST field.
The large value for indicates the need to consider the variation of along the line of sight in order to obtain a more accurate answer, though the estimate of Eq. 8 is sufficient to show that one might not see any clusters at all within the HST fields, even if they comprise all the halo DM. Additionally, the expected fluctuation in source counts from field to field will be governed by the number density of clusters and not the spatially-averaged density of the stars themselves. This problem is addressed in the next subsection where I calculate 95% CL lower limits on the expected cluster number density, which in turn provide 95% CL upper limits on the contribution of VLM stars to the halo DM.
Another important consideration is whether one expects HST to be able to resolve individual stars within clusters. Since BFGK filter their observations to search for only stellar-like sources it is conceivable that a significant fraction of the total number of possible VLM star sources have been discarded because they reside in the cores of unresolvable clusters. Since the number of field galaxies far exceeds the number of stars at the typical limiting magnitudes of the HST fields, it may prove extremely difficult to analyse these fields for the presence of unresolved cluster cores.
Using Eq. 8 as a lower limit on the cluster distance one finds a typical angular separation between neighbouring stars (as projected along the line of sight) for a cluster with radius of
| (9) | |||||
compared to a HST pixel resolution of 0.1 arcsec. Since one expects clusters to be centrally concentrated one anticipates Eq. 9 overestimating the angular separation of stars near the core and underestimating the separation near the cluster edge. Therefore it seems that a significant fraction of cluster sources may appear unresolved. This fraction will be assessed more rigorously in Sect. 3.3.
For the cluster scenario to be viable it must be consistent with existing dynamical constraints on such objects. These constraints, which are reviewed in Sect. 3.4, provide upper and lower bounds to both the permitted cluster mass and radius. The maximum contribution of such clusters to the halo is therefore also potentially bounded by these constraints.
Finally, in Sect. 3.5, I show that this scenario is compatible with MACHO microlensing observations, and I use the MACHO limit on the contribution of VLM stars to compute the allowed ratio of clustered to unclustered stars. Potentially, this ratio provides the strongest constraint on the cluster scenario.
3.2 Space density of VLM clusters
In Sect. 2 limits were placed on the space density of unclustered VLM stars from HST number counts, assuming the stellar distribution obeys Poisson statistics. However, since clusters are extended objects, one can not directly apply the same assumption to them, since one may have a cluster which is only partially within the field of view (in fact this will be the case generally for the HST fields due to their small solid angle).
However one can use Poisson statistics to assess the likely number of cluster centres within the field of view. One can therefore extend this idea by imagining a volume centred on the actual field volume, but whose radius of cross section along the length is always larger by an amount (the cluster radius) and whose length is also larger by an amount at either end (i.e. by an amount overall). Limits on the number of cluster centres appearing within this larger volume necessarily correspond to limits on the number of clusters which appear either wholly or partially within the actual survey field volume.
The description above applies to a cylindrical survey volume (i.e. a circular field of view). The size of the larger volume and number-count limits derived from it are sensitive to the geometry of the field volume on which it is centred (i.e. the shape of the field of view), which for the HST is ‘L’-shaped rather than circular. However, for most of the cluster radii considered in this paper their angular sizes are always much larger than the angular size of the field of view itself, so the sensitivity to the shape of the field of view is generally very small, and so for simplicity I assume a cylindrical field volume geometry throughout.
Another important consideration when placing limits on cluster number densities is the statistical dependency of neighbouring fields. In principle, sufficiently large clusters could appear in more than one field and so any limits would need to take such correlations into account. Even if one is placing limits based on the absence of clusters within the observed fields one still needs to consider this problem. One can see why by considering two neighbouring fields which are separated by less than a cluster diameter. The prescription above would oversample the actual volume of space required to place limits on the cluster density (i.e. there would be a volume of space which would be common to the periphery of both fields and would therefore be counted twice), resulting in an overestimate of the expected number of clusters. As mentioned in Sect. 2, fields 1 and 2, whilst not overlapping, are nonetheless too close for most of the cluster radii considered here and so field 1, which samples a smaller amount of halo mass than field 2 (using Eq. 2), is discarded. Similarly, field 19, which partially overlaps with field 20, is also discarded leaving fields. For these remaining fields the spatial separation between nearest-neighbours ranges from pc for clusters comprising 0.2- VLM stars (with a median separation of 340 pc), and from pc for clusters comprising 0.092- stars (with a median value of 110 pc). The statistical dependency of neighbouring fields therefore only becomes important for the very largest cluster radii considered in this section. I therefore ignore such correlations and assume the fields to be statistically independent.
A lower limit on the expectation number of clusters with mass and radius , comprising VLM stars of mass , which either wholly or partially appear within the HST fields is (c.f. Eq. 3)
| (10) |
where
Note that for , in Eq. 2, as required.
If one assumes that the HST fields contain no cluster stars at all then the 95% CL upper limit on the allowed halo fraction is ; 3 being the 95% CL upper limit on the true average number of clusters when none are seen, assuming statistical independency of neighbouring fields and Poisson statistics. Note from Eq. 10 that the upper limit is independent of since it represents a limit on the absolute number of clusters. If is significantly less than unity stronger constraints on the VLM density will come from the limits obtained in Sect. 2 for unclustered VLM stars. This issue is considered in more detail in Sect. 3.5 where I consider the efficiency with which VLM stars need to be clustered.

The limits on for a range of cluster masses and radii are shown in Fig. 1, assuming . The solid grid depicts the limits assuming the clusters comprise VLM stars of mass , where as the dotted line shows the limits for clusters comprising hydrogen-burning limit stars (). The choice of cluster parameters is guided by the dynamical considerations discussed in Sect. 3.4. The plane at is shown to guide the eye in seeing which part of the parameter space is constrained and which is not. The most strongly constrained region occurs for low cluster masses and large radii, though combinations of cluster parameters for which (where is the average halo density within the survey volumes) are unphysical since they denote clusters whose average density is less than that of the local halo background. (Such ‘clusters’ might instead best be regarded as voids.) For interesting (i.e. significant) values of and this unphysical region includes the case where the average angular separation between neighbouring stars, given by Eq. 9, exceeds the HST field of view. Whilst HST provides strong limits on clusters of low mass and large radius, it is clear from the figure that a significant fraction of the parameter space is not constrained by HST observations.
It is apparent from Fig. 1 that the relationship between and is linear, which is simply a consequence of the fact that from Eq. 10. Whilst the relationship between and is not a simple power law one can crudely approximate the condition for which can exceed 1 as
| (12) |
where for 0.2- stars pc and , and for 0.092- stars pc and . If instead of providing all of the halo DM one merely requires that clusters provide at least 40% of the DM, the halo fraction indicated by the MACHO experiment for a local halo normalisation (Alcock et al. [1997]), then one requires pc and for 0.2- stars, or pc and for hydrogen-burning limit stars. These inequalities should be compared to the requirement noted above that clusters must represent local density enhancements rather than decrements, which requires
| (13) |
The limit should also be compared to the dynamical constraints to be discussed in Sect. 3.4.
It is important to note that these limits are fairly insensitive to the actual number of VLM stars observed in the HST fields, provided the observed number is relatively small (e.g. ). This is because if even just a portion of one cluster enters one of the fields of view one would generally expect HST to detect hundreds or even thousands of stars in that field due to the high cluster surface density. For the same reason these limits are also relatively insensitive to the surface-density profile of the cluster, at least within the range of reasonable surface-density profiles (i.e. similar to those inferred from the surface-brightness profiles of visible clusters).
3.3 The question of resolvability
The previous subsection dealt with limits imposed from the absence of clusters within the HST fields. However, compact clusters can escape detection even if they do appear in the fields, provided their surface densities are sufficiently high as not to allow them to be resolved, or provided the total surface density through all clusters along the line of sight is sufficiently large. The rigorous point-source selection criteria of BFGK means that any unresolved portions of clusters are discarded, in which case only some fraction is detectable. Thus the effective number of detectable clusters is , which implies that the effective allowed halo fraction is , where denotes averaging over fields. Thus if for a particular set of cluster parameters then HST point-source counts do not place any limits on the allowed halo fraction in such clusters.
The effect on resolvability due to several clusters aligned along the line of sight can be estimated from the ratio of the average cluster surface density to that between and :
| (14) |
Assuming the distribution of clusters on the sky is Poissonian, their sky-covering factor is . Therefore the surface density measured along a line of sight through a cluster will be enhanced over that expected for the single cluster alone by a factor which is on average
| (15) |
The median line-of-sight surface density between and for the 20 HST fields is for 0.092- stars and for 0.2- stars, corresponding to values for of 1.45 and 2.34, respectively, assuming - clusters with a 10-pc radius and .
The resolvable fraction of an individual cluster is sensitive to its assumed surface-density profile, as well as its mass and radius and the distance at which it is expected to be observed. I assume here that the cluster surface density follows the surface-brightness profile of many observed globular clusters, which are well described by the King ([1962]) surface-brightness law. Thus the surface number density as a function of cluster-centric radius is assumed to be given by
| (16) |
where denotes the central surface density and is the projected cluster core radius. Since the integrated mass of the cluster must be the central surface density is
| (17) |
where . For the purpose of simplification I adopt for all clusters, a value which is typical for visible clusters, though in reality there is a large dispersion about this value.
Clusters appear resolved in the HST fields provided is less than
| (18) | |||||
where arcsec for the HST. If then one expects that at least some of the cluster is unresolvable. From Eq. 16 to 18, the mass fraction of a cluster at distance which can be resolved is
| (19) | |||||
if or unity otherwise. Note the factor from Eq. 15, which enters in the upper integral limit. This is because, as argued above, one expects the observed line-of-sight density to be , rather than just .
Thus, for HST field , the expectation value for the resolvable fraction of clusters is
| (20) |
where is given by Eq. 1. Hence, the effective number of detectable clusters within the fields is given by Eq. 10 with .
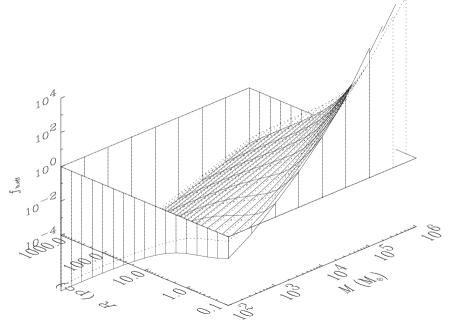
Figure 2 shows the upper limits on the effective halo fraction , assuming . Unlike the plot in Fig. 1, the surface does not strictly represent a 95% CL constraint, since for that one would need to evaluate the joint 95% CL variation in the cluster number and in the resolvable fraction . Such an evaluation would require detailed Monte-Carlo simulations of the cluster distribution for each parameter set , and for each field .
Figure 2 shows that the problem of cluster resolvability only becomes important for high-mass, compact clusters, but that it can have a very strong effect on detection in this regime. For the highest mass and most compact clusters considered the resolvable fraction rapidly approaches zero, so that no point-source observation of a VLM star is expected, even if clusters appear within the field of view. The density enhancement due to the superposition of clusters is found to have little effect on , since only becomes significantly larger than unity for clusters with large radius (in which case in Eq. 15), and these clusters anyway have such low surface densities that the enhancement has little consequence.
As for Fig. 1, one can crudely parameterise the portion of the plot which permits to be unity by using Eq. 12 with pc and for 0.2- stars, or pc and for 0.092- stars. If one instead simply demands consistency with MACHO () then the allowed range is slightly larger with pc and , or pc and for 0.2- or 0.092- stars, respectively.
3.4 Dynamical considerations
One can provide strong constraints on the permissible mass and radius of clusters which contribute significantly to halo DM by considering their dynamical effects on the visible stellar population (e.g. Lacey & Ostriker [1985]; Carr & Lacey [1987]; Moore [1993]; Moore & Silk [1995]). Such considerations lead to the conclusion that viable cluster parameters are bounded above and below, forming an ‘island’ in parameter space (Kerins & Carr [1994]; Moore & Silk [1995]). This is important because it means that one cannot invoke arbitrarily massive and compact clusters in order to force agreement between various observations. Furthermore, in principle cluster parameters which are compatible with dynamical limits may be incompatible with source-count and MACHO limits, thereby ruling out the entire scenario.
The issue of dynamical constraints is somewhat complicated by the fact that the limits depend (sensitively in some instances) on Galactic as well as cluster parameters. Whilst I do not explicitly present the dependencies of the constraints on these other parameters (these can be found in the references cited above), I assume the following values for the relevant parameters: a typical Galactocentric distance for clusters in the vicinity of the HST fields of 8 kpc (in fact most of the fields are further from the Galactic centre, where their dynamical effects would be weaker than assumed here); a cluster halo fraction (required to provide consistency with MACHO observations); an average halo mass density , giving a cluster number density ; a halo core radius kpc; a one-dimensional halo velocity dispersion of 156 km s-1; and a Galaxy age of 15 Gyr. The dependency on Galactic parameters means that the dynamical limits presented here do not represent firm limits in the strictest sense, but should nonetheless help in assessing the viability of the cluster scenario. (Note that some of the authors above express constraints in terms of the cluster half-mass radius , assuming the surface-density profile of Eq. 16 with .)
An upper limit on the radius of clusters comes from the requirement that they do not disrupt one another due to collisions occurring within the lifetime of the Galaxy. This implies pc for the parameters adopted above. Clusters also need to avoid tidal disruption due to the differential force from the Galactic potential acting across the cluster diameter; a constraint which requires pc. Since at any time there is always a finite fraction of cluster members whose velocities exceed the cluster escape velocity, clusters slowly evaporate over time. That they do not evaporate by the present day requires .
The final constraint comes from considering the effect of close or direct collisions between dark clusters and observed diffuse globular clusters (Carr [1978]; Moore [1993]; Moore & Silk [1995]). Moore ([1993]) showed that the requirement that observed diffuse clusters show no sign of disruption today leads to the limit for dark clusters with small radius, though this value is derived from a rather unusually diffuse cluster that may have atypical properties which result in too strong a constraint. A more robust limit from other less diffuse and more representative clusters demands for (B. Moore, private communication). For clusters with larger radius Moore & Silk ([1995]) derive a limit corresponding to pc.

These limits, for an assumed star mass , are projected onto the plane in Fig. 3 (bold lines), together with the corresponding HST limits from Fig. 2, which assume a clustering fraction . Regions of parameter space for which HST counts permit are projected onto the plane , corresponding to the halo fraction preferred by MACHO microlensing observations towards the LMC (Alcock et al. [1997]). Thus the flat region of the plane at small cluster radii and large masses simultaneously satisfies MACHO observations and HST counts. It is clear that this region and the region bounded by the dynamical limits are almost mutually exclusive, with only a small area of the plane satisfying all three requirements. This is due to the strong limits inferred from the absence of dynamical effects on presently-observed diffuse globular clusters, and from evaporation considerations. The surviving parameter region is characterised by a cluster mass and radius pc and is relatively insensitive to the VLM star mass within the range considered in this paper. Clearly, for the cluster scenario to be viable and have to be rather finely tuned, though it is interesting that the allowed parameter space coincides well with the baryon Jeans mass at the recombination epoch, as well as to the predictions of some baryonic DM formation theories (e.g. Ashman [1990]).
3.5 Microlensing signatures
The effect of clustering halo objects can be to increase or decrease the observed microlensing rate, depending on whether or not the observer’s line of sight intersects with more or less than the expected average number of clusters. One can therefore derive firm upper and lower limits on the halo lens fraction by assuming it to be clustered.
Maoz ([1994]) has shown that there are two key features that should help to discriminate between microlensing events in the clustered and unclustered cases. The first is that the microlensing optical depth through a cluster is , where is the Einstein radius and is the distance to the lensed source. Since this can be a factor higher than in the unclustered case for very massive () compact ( pc) clusters, Maoz notes that one expects to observe angular correlations between events on a scale . Maoz claims that for clusters of this mass a sample as small as 10 events would be sufficient to rule out such clusters from providing all the halo DM at the 95% CL, if such correlations are not observed. Assuming that angular correlations are observed, one should also expect nearby events to have similar timescales, assuming the lenses have similar masses. This is because the events would be due to objects residing in the same cluster, so they would be at the same distance from the observer and would have similar velocities. These conclusions are however based on cluster mass scales which are now ruled out by the dynamical considerations discussed in the previous subsection. The prospects for detecting such signatures from clusters with are much less optimistic (Metcalf & Silk [1996]), especially if they comprise only 40% of the DM.
Whether clustering could significantly affect the statistics for the halo DM fraction depends upon how many clusters one expects to see within the solid angle of observation. The MACHO LMC search covers a solid angle of 11 deg2 (Alcock et al. [1996]), so the expected number of clusters between the observer and the LMC (, , kpc) is
| (21) |
where
| (22) |
for a halo with a density profile given by Eq. 1. Thus, for clusters which are simultaneously compatible with dynamical limits and HST source counts (implying from Fig. 3) one expects to be within the MACHO field of view if and .
If the clusters all have the same mass and comprise objects with the same MF, then the observed rate will depend only on . Assuming the cluster distribution on the sky obeys Poisson statistics, the probability of there being clusters within the field of view when one expects (in which case one would infer a halo fraction when the true fraction is ) is simply .
The MACHO data yields a likely halo fraction if the lenses are assumed to be unclustered. The inferred value for would be the same for the cluster scenario provided , otherwise one should take . The 1- variation on is less than 3% for , so the inferred halo fractions for the clustered and unclustered regimes are virtually identical in this case. Only for do Poisson fluctuations in the number of clusters become important, though in this case the microlensing signal is anyway dominated by the smoothly distributed VLM stars. The conclusion therefore is that for cluster mass scales compatible with dynamical limits their microlensing signatures are indistinguishable from the unclustered case.
It is interesting to consider what the inferred halo fraction from microlensing, together with the HST source-count limits, imply for the likely value for the clustering efficiency . The halo considered in this paper has a microlensing optical depth towards the LMC, assuming it is completely comprised of lenses. The 95% CL lower limit on the measured optical depth is (Alcock et al. [1997]), compared to the optical depth contribution expected from all non-halo components of . Subtracting the contribution from these components gives a lower limit on the halo fraction of . From Sect. 2 the maximum contribution from unclustered zero-metallicity VLM stars to the halo is 1.4% at the 95% CL. Therefore, consistency between MACHO and HST observations requires that . That is, one requires a present-day clustering efficiency of 92% or better. This is certainly a very strong demand for the cluster scenario to meet. If one adopts the central value for the measured optical depth () then the required clustering efficiency must be at least 97%.
4 Discussion and conclusions
In this paper I have considered the constraints on the contribution to the halo dark matter (DM) of a population of zero-metallicity, hydrogen-burning stars with mass below (VLM stars).
Though there are already strong constraints on the VLM star scenario, this present work is motivated by 2 considerations: (1) previous studies have adopted colour cuts for their star samples which effectively eliminate any chance they have of discovering zero-metallicity VLM stars; (2) previous studies only consider limits on a smoothly distributed population of VLM stars, where as some theories of baryonic DM formation predict that the stars should be grouped into globular-cluster configurations.
Using data from 20 of the 22 HST fields obtained by Gould et al. ([1996]), together with the photometric predictions of Saumon et al. ([1994]) for zero-metallicity VLM stars, I find that the contribution from a smoothly distributed population of such stars to the halo can be no more than 1.4% at the 95% confidence level on the basis of 75 candidate VLM stars with appearing in the fields when at least 6 310 are predicted. In reality, the true fraction is likely to be less than this value since many of the candidates may belong to the spheroid or disc components. This limit is comparable to previous analyses for stars of non-zero metallicity and therefore the inescapable conclusion is that any smoothly distributed population of VLM stars, regardless of its metallicity, makes at best only a tiny contribution to the halo DM.
Clustering allows the possibility of much larger fluctuations in the expected number of stars appearing in the fields. Additionally, highly compact clusters may not be completely resolvable, thereby decreasing the number of available point sources. These two effects can permit a halo fraction in clusters which is compatible with the halo fraction inferred by the MACHO gravitational microlensing experiment provided that the cluster mass and radius satisfy the inequality pc.
One also requires that the cluster scenario satisfies the dynamical constraints which exist on the allowed mass and radius of clusters. Comparison of the dynamically allowed region with the region which satisfies both HST and MACHO observations reveals that only a very small portion of parameter space, characterised by and pc, satisfies all three requirements. However, the implicated cluster mass is intriguingly close to the mass predicted by some DM formation theories (Ashman [1990]), and to the baryon Jeans mass at the cosmological epoch of recombination.
For a cluster mass , which is required by dynamical arguments, the effect on microlensing statistics is indistinguishable from the unclustered case, and in particular the inferred halo fraction should be within a few percent of the value inferred by assuming the DM distribution to be unclustered. However, MACHO and HST observations place a strong limit on the efficiency with which VLM stars need to be clustered in order to remain compatible with both surveys. This limit corresponds to a 92% present-day clustering efficiency and therefore provides a very stern test of the scenario.
Whilst recent microlensing results seemingly provide strong evidence for a substantial baryonic contribution to Galactic halo DM, when taken together with other observational and theoretical constraints it has become increasingly difficult to provide a unique baryonic candidate which can simultaneously explain the high microlensing fraction and the event timescales. One way out is to invoke a substantial modification in the shape of the halo though, for this to work, the microlensing results require a component resembling something closer to a maximal disc, leaving the status of any halo (and the role of non-baryonic DM on Galactic scales) much reduced. Another option is to attribute the lensing events to some non-baryonic candidate, such as primordial black holes, though in this case one requires an additional non-baryonic candidate to explain the rest of the halo DM. Here I have shown that it is still possible, if only barely, to construct a baryonic scenario which is compatible with all known constraints and which does not require a major modification in the halo dynamics. It is also conceivable that the scenario could provide an explanation for the recent detections of faint extended emission around the edge-on spiral galaxy NGC 5907 (Sackett et al. [1994]; Lequeux at al. [1996]) which, under the assumption of constant mass-to-light ratio, appears to trace the distribution of a halo.
Acknowledgements.
I am grateful to Andy Gould, John Bahcall and Chris Flynn for their permission to use the HST data, some of which is unpublished. I particularly wish to thank Andy Gould for useful discussions and for supplying the HST data in electronic form. I am also grateful to Didier Saumon for providing the zero-metallicity VLM star model predictions in electronic form, to Ben Moore for useful correspondences, and to David Valls-Gabaud for helpful discussions. This research is supported by a EC Marie Curie Training & Mobility of Researchers Fellowship.References
- [1996] Adams, F. C., Laughlin, G., 1996, ApJ, 468, 586
- [1996] Alcock, C. et al., 1996, ApJ, 461, 84
- [1997] Alcock, C. et al., 1997, ApJ, in press
- [1990] Ashman, K. M., 1990, MNRAS, 247, 662
- [1982] Burstein, D., Heiles, C., 1982, AJ, 87, 1165
- [1994] Bahcall, J. N., Flynn, C., Gould, A., Kirhakos, S., 1994, ApJ, 435, L51
- [1978] Carr, B. J., 1978, Comm. Ap., 7, 161
- [1994] Carr, B. J., 1994, ARA&A, 32, 531
- [1984] Carr, B. J., Bond, J. R., Arnett, W. D., 1984, ApJ, 277, 445
- [1987] Carr, B. J., Lacey, C. G., 1987, ApJ, 316, 23
- [1996] Chabrier, G., Segretain, L., Méra, D., 1996, ApJ, 468, L21
- [1995] Charlot, S., Silk, J., 1995, ApJ, 445, 124
- [1995] De Paolis, F., Ingrosso, G., Jetzer, P., Roncadelli, M., 1995, A&A, 295, 567
- [1985] Fall, S. M., Rees, M. J., 1985, ApJ, 298, 18
- [1996] Flynn, C., Gould, A., Bahcall, J. N., 1996, ApJ, 466, L55
- [1983] Gilmore, G., Hewett, P., 1983, Nat, 306, 669
- [1996] Gould, A., Bahcall, J. N., Flynn, C., 1996, ApJ, 465, 759
- [1996] Graff, D. S., Freese, K., 1996, ApJ, 456, L49
- [1983] Gunn, J. E., Stryker, L. L., 1983, ApJS, 52, 121
- [1996] Jungman, G., Kamionkowski, M., Griest, K., 1996, Phys. Lett. (Phys. Reports-Review), 267, 195
- [1994] Kerins, E. J., Carr, B. J., 1994, MNRAS, 266, 775
- [1962] King, I. R., 1962, AJ, 67, 471
- [1995] Krauss, L., 1995, Nucl. Phys. B, S43, 208
- [1985] Lacey, C. G., Ostriker, J. P., 1985, ApJ, 299, 633
- [1991] Lenzuni, P., Chernoff, D. F., Salpeter, E. E., 1991, ApJS, 76, 759
- [1996] Lequeux, J., Fort, B., Dantel-Fort, M., Cuillandre, J., C., Mellier, Y., 1996, A&A, 312, 1
- [1994] Maoz, E., 1994, ApJ, 428, L5
- [1996] Metcalf, R. B., Silk, J., 1996, ApJ, 464, 218
- [1993] Moore, B., 1993, ApJ, 413, L93
- [1995] Moore, B., Silk, J., 1995, ApJ, 442, L5
- [1992] Richstone, D., Gould, A., Guhathakurta, P., Flynn, C., 1992, ApJ, 388, 354
- [1990] Ryu, D., Olive, K. A., Silk, J., 1990, ApJ, 353, 81
- [1994] Sackett, P. D., Morrison, H. L., Harding, P., Boroson, T. A., 1994, Nat, 370, 441
- [1994] Saumon, D., Bergeron, P., Lunine, J. I., Burrows, A., 1994, ApJ, 424, 333