Under the Shadow of the Magellanic Bridge: A Measurement of the Extragalactic Background at keV
Abstract
We measured the extragalactic 0.7 keV X-ray background by observing the X-ray shadow of a neutral gas cloud in the Magellanic Bridge region. Two ROSAT PSPC observations of total 104 ks were complemented by a detailed H 1 mapping of the cloud with both the Parkes 64 m telescope and the Australia Telescope Compact Array. From the detected anti-correlation between the observed background intensity and the H 1 column density of the cloud, we derived the unabsorbed extragalactic background intensity as at keV. The 95% confidence lower limit is greater than the expected point-like source contribution , constrained by the mean source spectrum together with the total background intensity in the 1-2 keV band. A significant fraction of the 0.7 keV background likely arises in a diffuse hot intergalactic medium of a few million degrees, as has been predicted in hydrodynamic simulations of cosmological structure formation.
keywords:
cosmology: observations — diffuse radiation — large-scale structure of universe — intergalactic medium — X-rays: general1 Introduction
The extragalactic background at keV is of special cosmological interest, because it may contain unique information on the large-scale structure of the universe. Hydrodynamic simulations of the structure formation predict that a considerable fraction, probably most, of the baryonic matter in the universe is in a diffuse intergalactic medium (IGM) within a temperature range of - K (Ostriker & Cen 1996; OC96 hereafter). This “not-so-hot” IGM, not precluded by the COBE spectral distortion limit on the cosmic microwave background (Mather et al. 1994), may contribute significantly to the soft ( keV) X-ray background. Most interestingly, various emission lines of heavy elements (O, Ne, and Fe) may collectively form a distinct spectral bump at keV (Cen et al. 1995; CKOR95 hereafter). This bump is an observationally testable feature, and has the potential as a diagnostic of the physical and chemical properties of the IGM.
The directly observed 0.7 keV background is, however, a composite of various components, both Galactic and extragalactic. The relatively well-studied component is from discrete sources, most () of which appear to be AGNs (e.g., Shanks et al. 1991). Based on the ROSAT deep and medium sensitivity surveys, Hasinger et al. (1993; H93 hereafter) have determined the source flux distribution down to a 0.5-2 keV flux limit of . The distribution can be described by a broken power law, which changes its slope at a source flux of . The average source spectrum in the range of 0.1-2 keV can be characterized by a power law of energy slope , but the spectrum becomes harder with the decreasing source flux (see also Wang & McCray 1994; Vikhlinin et al. 1995). Spatial fluctuation analysis of X-ray data further suggests that point-like sources account for of the background intensity in the 1-2 keV band (H93). In the lower energy bands, however, discrete sources appear to contribute a significantly lower fraction. Based on auto-correlation and spectral analyses of two ROSAT observations, Wang & McCray (1994) conclude that point-like sources account for of the 0.7 keV background below a source detection limit of , and suggest the presence of a diffuse “hard” component, in addition to the well-known K Local Bubble contribution that is important only at energies keV (Snowden et al. 1990). The nature of this diffuse hard component, however, remains unclear.
The Galactic contribution must be important at least in some directions. The ROSAT all sky survey (Snowden et al. 1995) shows a definite intensity enhancement in the 3/4 keV band (approximately the Wisconsin M band) towards the inner portion of the Milky Way ( from the Galactic center). The Galactic contribution must be dominant at the Galactic plane, which is nearly opaque to the extragalactic M-band radiation. Although its exact origin is not yet clear, the contribution appears to be chiefly diffuse (Wang 1992).
To separate the Galactic and extragalactic components of the M-band background, we carried out an observing program to measure the background shadow produced by the X-ray absorption of a cloud in the bridge region between the Large and Small Magellanic Clouds (LMC and SMC; McGee & Newton 1986). This cloud, about away from the SMC, is clearly a product of the tidal interaction between the two H 1 galaxies. Besides the H 1 cloud, the field appears to be a fair sample of the typical sky, free from X-ray emission associated with the LMC and SMC. Furthermore, at a distance 65 kpc, assumed to be the same as the SMC, the cloud should shadow the true extragalactic background. Most importantly, the peak column density of the cloud, , is only about 50% transparent to X-rays at keV . Therefore, we can infer the extragalactic component from the X-ray absorption by the cloud.
2 Observations and Data Reduction
2.1 X-ray
Two of our proposed three observations were carried out with the ROSAT Position Sensitive Proportional Counter (PSPC — Pfeffermann et al. 1987; Trümper 1983): The on-cloud observation (ROSAT Sequence No. rp900250) with an accumulated exposure of 91 ks was centered at (R.A., Dec. — J2000). The only off-cloud observation of 13 ks (considerably less than desirable) was centered at . The fields of view of the two observations, diameter each, were set to overlap. The overlapping region allowed us to remove differential contamination of non-cosmic X-rays between the two observations.
Standard data reduction for diffuse study included removal of times of high solar X-ray contamination, estimation of residual non-cosmic X-ray background, and flat-fielding (Wang & Yu 1995; Snowden et al. 1994a). The observation rp900250 was taken in two different observing semesters: March 16 to April 15, 1993 and October 1 to November 1, 1993. These two data sets were first analyzed separately, and later aligned and co-added by matching discrete source positions (a correction of ).
Count, non-cosmic X-ray background, and exposure images were produced in individual ROSAT PSPC bands (i.e., R1-R2, R4-R7; Snowden et al. 1994a). The R1 and R2 bands were sensitive to photons of energies keV, the Carbon-absorbing edge of the detector window. Photons observed in these two bands are dominantly Galactic; the sightline Galactic absorption corresponds to a mean photon transmission . The R4 band, whose response covers an energy range of 0.44–1.0 keV and peaks at 0.7 keV (approximately the Wisconsin M1 band), is optimal for detecting the extragalactic 0.7 keV background absorption by the bridge cloud. The rest of the bands response more favorably to photons at higher energies (0.6–2 keV; the energy responses of the bands are partially overlapped due to the limited spectral resolution of the PSPC). The transmission increases steeply with the increasing photon energy (Morrison & McCammon 1983). In the R5 band, for example, the transmission is about 50% greater than in the R4 band.
2.2 Radio
We mapped out the H 1 column density distribution in the ROSAT fields using the Australia Telescope Compact Array (ATCA) and Parkes 64 m telescope. The Parkes observations were made during August 29 and October 23-24, 1993. For the on-cloud field, the observations covered an area of radius with a sample interval of 1m in R.A. and 4′ in Dec. For the off-cloud area, we observed 5 positions with separation of 5m in R.A. and 20′ in Dec. The integration time at each position was 30 s, and a total of 561 pointings was obtained.
While the Parkes mapping was used to determine the total H 1 distribution of large scale structure, the ATCA observations toward the cloud were used to resolve fine features. The observations were made on July 28, 1993 with the configuration 750D (the shortest baseline is 30 m). Centered at 1420 MHz, the 8 MHz bandwidth was divided into 1024 channels. PKS 1934-638 (adopted flux density of 16.1 Jy) was observed for the absolute flux density calibration, while PKS 0252-710, observed for 5 minutes at every 30 minute interval, was used for phase and spectral bandpass calibrations.
These radio observations were processed with the AIPS software package. The Galactic H 1 component (velocity ) was detected only in the Parkes observations, indicating that it is very smooth and has few small-scale features. We adopted an average Galactic column density of with an uncertainty of . In contrast, structures with various angular scale sizes are present in the bridge component, which was integrated over the velocity range of .
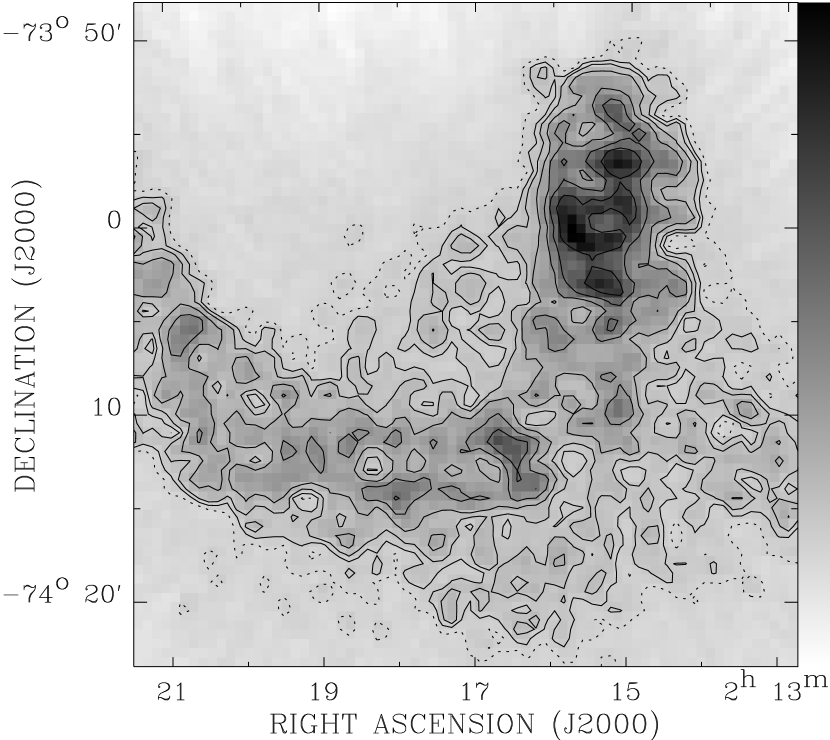
To obtain both the absolute column density and its fine structures, we combined the Parkes and ATCA data to form a single H 1 map of the cloud (Fig. 1), using the method of adding single-dish data into an aperture synthesis data as described by Ye, Turtle and Kennicutt (1991). The resolution of this map is which is comparable to that of the X-ray data. Smoothing the map back to the resolution of the Parkes showed no distinct difference from the one produced by the Parkes data alone.
3 Analyses and Results
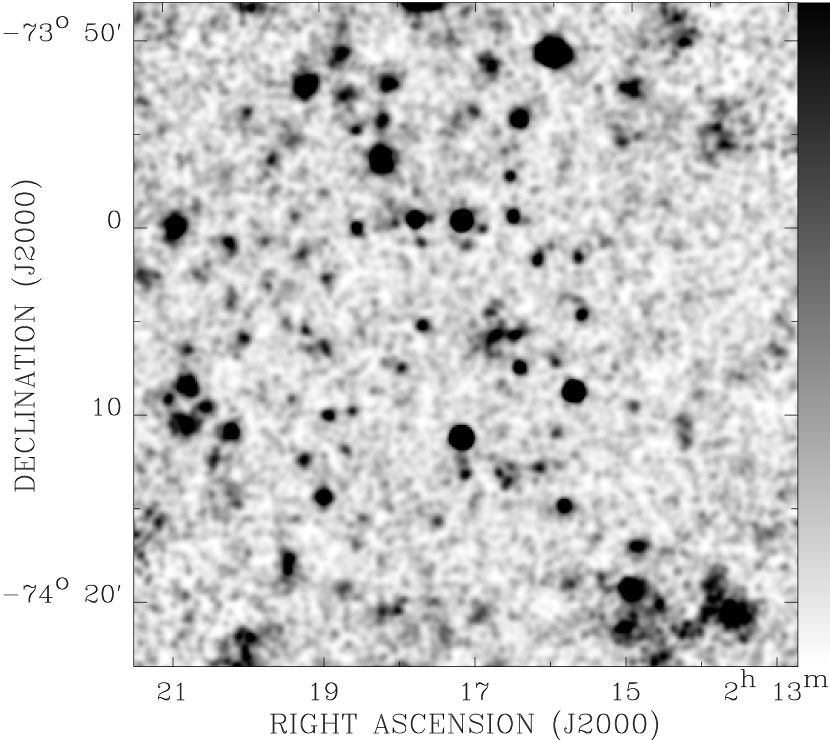
As shown in Fig. 2, discrete sources cause strong small-scale fluctuation in the X-ray intensity map. Thus, we must remove them before performing an X-ray/H 1 anti-correlation analysis. We searched for sources in each of the two PSPC observations. We first used the so-called local detection algorithm (Hamilton, Helfand, & Wu 1992), and then used the standard map detection for more sensitive searches. We constructed a background map by excising detected sources and by smoothing with a median filter (Wang & Yu 1995). We adopted two source detection apertures: 50% and 85% flux-encircled radii of the instrument point spread function (PSF; Hasinger et al. 1994). We applied the maximum likelihood fitting to obtain accurate positions of those sources within on-axis of each observation. Outside this off-axis radius, the quality of source detection and analysis was compromised by both the degraded PSF and the shadow of the detector’s window supporting structure. Accordingly, our later anti-correlation analysis is limited to the data within the off-axis radius. Finally, we merged sources within the 50% flux-encircled radius. We repeated the map detection until no new source was found.
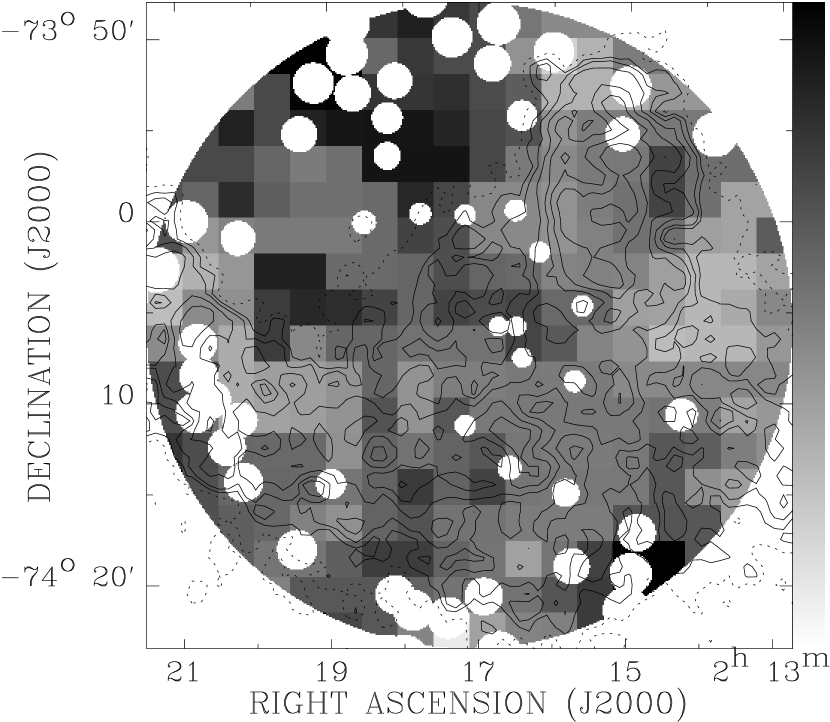
We removed sources brighter than an unabsorbed flux of (0.5-2 keV), which corresponds to a source detection signal-to-noise ratio of 3 at the off-axis of the on-cloud observation. In converting from a PSPC count rate to its unabsorbed flux, we assumed a power law spectrum of , absorbed by H 1 in the source’s direction. Actually, we excluded only data within the flux-encircled radius of each source; the remaining 10% of the source flux, contained mainly in the broad PSF wing due to irregular scattering of X-rays by the imperfect telescope mirror, cannot be effectively subtracted on a pixel-to-pixel base. Such residual source flux, together with sources below our source removal threshold, causes some small-scale enhancements in Fig. 3. In the off-cloud observation, we removed sources down to a threshold of . To calculate intensities in the off-cloud observation at the same source removal threshold as in the on-cloud observation, we further subtracted 90% of the source contribution between the two thresholds, which we estimated with the Hasinger et al source flux distribution, an approach similar to that used in Cui et al. (1996).
To facilitate a least- analysis, we summed the on-cloud data in each band into 100 H 1 column density bins of about equal area coverage (e.g., average 65.7 counts per bin in the R4 band), and the off-cloud data into a single bin. We fitted the data with a two-component model (Fig. 4), defined as
where and are the Galactic and extragalactic intensities to be determined; is the total expected X-ray intensity within an H 1 bin, denoted by superscript , and is the mean X-ray transmission in the bin. The transmission accounts for the neutral gas absorption in both the bridge and the Galaxy. Elements contributing to the absorption are primarily H, He, O, and Ne (Morrison & McCammon 1983). We adopted a metallicity of 18% solar for the cloud, same as that of the SMC (Russell & Dopita 1992), and 50% solar for Galactic H 1 (Meyer et al. 1995).

As expected, we find no significant anti-correlation between H 1 and X-ray intensity, except in the R4 and R5 bands. The detection of the extragalactic background in the R5 band is marginal at confidence; the best-fit intensity is (90% confidence limits).
We thus focus on results obtained in the R4 band. The best-fit (; Fig. 4) gives and as and ; the 10% residual source flux has been subtracted from . Assuming again the power law (), the corresponding extragalactic energy intensity is at 0.7 keV. To obtain an estimate of the total extragalactic background, one should include , an expected contribution from sources above our source subtraction threshold of (H93).
Although the fit in Fig. 4 is satisfactory, systematic effects still need some consideration. The most important one is probably associated with the discrete source contribution. Our imperfect source subtraction is at least partially responsible for apparent outliers seen in Fig. 4. For example, the bin at deviates by from the best-fit model, and appears to be influenced by the presence of two peaks with signal-to-noise ratios in Fig. 3. The removal of this bin would slightly increase our estimate of the extragalactic background. In addition, the extragalactic background may contain structures on scales comparable to the size of the cloud (e.g., Burg et al 1992). As a test, we have analyzed the ROSAT deep survey observation in the Lockman Hole (wp900029; H93), following the same procedure as described above. Pretending that the observation is our on-cloud observation, we detected no significant anti-correlation between X-ray and H 1. Nevertheless, the issue regarding the possible structure of the extragalactic background remains to be explored, but is beyond the scope of this paper. For the time being, we assume that these systematic effects are insignificant.
4 Discussion
The above results represent the first separation of the Galactic foreground from the extragalactic background at keV. The Galactic foreground measurement places a fundamental limit on the integrated emission in the Galaxy, including its halo. In the following, however, we concentrate on discussing the implication of the extragalactic background measurement on the hot IGM.
Is there any evidence for the presence of a diffuse 0.7 keV extragalactic background? To the lowest source detection limit of (0.5-2 keV), the integrated mean source contribution is 8.8 at 0.7 keV, only 15% of which is below our source removal threshold. This contribution is significantly below our 95% confidence lower limit to the total extragalactic background 18 . Further extrapolating the Hasinger et al. source flux distribution (H93) to , a limit at which all X-rays observed in the 1-2 band are attributed to point-like sources (H93), the source contribution would then be , still considerably below our limit. Because the mean source spectrum becomes harder (i.e., ) with decreasing flux (H93; Wang & McCray 1994; Vikhlinin et al. 1995), the real source contribution should be lower. Therefore, a diffuse contribution is needed to explain our measured 0.7 keV extragalactic background.
Evidence for a thermal component of the 0.7 keV background comes from the ASCA X-ray Observatory, which provides spectroscopic capability between 0.4-10 keV. The spectrum of the X-ray background clearly shows an excess below 1 keV above the extrapolation of the single power law () that fits well to the 1-10 keV spectrum, and also shows evidence of O 7 and O 8 lines, suggesting that at least part of the excess is thermal in origin (Gendreau et al. 1995). There are, however, some significant discrepancies () between soft X-ray background normalizations derived from different instruments (McCammon & Sanders 1990; Wu et al. 1991; Garmire et al. 1992; Gendreau et al. 1995; Snowden et al. 1995), making it hard to compare different measurements of absolute background intensities. Nevertheless, our ROSAT measurement of the extragalactic background, combined with the ASCA spectral results, do seem to suggest that a considerable fraction of the 0.7 keV background arises in extragalactic diffuse thermal gas.
While the exact thermal state of the gas is yet to be determined, we here characterize the gas with an optically-thin thermal plasma (Raymond & Smith 1977). The mean metallicity of the gas should fall within the range between solar for rich clusters and for voids (CKOR95 and references therein). We choose 6% solar as a representative value. Assuming a temperature of K, at which the gas emission peaks in the R4-band, we obtain an emission measure of from our best estimate of the diffuse extragalactic 0.7 keV background. For gas with a distribution of temperatures, the gas contribution to the background would be less efficient and thus the inferred emission measure would be higher.
Where is the diffuse gas located? The closest possibility is the intragroup space of our Local Group of galaxies. Could the gas be the hot intragroup medium? Apparent diffuse X-ray emission has been detected in a number of groups. But all these groups contain large elliptical galaxies with (Mulchaey et al. 1996). The absence of such a galaxy in our Local Group suggests that the Local Group does not contribute significantly to the X-ray background. Therefore, the diffuse gas is likely cosmological in origin.
We speculate that the 0.7 keV diffuse extragalactic background may represent the integrated emission from the diffuse IGM. Away from those more-or-less virialized systems, such as rich clusters of galaxies, the diffuse IGM is believed to be the major component of the large-scale structure, and may account for most of the baryonic content of the universe required by Big Bang nucleosynthesis (e.g., Copi, Schramm, & Turner 1995; Tytler, Fan, & Burles 1996); the total visible mass in galaxies and in the hot intracluster medium is of the content (e.g., Persic & Salucci 1992). Detailed hydrodynamic simulations (e.g., OC96) show that a substantial fraction of the IGM should be within a temperature range of K. This hot IGM may contribute significantly more than individual rich clusters to the background at keV, where various spectral lines are present (mainly O 7, O 8, and the iron blade; CKOR95). Our estimate of the diffuse extragalactic emission favors models that predict relatively large contributions () from the IGM to the 0.7 keV background (e.g., the COBE-normalized, flat CDM model with a cosmological constant; CKOR95). But our result alone does not provide tight constraints on model parameters. So let us also check other available limits on the extragalactic soft X-ray background.
Many studies of X-ray shadows have already been carried out in the PSPC R1+R2 band, which is sensitive to photons keV (e.g., Burrows & Mendenhall 1991; Snowden et al 1994b; Wang & Yu 1995; Cui et al. 1996). In particular, based on X-ray shadows cast by parts of the nearby galaxy NGC 3184 and by high latitude clouds in Ursa Major (see also Snowden et al 1994b), Cui et al. have derived lower and upper limits to the total extragalactic background as 32 and 65 at 0.25 keV. The lower limit is essentially the same as the integrated contribution from directly detected sources to the flux limit of (H93). The upper limit allows a substantial diffuse contribution. With the power law of for the mean source spectrum, the total source contribution that accounts for all intensity in the 1-2 keV band corresponds to at 0.25 keV. With a flatter spectrum, the contribution would be lower. But, Galactic hot gas beyond the high-latitude clouds may also contribute. Therefore, the allowed diffuse extragalactic background is .
In comparison, we have here derived a diffuse extragalactic background intensity as at 0.7 keV. Clearly, the uncertainty in the actual intensity is substantial, but the 95% confidence lower limit is conservative. A K thermal plasma, accounting for the best-fit intensity, can contribute an intensity of at 0.25 keV. Alternatively, a K plasma, characteristic of the diffuse hard component (Wang & McCray 1994), can provide , close to the allowed diffuse background limit at 0.25 keV. Therefore, a detailed comparison of the available limits with realistically simulated IGM emission spectra may already be useful in constraining the thermal, and possibly chemical, properties of the IGM.
Acknowledgements.
We thank Dick McCray for detailed editorial corrections and valuable comments, and Jianke Li for assisting in the ATCA observations. This work is supported by a Lindheimer Fellowship and by NASA under Grants NAG 5-2716 and 5-2717.References
- (1) Burg, R., et al. 1992, A&A, 295, L9
- (2) Burrows, D. N., & Mendenhall, J. A. 1991, Nature, 351, 629
- (3) Cen, R., Kang, H., Ostriker, J. P., & Ryu, D. 1995, ApJ, 451, 436 (CKOR95)
- (4) Copi, C. J., Schramm, D. N., & Turner, M. S. 1995, Science, 267, 192
- (5) Cui, W., et al. 1996, ApJ, in press
- (6) Garmire, G. P., et al. 1992, ApJ, 399, 694
- (7) Gendreau, K. C., et al. 1995, PASJ, 47, L5
- (8) Hasinger, G., et al. 1993, A&A, 275, 1
- (9) Hasinger, G., et al. 1994, Legacy, 4, 40
- (10) Hamilton, T. T., Helfand, D. J., & Wu, X. 1991, ApJ, 379, 576
- (11) Mather, J. C., et al. 1994, ApJ, 420, 439
- (12) McCammon, D., & Sanders, W. T. 1990, ARA&A, 28, 657
- (13) McGee, R. X. & Newton, L. M., 1986, PASA, 6, 471
- (14) Meyer, D. M., et al. 1994, ApJL, 437, 59
- (15) Morrison, R., & McCammon, D. 1983, ApJ, 270, 119
- (16) Mulchaey, J. S., Davis, D. S., Mushotzky, R. F., & Burstein, D. 1996, ApJ, 456, 80
- (17) Ostriker, J. P., & Cen, R. 1996, ApJ, 464, 270 (OC96)
- (18) Persic, M., & Salucci, P. 1992, MNRAS, 258, 14p
- (19) Pfeffermann, E., et al. 1987, Proc. SPIE Int. Soc. Opt. Eng., 733, 519
- (20) Raymond, J. C, & Smith, B. W. 1977, ApJS, 35, 419, and updated by Raymond, J. C. and installed in the XSPEC software package
- (21) Russell, S. C., & Dopita, M. A. 1992, ApJ, 384, 508
- (22) Shanks, T., et al. 1991, Nature, 353, 315
- (23) Snowden, S. L., et al., 1990, ApJ, 354, 211
- (24) Snowden, S. L., McCammon, D., Burrows, D. N., & Mendenhall, J. A. 1994a, ApJ, 424, 714
- (25) Snowden, S. L., et al., 1994b, ApJ, 430, 601
- (26) Snowden, S. L., et al., 1995, ApJ, 454, 643
- (27) Trümper, J. 1983, Adv. Space Res., 2, 241
- (28) Tytler, D., Fan, X.-M., & Burles, S. 1996, Nature, 381, 207
- (29) Vikhlinin, A. Forman, W., Jones, C., & Murray, S. 1995, ApJ, 451, 564
- (30) Wang, Q. D., 1992, ApJ, 392, 509
- (31) Wang, Q. D., and McCray, R. 1993, ApJL, 409, 41
- (32) Wang, Q. D. and Yu, K. 1995, AJ, 1995, 102, 698
- (33) Wu, X., Hamilton, T. T., Helfand, D. J., & Wang, Q. D. 1991, ApJ, 379, 564
- (34) Ye, T., Turtle, A. J. & Kennicutt, R. C. Jr., 1991, MNRAS, 249, 722