03 ( 11.03.4; 11.09.3; 12.03.3; 12.04.1; 13.25.2)
Sabine Schindler
ROSAT/HRI study of the optically rich, lensing cluster CL0500-24
Abstract
An analysis of a ROSAT/HRI observation of the optically rich, gravitationally lensing galaxy cluster CL0500-24 (or Abell S0506) is presented. We show that the X-ray luminosity of this supposedly rich cluster is relatively low at erg/s in the ROSAT band, the bolometric X-ray luminosity is erg/s. The X-ray emission is strongly correlated with the northern subconcentration of the cluster galaxies at redshift . The derived total mass of the (sub-)cluster within 1 Mpc is M⊙, with an upper limit to the gas mass of about M⊙, corresponding to a gas mass fraction of %. The X-ray luminosity and the morphology of the extended X-ray emission supports the view that CL0500-24 consists of two clusters at a velocity difference of km/s that happen to lie along the line of sight.
keywords:
Galaxies: clusters: individual: CL0500-24 – Galaxies: clusters: individual: Abell S0506 – intergalactic medium – Cosmology: observations – dark matter – X-rays: galaxies1 Introduction
The cluster CL0500-24 is a medium redshift (z 0.32), rich cluster of galaxies (Giraud 1988). Optically there are two obvious subconcentrations visible (Infante et al. 1994). There is a straight blue arc in the cluster whose redshift () clearly identifies it as a background galaxy (Smail et al. 1993), thus confirming the gravitational lens scenario suggested by Wambsganss et al. (1989).
Since there has been some debate in the past whether the various mass determinations for clusters of galaxies – velocity dispersions, gravitational lens masses, X-ray masses – result in consistent or discrepant results (see e.g. Miralda-Escudé & Babul 1995; Tyson & Fischer 1995; Smail et al. 1995; Squires et al. 1996a, 1996b), this cluster seems to be a good target for another test of these methods against each other.
X-ray observations of a galaxy clusters can provide information about the structure of clusters and therefore on their dynamical state. This is of interest here, since the optical appearance suggests physically distinct subclumps.
Here we present X-ray observations with the ROSAT/HRI (Trümper 1983). We show the morphology of CL0500-24 as it appears in X-rays, we determine an X-ray profile, and we estimate the mass of the X-ray emitting gas and the total mass of the cluster. Finally, we discuss our results and compare them with other X-ray/lensing clusters. Throughout this paper we use km/s/Mpc.
2 The cluster CL0500-24 (or Abell S0506) in optical light
The cluster CL0500-24 is a rich, very compact southern cluster of galaxies (Giraud 1988) at a redshift of (in Abell et al. (1989) it is listed as supplementary cluster S0506). There are 95-100 galaxies brighter than V = 23 within a radius of Mpc. The average density, N0.5, defined as the number of bright galaxies, (where is the magnitude of the third brightest galaxy) projected within a radius of 0.5Mpc is 31-36. This means that CL0500-24 appears richer than the well studied giant gravitational arc cluster Abell 370, for which , see Mellier et al. (1988). CL0500-24 contains a large fraction of blue galaxies, and has a quite high line of sight velocity dispersion of km/s, based on redshifts of 22 cluster galaxies (Giraud 1990). The cluster “apparently has a triple core” (Giraud 1988) so it is to be expected that an X-ray map will identify substructure. Infante et al. (1994) also found a bimodal distribution in the galaxy velocities, enhancing this view that the cluster consists of subclumps.
The known redshifts of the galaxies in CL0500-24 cover quite a broad range. Infante et al. (1994) showed that the velocity distribution (26 measured galaxies) is bimodal with two peaks at km/s and km/s. The velocity difference ( km/s) is much larger than the one-dimensional velocity dispersions of the two sub-clumps ( km/s, km/s). This double nature of the cluster was supported by Infante et al. (1994)’s group finding algorithms. So it appears that CL0500-24 is not one rich cluster, but rather two clusters along the line of sight.
The most striking feature in CL0500-24 is a straight, blue arc with a length of about 14 arcseconds, which is about 22 arcseconds away from the apparent cluster center. A gravitational lens model for this arc (Wambsganss et al. 1989) finds very naturally a strongly elongated image of a background galaxy at the position of the arc with the correct orientation. This model predicts a mass of about M⊙ for the (projected) inner part of the cluster, i.e. for a circle around the apparent center C with radius center-arc (cf. Giraud 1990). Equivalently, a cluster modeled as a singular isothermal sphere with a velocity dispersion of 1430 km/s is necessary to produce an arc with this length at this location. The redshift of the arc was recently measured to be (see Smail et al. 1993) confirming the gravitational lens scenario quite satisfactorily. So far no arclets or weak lensing signature have been reported in this cluster.
3 X-ray Data
CL0500-24 was observed with the ROSAT/HRI in a pointed observation with an exposure time of 37756 s between February and 13th, 1995.
The positioning of the observation can be checked with a point-like source which coincides with a star of blue magnitude 16.8 at a position , (J2000). From this correspondence we infer that the positional accuracy of the pointing is very good (estimated error 4 arcseconds). The total number of source photons for the cluster CL0500-24 is 440.
As the cluster emission is not very strong we follow a two-fold strategy. In addition to the straightforward analysis of the full data set, we try to improve the signal-to-noise ratio by skipping the intervals with enhanced background. In practice, we bin the data to intervals of 100 s. Subsequently, we drop the high background intervals with more than 500 counts / 100 s. The remaining time intervals with the “cleaned data” cover 57% of the original exposure time. The cleaned data set contains 270 source photons.
3.1 Morphology
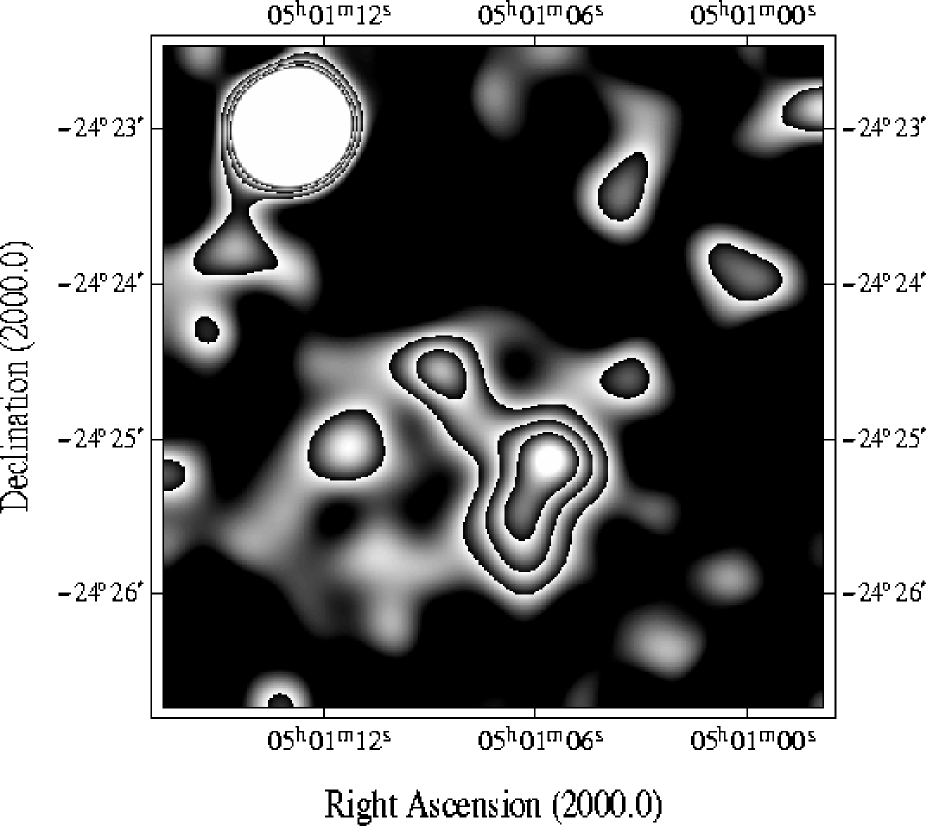
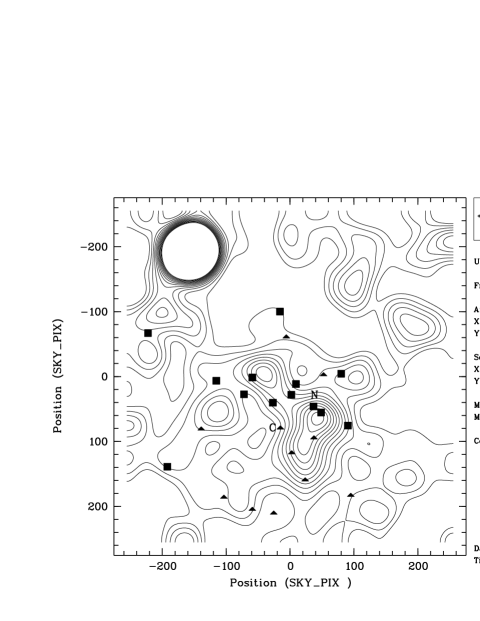
Because of the limited number of photons from the cluster the observed morphology is influenced by statistical fluctuations. In Fig. 1 we present an image smoothed with a Gaussian filter of arcseconds to give an idea how the morphology looks like. The main maximum of an image smoothed with a Gaussian of arcseconds is at , (J2000). It corresponds to a position between the galaxies N and S (nomenclature according to Giraud (1990)) which are identified by Infante et al. (1994) as the center of one of two subconcentrations. In an image smoothed with a Gaussian of arcseconds the X-ray maximum is also very close to these galaxies (see Fig. 2). The X-ray emission is elongated southward towards galaxy A. A second maximum of the X-ray emission can be seen in the North-East at , (J2000), close to galaxy # 12 (cf. Infante et al. 1994). There is no extra emission associated with the second optical center C. All these features are “robust” in that they show up both in the “cleaned” and in the “non-cleaned” data.
The galaxies are assigned to two subclusters centred on galaxy N and on galaxy C, respectively, by Infante et al. (1994) according to their velocities from Giraud (1990) and Infante et al. (1994). The distribution of N galaxies is much better correlated with the X-ray emission than the distribution of C galaxies (see Fig. 2). This is a first hint that we see in X-rays only (or mainly) the N subcluster.
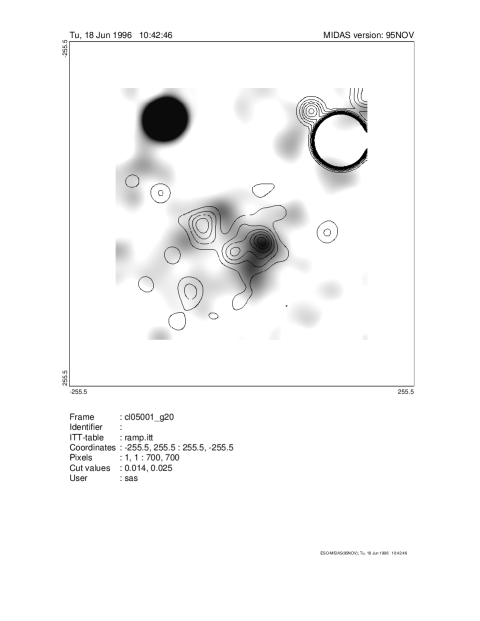
In Fig. 3 the X-ray morphology is compared with the galaxy density (Infante, private communication) for all galaxies, while in Fig. 2 only galaxies with measured velocities are included. The luminosity weighted densities show again the two main concentrations around N and C, out of which only N is correlated with X-rays. Another maximum in the galaxy density in the north-east is situated between two X-ray blobs and is probably belonging to the N concentration because there are three N galaxies in this region, i.e. again no indication for any emission from the C subcluster.
3.2 Luminosity
The X-ray emission can be traced out to a radius of 2.5 arcminutes (860 kpc at distance of cluster). As summarized in Table 1, we find a countrate of counts/s within this radius. To convert this countrate to a luminosity we assume a typical metallicity of 0.35 solar (Arnaud et al. 1992; Ohashi 1995) and a Galactic hydrogen column density of cm-2 (Dickey & Lockman 1990). As there is no possibility to derive a gas temperature with the HRI we assume a typical cluster temperature of 4 keV which is also consistent with the relation (Edge & Stewart 1991a; David et al. 1993; White 1996). With these values the luminosity in the ROSAT band (0.1 - 2.4 keV) is erg/s and the bolometric luminosity is erg/s. The errors include the uncertainties of the countrate and an assumed temperature range between 1 and 10 keV.
About 2.6 arcminutes north-east of the cluster centre is a point-like source (see Fig. 1) at , (J2000). It has a countrate of counts/s. The position of this source corresponds within 10 arcseconds to the radio source PMN0501-2422 which is listed in Griffith et al. (1994) with a 4850 MHz flux density of 154 mJy. Looking for an optical counterpart in the Southern Digitized Sky Survey we find a faint object at about 4 arcseconds distance; it cannot be distinguished whether it is a stellar object or a galaxy.
3.3 Profile
Because of the limited number of photons and the non-spherical appearance of the X-ray contours, the radial profile of the X-ray emission is not very well determined (Fig. 4). Nevertheless, we try to fit a -model to the surface brightness (following Cavaliere & Fusco-Femiano 1976; Jones & Forman 1984)
where is the central surface brightness, is the core radius, and is the slope parameter. The best fit values averaged over a number of fits with or without “cleaning” and with different binning centred on (J2000) are counts/s/arcmin2, arcminutes (30 kpc) and , a very small and a very small core radius. But the 1 errors allow for a huge range of about 0.3 to 1.0 for and 0 to 1.5 arcminutes (0 to 500 kpc) for the core radius.

3.4 Mass determination
The parameters of the -model can be used to make a deprojection of the 2D image to derive the three dimensional density distribution. The profile of the integrated gas mass is shown in Fig. 5. Within a radius of 1 Mpc the gas mass amounts to 0.46. As the emissivity of the gas in the ROSAT energy band is almost independent of the temperature (within the temperature range of 2-10 keV it changes only by 6%), we can derive the gas density distribution hardly affected by the uncertainty of the temperature estimate. The only uncertainty are local unresolved inhomogeneities or substructure which result in an overestimation of the gas mass. Therefore, the value given above is strictly speaking an upper limit.
With the additional assumption of hydrostatic equilibrium, the integrated total mass can be calculated from the equation
where and are the density and the temperature of the intra-cluster gas, and , , , , and are the radius, the Boltzmann constant, the molecular weight, the proton mass, and the gravitational constant, respectively. For the temperature we use again a typical cluster temperature of 4 keV. When using the parameters of the various -model fits with varying binning and with/out “cleaning” we find different mass profiles only in the central part, as shown in the section above. Beyond a radius of about 100 kpc the various mass profiles are in good agreement. The error originating from the uncertainty in the temperature is certainly much larger and can amount to .
The results are shown in Fig. 5. At a radius of 1 Mpc we find an integrated total mass of . The errors comprise a temperature range from 2 to 6 keV. This total mass yields a relatively high gas mass fraction of %. The gas mass fraction is decreasing when going to smaller radii. But as the gas mass fraction depends on and is not very well defined (see Sect. 3.3) this decrease may not be very significant.
The total mass is even smaller than the luminosity-weighted virial mass of of only the N concentration derived by Infante et al. (1994). (The X-ray mass converted to their km/s/Mpc would be .) This is a hint that the X-ray emitting gas traces the potential of only one subcluster.
For a comparison with mass estimates determined from the gravitational lensing effect, we also calculate the total mass of the cluster, as seen inside a certain angle, basically integrating a spherically symmetric three dimensional mass distribution in cylindrical shells with cylinder axis parallel to the line of sight or integrating the cluster surface mass density outward (see Fig. 5). The total mass inside a circle with radius cluster center-arc is . From the point lens model, Wambsganss et al. (1989) found a much larger value: (or a velocity dispersion of km/s for an isothermal sphere model); here we used the now measured arc redshift of (Smail et al. 1993). Obviously, the mass from the lens model is considerably higher than the mass obtained here when integrating outward the total mass derived from the X-ray emission. But the two mass estimates are not directly comparable because the X-ray mass is centred on galaxy N while the lensing model has an assumed centre close to ‘C’. There is a difference in these two mass determinations, but not a striking one. However, this is not too surprising: the gravitational lens effect integrates all matter along the sight, and we just pointed out that there are two clusters along the line of sight. On the other hand, the X-ray mass determination is most sensitive to the highest density regions in the center of the cluster. Furthermore, the point lens or spherically symmetric isothermal sphere model used for the gravitational lens model (Wambsganss et al. 1989) is certainly too simple to account in detail for the action of two subconcentrations along the line of sight.

| countrate(0.1-2.4keV) | counts/s |
|---|---|
| (0.1-2.4keV) | erg/s |
| (bol) | erg/s |
| (Mpc) | |
| (Mpc) | |
| gas mass fraction (Mpc) | % |
4 Discussion and conclusions
The X-ray luminosity of CL0500-24 is quite moderate. Actually, it is very small for a “rich” cluster of galaxies. The Abell Cluster A370 (at a comparable redshift), which supposedly is about equally rich as CL0500-24, is roughly ten times more luminous in X-rays (Lea & Henry 1988; Fabricant et al. 1991; Bautz et al. 1994). Does this show that there is a wide spread of X-ray luminosities for clusters that appear similarly rich optically?
We argued that the X-ray emission of CL0500-24 originates mainly from the northern subclump. But even when comparing the bolometric luminosity of CL0500-24 only with the velocity dispersion of the Northern subcluster, it is unexpectedly low (Edge & Stewart 1991b). This indicates at least a moderate spread in the optical richness versus X-ray luminosity relation.
There are other examples that illustrate this, e.g. the two distant clusters CL0939+4713 and CL0016+16, which are both optically very rich (Dressler 1994; Koo 1981) but have quite different bolometric X-ray luminosities: erg/s (Schindler & Wambsganss 1996) and erg/s (Neumann & Böhringer 1996), respectively.
Given the bimodal velocity distribution of the galaxies in CL0500-24 (cf. Chapter 2), there are two possibilities for the spatial distance of the subclusters in the line of sight. One possible scenario is that the two subclusters are relatively unrelated and the different velocities are caused mainly by the Hubble flow. In this case they have a distance of more than 60 Mpc. The other possibility is that the two subclusters have a physical distance that is smaller than that corresponding to the redshift difference, and are in the process of colliding. As the relative velocity of almost 3200 km/s is very high, in such a scenario the subclusters would have to pass right through each other along the line of sight. In fact, the projected distributions of the galaxies with redshift preferentially north, and with preferentially south indicates, that such a collision could not be exactly along the line of sight, but with some angle relative to it. So the velocity difference is only the contribution projected onto the line of sight, and the real 3dim relative velocity must be even larger than the measured difference. N-body models show that relative velocities around 3000 km/s or more are reached only during a very short period of time as the subclusters pass through each other (Schindler & Böhringer 1993; Huss et al. 1996). If the subclusters are just passing through each other, an X-ray emission enhanced by a about a factor of two relative to a quiescent state is expected during a collision (Schindler & Müller 1993). However, given the low observed X-ray luminosity, and the fact that it is very unlikely that we see CL0500-24 exactly in this extreme short phase corresponding to such an encounter with high relative velocity we conclude that it is extremely unlikely that the two subclumps are currently undergoing such a collision.
This view of two unrelated clusters is supported both by the morphology and the luminosity of the X-ray emission of the cluster. The X-rays originate from regions that are related to the subclump around N with galaxy velocities peaking at . There is no significant detection from the supposed center of the cluster near the galaxy C (cf. Giraud 1990) or other galaxies at redshift .
The mass assigned by Infante et al. (1994) to the more massive subclump around N at is even higher than the X-ray mass determined here. That is an indication that the X-rays trace the potential of only one subcluster while the southern subcluster around galaxy C apparently does not affect the X-ray mass determination. The mass found by Wambsganss et al. (1989) for the cluster from a simple gravitational lens model for the straight arc is higher than the X-ray mass determined here. This also fits into this picture qualitatively, because the gravitational lens effect integrates all the mass along the line of sight, and so unavoidably considers all the subclumps discussed here.
The total mass of ( within 1 Mpc which is about the virial radius according to the spherical collapse approximation (Gunn & Gott 1972; White et al. 1993) is a relatively low value compared to the typical mass range of clusters of (Böhringer 1995). It is an order of magnitude lower than the mass of the nearby clusters Coma and Perseus (Böhringer 1994). The gas mass fraction of 30% is at the upper limit of the typical range for clusters of 10-30% (Böhringer 1995).
Combined, all the arguments mentioned above point into the direction that CL0500-24 consists of two concentrations with little direct interaction. Only one of the subclusters has X-ray emission. But even considering the fact that only part of the optically visible cluster is associated with the X-ray properties, the values for the X-luminosity and the derived total mass are comparably small.
Acknowledgements.
It is a pleasure to thank Hans Böhringer, Makoto Hattori, Andreas Huss, and Doris Neumann for helpful discussions. We also thank Leopoldo Infante for providing to us unpublished galaxy data. S.S. acknowledges financial support by the Verbundforschung.References
- [1] Abell G., Corwin Jr. H.G., Olowin R.P., 1989, ApJS 70, 1
- [2] Arnaud M., Rothenflug R., Boulade O., Vigroux L., Vangioni-Flam E., 1992, A&A 254, 49
- [3] Bautz M.W., Mushotzky R., Fabian A.C., Yamashita K., Gendreau K.C., Arnaud K.A., Crew G.B., Tawara Y., 1994, PASJ 46, L131
- [4] Böhringer H., 1994, in: X-Ray Clusters of Galaxies, NATO Advanced Science Institute Vol. 441, Seitter, W.C. (ed.) Kluwer, Dordrecht, p. 123
- [5] Böhringer H., 1995, in: Proceedings of the 17th Texas Symposium on Relativistic Astrophysics and Cosmology, Böhringer H., Morfill G.E., Trümper J.E. (eds.), New York Academy of Sciences, New York, p. 67
- [6] Cavaliere A., Fusco-Femiano R., 1976, A&A 49, 137
- [7] David L.P., Slyz A., Jones C., Forman W., Vrtilek S.D., Arnaud K.A., 1993, ApJ 412, 479
- [8] Dickey J.M., Lockman F.J., 1990, ARA&A 28, 215
- [9] Dressler A., Oemler A., Butcher H.R., Gunn J.E., 1994, ApJ 430, 107
- [10] Edge A.C., Stewart G.C., 1991a, MNRAS 252, 414
- [11] Edge A.C., Stewart G.C., 1991b, MNRAS 252, 428
- [12] Fabricant D.G, McClintock J.E., Bautz M.W., 1991, ApJ 381, 33
- [13] Giraud E., 1988, ApJ 334, L69
- [14] Giraud E., 1990, A&AS 83, 1
- [15] Griffith M.R., Wright A.E., Burke B.F., Ekers R.D., 1994, ApJS 90, 179
- [16] Gunn J.E., Gott J.R., 1972, ApJ 176, 1
- [17] Huss A., Steinmetz M., Jain B., 1996, in preparation
- [18] Infante L., Fouqué P., Hertling G., Way M.J., Giraud E., Quintana H., 1994, A&A 289, 381
- [19] Jones C., Forman W., 1984, AJ 276, 38
- [20] Koo D.C., 1981, ApJ 251, L75
- [21] Lea S.M., Henry J.P., 1988, ApJ 332, 81
- [22] Miralda-Escudé J., Babul A., 1995, ApJ 449, 18
- [23] Mellier Y., Soucail G., Fort B., Mathez G., 1988, A&A 199, 13
- [24] Neumann D.M., Böhringer H., 1996, MNRAS, submitted
- [25] Ohashi T., 1995, in: Seventeenth Texas Symposium on Relativistic Astrophysics and Cosmology, Böhringer H., Morfill G.E., Trümper J.E. (eds.), New York Academy of Sciences, New York, p. 217
- [26] Schindler S., Böhringer H., 1993, A&A 269, 83
- [27] Schindler S., Müller E., 1993, A&A 272, 137
- [28] Schindler S., Wambsganss J., 1996, A&A, in press
- [29] Smail I., Ellis R., Aragon-Salamanca A., Soucail G., Mellier Y., Giraud E., 1993, MNRAS 263, 628
- [30] Smail I., Ellis R.S., Fitchett M.J., Edge A.C., 1995, MNRAS 273, 277
- [31] Squires G., Kaiser N., Babul A., Fahlman G., Woods D., Neumann D.M., Böhringer H., 1996a, ApJ 461, 572
- [32] Squires G., Neumann D.M., Kaiser N., Arnaud M., Babul A., Böhringer H., Fahlman G., Woods D., 1996b, ApJ submitted
- [33] Trümper J., 1983, Adv. Space Res. 2, 142
- [34] Tyson J.A., Fischer P., 1995, ApJ 446, L55
- [35] Wambsganss J., Giraud E., Schneider P., Weiss A., 1989, ApJ 337, L73
- [36] White D.A., 1996, in: Röntgenstrahlung from the Universe, Zimmermann H.U., Trümper J.E., Yorke H., MPE report 263, p. 621
- [37] White S.D.M., Efstathiou G., Frenk C.S., 1993, MNRAS 262, 1023