Images of Bursting Sources of High-Energy Cosmic Rays. I: Effects of Magnetic Fields
Abstract
It has recently been shown that the highest energy cosmic rays (CRs) may originate in the same cosmological objects producing -ray bursts. This model requires the presence of intergalactic magnetic fields (IGMF) to delay the arrival times of eV CRs by 50 years or longer relative to the -rays, of an amplitude that is consistent with other observational constraints. Sources of CRs coming from individual bursts should be resolved with the planned “Auger” experiment, with as many as hundreds of CRs for the brightest sources. We analyze here the apparent angular and energy distribution of CRs from bright sources below the pion production threshold (in the energy range ) expected in this model. This observable distribution depends on the structure of the IGMF: the apparent spectral width is small, , if the intergalactic field correlation length is much larger than , and large, , in the opposite limit . The apparent angular size is also larger for smaller . If the sources of CRs we predict are found, they will corroborate the bursting model and they will provide us with a technique to investigate the structure of the IGMF.
1 Introduction
The origin of cosmic rays (CRs) with energy is unknown. Most of the sources of cosmic rays that have been proposed have difficulties in accelerating CRs up to the highest observed energies (e.g., Cronin (1992); Elbert & Sommers (1995); Sigl, Schramm & Bhattacharjee (1994)). Recently, a new model has been proposed where the same astrophysical objects responsible for -ray bursts (GRBs) also produce the highest energy CRs (Waxman 1995a , Vietri (1995), Milgrom & Usov (1995)). There is increasing evidence that GRBs and the highest energy CRs are of cosmological origin (Fishman & Meegan (1995), Bird et al. (1994), Yoshida et al. (1995), Waxman 1995b ). In this case, the observational characteristics of GRBs impose strong constraints on the physical conditions in the -ray emitting region, which make it an ideal site for accelerating protons up to the highest observed CR energies. In addition, the average rate (over volume and time) at which energy is emitted as -rays by GRBs and in CRs above in the cosmological scenario is remarkably comparable (Waxman 1995a ,b).
The energy loss of CRs with , due to interaction with the microwave background, imply that they must originate at distances Mpc (e.g., Cronin (1992)). To reconcile the detection of two CRs with over a period (Bird et al. (1994),Yoshida et al. (1995)) with the expected rate of nearby GRBs ( per in the field of view of the CR experiments out to ; e.g., Cohen & Piran (1995)), a dispersion in arrival times for CRs produced in a single burst needs to be invoked. Such dispersion may result from deflections of CR protons by the intergalactic magnetic field (IGMF) (Waxman 1995a , Waxman & Coppi (1996)). The deflection angle for a proton propagating a distance in a magnetic field with correlation length is , and the induced time delay is (where the exact dependence of on depends on the scale of the magnetic field; see below). The required magnetic field is consistent with observational limits (Kronberg (1994); Vallee (1990)).
In a preceding paper (Miralda-Escudé & Waxman (1996)), we calculated the number of CR sources with different flux at different energies in the model of “Cosmic Ray Bursts”. The energy dependent delay of the CR arrival times results in individual sources having relatively narrow observed spectra, since at any given time only those CRs having a fixed time delay are observed. It was shown that in the GRB model most of the CRs with should come only from a few sources, since the short time delays implied by the small distance to the sources allow only a few bursts to be seen at any given time. At lower energies many more sources are observable due to both the larger distances over which the CRs can propagate and the much longer time delays. Therefore, while at the highest energies bursting sources should be identified from only a small number of CRs from their coincident directions, many more CRs need to be detected at low energies to identify sources. Recently, the AGASA experiment reported the presence of 3 pairs of CRs with angular separations (within each pair) , consistent with the measurement error, among a total of 36 CRs with (Hayashida et al. (1996)). The two highest energy AGASA events were in these pairs. Given the total solid angle observed by the experiment, , the probability to have found 3 pairs by chance is ; and, given that three pairs were found, the probability that the two highest energy CRs are among the three pairs by chance is 2.4%. Therefore, this observation favors the bursting source model, although more data are needed to confirm it.
The detailed spectral and angular distribution of CRs from an individual source, expected in a bursting source model, depend on the structure of the IGMF and on the details of the energy loss processes. This shall be examined in this Letter, confining the discussion to sources observed at energies below the pion production threshold, . Sources at higher energy will be treated in a subsequent publication.
2 The Propagation of CRs through the Magnetic Field
2.1 Large Scale Fields
Let us first consider the case where the typical displacement of the CRs is much smaller than the correlation length, . In this case, all the CRs that arrive at the observer are essentially deflected by the same magnetic field structures. Therefore, if the CR energy loss during propagation was perfectly continuous and deterministic, all CRs with a fixed observed energy would reach the observer with exactly the same direction and time delay. At a fixed time, the source would appear monoenergetic and point-like, with the CR energy decreasing with time as , and the deflection from the true source position increasing as . However, the fact that CRs suffer random energy losses as they propagate, owing to the production of pions and pairs in interactions with the microwave background, implies that in reality the image should be blurred both in arrival direction and energy. Due to the random energy loss, at any distance from the observer there is some finite spread in the energies of CRs that are observed with a given fixed energy. Since the deflection due to the magnetic field is everywhere inversely proportional to the CR energy, the fractional variation of the total deflection, , and of the time delay, , are similar to the characteristic fractional energy spread along the path, . The spread in energy of CRs observed at a given time is also .
The brightest sources of CRs with should be very nearby. The typical distance to the brightest source observed over an energy range around , with , is the radius of a sphere within which the average time between bursts is equal to the characteristic time delay ; i.e., is determined by where is the burst rate per unit volume. Thus,
| (1) |
where and . The sources of the events that have been detected above must lie within , requiring . From eq. (1) we see that at lower energies the brightest sources will be even closer. These CRs from bright sources will suffer energy loss only by pair production, because at eV the mean-free-path for pion production interaction (in which the fractional energy loss is ) is larger than . Furthermore, the energy loss due to pair production over propagation is only .
The fractional energy loss in a pair production interaction is . The average total energy loss after interactions is , and the dispersion in the energy loss is . The spectral width and apparent angular size of bright sources at , for which , are therefore very small, . On the other hand, CRs of much higher energy can lose a substantial fraction of their energy in a single pion production, resulting in a large dispersion in the energy loss for a propagation distance of a few tens of megaparsecs. This implies that the width of the energy spectrum and the angular size of the image should be much wider at high energies. Detailed predictions of the spectral shape due to the random energy loss caused by pion production will be presented in a subsequent publication.
2.2 Small Scale Fields
Let us now consider the case where the typical displacement of the CRs is much larger than the correlation length, . In this case, the deflection of different CRs arriving at the observer are essentially independent. Even in the absence of any energy loss there are many paths from the source to the observer for CRs of fixed energy that are emitted from the source at an angle relative to the source-observer line of sight. Along each of the paths, CRs are deflected by independent magnetic field structures. Thus, the source angular size would be of order and the spread in arrival times would be comparable to the characteristic delay , leading to even when there are no random energy losses.
To allow for an analytical treatment of the case , we consider CRs below the pion production threshold and neglect their energy losses due to pair production (which is, as shown above, a good approximation for bright sources of CRs with ). Since each CR arriving at the observer follows a different path, different CRs sample different “realizations” of the IGMF. The distribution of observed deflections and time delays for an observer at a distance from the source is therefore given by the probability density for a CR propagating to a distance to encounter a magnetic field structure that would cause a time delay (where is the time since the CR was emitted) and deflection angle relative to the direction to the source.
Let us divide in small intervals such that . The deflections in different intervals are independent, since is larger than the field correlation length. The evolution of the probability density may then be described as a Markov process that changes at each interval . Since the number of independent deflections, , is very large, the relative change in over is small, and we may approximately describe its evolution by a differential equation obtained by formally taking the limit .
In what follows we replace the variable with , . Since , is the probability per unit solid angle. In the absence of magnetic field, as a CR moves to a distance its angle decreases by , i.e., , and its time delay increases by . Thus, in the absence of magnetic deflection the evolution of is determined by
| (2) |
where the right-hand-side is due to the change in the volume element for CRs moving from to . In the presence of an IGMF, a CR has a probability to be scattered by an angle to while propagating a distance . CRs moving at an angle after a scattering by an angle may have been scattered from a direction obeying , where is the angle over a circle of radius around the direction . The average over this circle of is , and the average of is (where we use the approximation , valid for our case of many scatterings along the CR trajectory). Therefore, the difference between the number of CRs scattered into and the number scattered out of this direction over the interval is , where denotes the average of over the distribution . Combining this expression with (2), our final equation is
| (3) |
where . The effect of the magnetic field is therefore to introduce a “mean scattering rate,” . If the IGMF is characterized by a single correlation length , then , where the factor accounts for random field orientations. If the field fluctuates on a range of scales , with some power spectrum , then
| (4) |
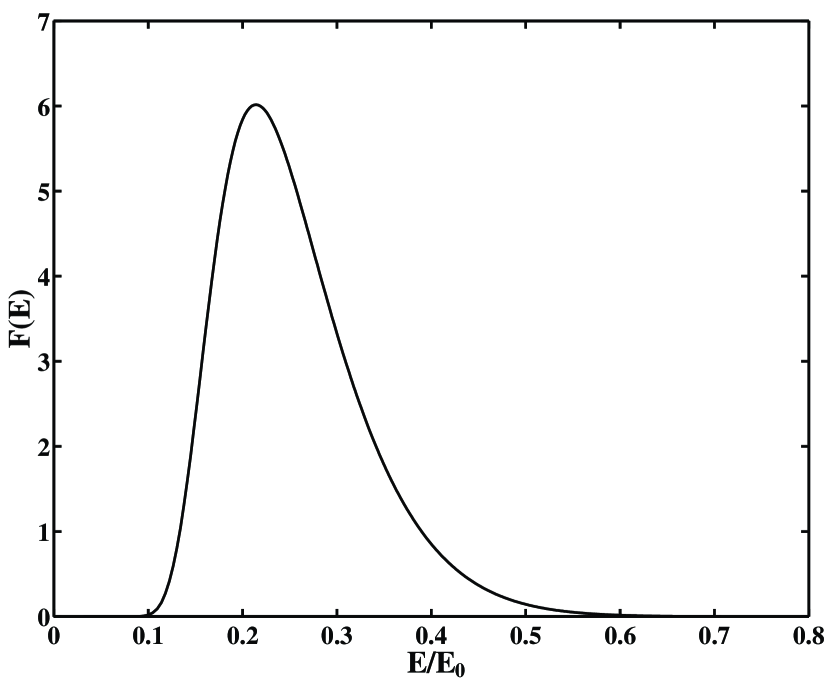
Equation (3) is analogous to the equation describing the propagation of photons in a scattering medium in the limit of infinite optical depth, and was derived for the latter case by Alcock & Hatchett (1978), who presented an analytical solution (their eqs. [21]-[24]). Of particular interest to us is the integration of over , giving the distribution of time delays. We can express this in terms of the energy distribution of CRs with fixed time delay, which is the most relevant observable quantity given the long time delays expected in the bursting model. The differential flux received from a burst, which produced CRs in the energy range to , is:
| (5) |
where . Current observations require the generation spectrum to satisfy with (Waxman 1995b ). Therefore, on the right hand side of (5) is approximately constant, and the differential spectrum of the source is given by , presented in Figure 1. For this spectrum, the ratio of the rms CR energy spread to the average energy is .
The form of the angular image of CRs is also predicted. The angular distribution of CRs of a fixed energy averaged over all time delays is a gaussian, with . The angular distribution of CRs at a fixed time delay averaged over all energies, which is more interesting given the long time delays expected, is approximately given by , where is the average energy of CRs observed at a fixed time delay . The joint energy and angular distribution of CRs at a fixed time delay, which may be observable, can also be predicted in detail from the solution of Alcock & Hatchett (1978).
3 Discussion
We have shown that in a bursting source model the spectral shape and angular size of bright CR sources below the pion production threshold, , are sensitive to the ratio of the typical displacement of CRs, , and the IGMF correlation length . The spectral width and angular size are small, , in the limit , and large, , in the opposite limit . The spectral shape of the sources in the limit is given by eq. (5) and shown in Figure 1. In this limit, the number of CRs observed at a fixed time delay with deflection to relative to the direction to the source is approximately proportional to , where is the average energy of CRs observed at the specified time delay. If magnetic fields were strong in intermediate scales, , a single source could have several images with angular separation , which should be magnified and distorted. As in the case of gravitational lensing, an odd number of images should be expected with highly magnified images appearing in merging pairs near caustics of the magnetic deflection mapping. Each image could have a narrow energy spectrum , but usually the magnetic field on much smaller scales would be important in widening each image both in angle and energy. The average energy of CRs in different images would differ by .
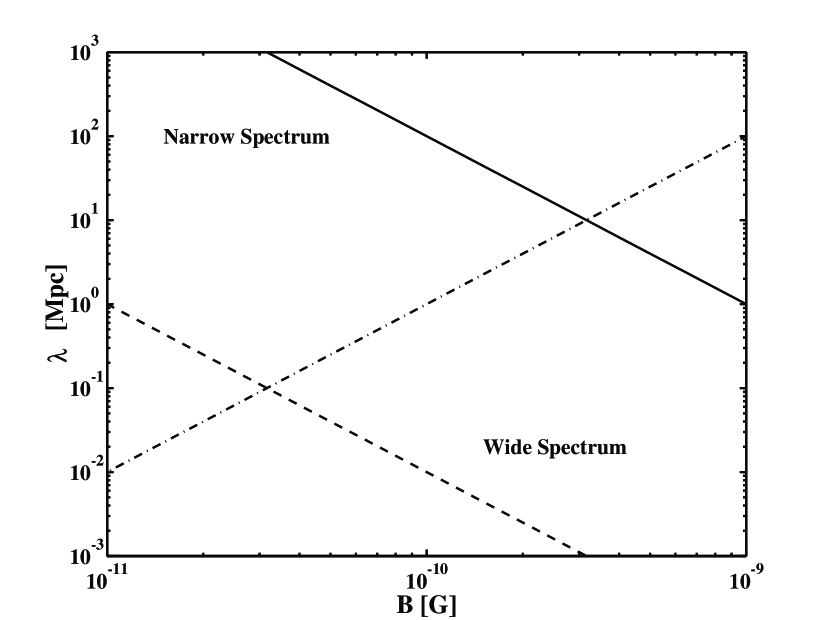
The condition may be written as
| (6) |
Thus, measuring the spectral width of bright CR sources would allow to constrain the IGMF parameters provided the distance scale to the bright sources is estimated. In a bursting source model, the typical distance to the sources is proportional to , where is the bursting rate per unit volume and the characteristic time delay (cf. eq. [1]). Current observations require , which sets an upper limit to the distance of the brightest sources, . Future CR experiments would allow to obtain better constraints on by analyzing the number of sources at different energies (Miralda-Escudé & Waxman (1996)). Furthermore, if bursts originate in galaxies (as it seems likely if they are GRBs), their parent galaxies should be identified given that they are nearby, and the distance to each burst would then be known. For the GRB model, where , the upper limit on from Faraday rotation measures, (Kronberg (1994), Vallee (1990)), sets an upper limit to the time delay and a lower limit to the distance scale . Figure 2 shows the line in the plane together with the Faraday rotation upper limit and the lower limit required in the GRB model to allow . The line divides the allowed region in the plane at . Thus, measuring the spectral width of bright CR sources would allow to determine if the field correlation length is much larger, much smaller, or comparable to .
The proposed Auger experiment (Cronin (1992); Watson (1993)) should be able to detect many CRs from individual sources at energies of a few times eV. In fact, the number of CRs produced by the brightest source at energy and detected by a detector with area and exposure time is approximately , where is the number of CRs produced by the source above and the fraction of time during which the source is within the field of view. Using eq. (1) and , as required by current observations (Waxman 1995b ), we find . The Auger experiment will have detectors and energy resolution of , giving an expected number of events detected from individual bright sources (assuming a burst rate comparable to that of cosmological GRBs), which should easily allow to determine the spectral width of the sources. Furthermore, with an expected angular resolution of , the apparent angular size of the sources may be measured in the case : the angular size of the brightest source at energy is expected to be . Measuring the angular size of the sources would allow to break the “degeneracy,” and to estimate separately the characteristic time delay and the burst rate .
Finally, we note that the deflections due to the magnetic field in the Milky Way will be superposed with those of the IGMF. While the additional time-delay caused by our galaxy is negligible, the deflection is not. For example, for a field over a scale of Kpc and a CR energy eV, the deflection is . This means that if the IGMF is present only on small scales, large coherent deflections could still be caused by the galactic field, which could produce elongated images with the CR energy being correlated with the observed deflection from the true source position, as well as multiple images of individual bursts.
References
- Alcock & Hatchett (1978) Alcock, C., & Hatchett, H. 1978 ApJ, 222, 456
- Bird et al. (1994) Bird, D. J., et al. 1994, ApJ, 424, 491
- Cohen & Piran (1995) Cohen, E. & Piran, T. 1995, ApJ, 444, L25
- Cronin (1992) Cronin, J. W. 1992, Nucl. Phys. B (Proc. Suppl.) 28B, 213
- Elbert & Sommers (1995) Elbert, J. W., and Sommers, P. 1995, ApJ, 441, 151
- Fishman & Meegan (1995) Fishman, G. J., & Meegan, C. A. 1995, ARA&A, 33, 415
- Hayashida et al. (1996) Hayashida, N., et al. 1996, University of Tokyo ICRR-report-361-96-12
- Kronberg (1994) Kronberg, P. P. 1994, Rep. Prog. Phys. 57, 325
- Milgrom & Usov (1995) Milgrom, M. & Usov, V. 1995, ApJ, 449, L37
- Miralda-Escudé & Waxman (1996) Miralda-Escudé, J., & Waxman, E. 1996, ApJ, 462, L59
- Sigl, Schramm & Bhattacharjee (1994) Sigl, G., Schramm, D. N., & Bhattacharjee, P. 1994, Astropar. Phys. 2, 401
- Vallee (1990) Vallee, J. P. 1990, ApJ, 360, 1
- Vietri (1995) Vietri, M. 1995, ApJ, 453, 883
- Watson (1993) Watson, A. A. 1993, Inst. Phys. Conf. Ser. 133 (Int. Conf. on Nuclear and Particle Phys., Glasgow), 135
- (15) Waxman, E. 1995a, Phys. Rev. Lett. 75, 386
- (16) Waxman, E. 1995b, ApJ, 452, L1
- Waxman & Coppi (1996) Waxman, E., and Coppi, P. 1996, ApJ, 464, L75
- Yoshida et al. (1995) Yoshida, S., et al. 1995, Astropar. Phys. 3, 151