Eclipsing Binaries in the OGLE Variable Star Catalog.I.
W UMa-type Systems as Distance and Population Tracers
in Baade’s Window
Abstract
The paper demonstrates that the W UMa-type systems have a potential of playing an important role in studies of the Galactic structure due to their high spatial frequency of occurrence, ease of detection and reasonably tight absolute-magnitude (period, color) calibration.
An algorithm, based on Fourier decomposition of light curves, permitted to define a sample of 388 contact binaries with well observed light curves, periods shorter one day and with available colors (the R-sample), from among 933 eclipsing binary systems in the OGLE variable-star catalog for 9 fields of Baade’s Window. The sample of such systems which was visually classified by the OGLE project as EW-type binaries (the O-sample) is by 55% larger and consists of 604 stars. The algorithm prevents inclusion of RR Lyr and SX Phe stars which in visual classification might be mistakenly taken for contact binaries with periods equal to twice their pulsation periods.
Determinations of distances for the contact systems, utilizing the absolute-magnitude calibration and the map of reddening and extinction of Stanek (1996), indicate an approximately uniform distribution of contact binaries almost all the way to the Galactic Bulge (there is a hint of a gap at 6.5 to 8 kpc), with 9 well observed systems identified in the Bulge. The distances have been derived assuming two hypotheses: (1) extinction extends uniformly all the way to the Bulge at kpc or (2) extinction is truncated at kpc. Analysis of the period–color diagram favors the latter hypothesis which has been assumed throughout the paper. The uniform distribution of the contact systems with distance, implying heights up to pc, as well as a tendency for their colors to be concentrated in the region normally occupied by old Turn-Off-Point stars, confirm the currently held opinion that contact binary systems belong to the old stellar population of the Galaxy.
A first attempt to construct the luminosity function for contact binaries has been made for samples defined by distances of 2 and 3 kpc. The apparent density of contact systems is about systems per pc3, with the main uncertainty coming from the definitions of the R- and O-samples. If the spatial density (corrected for undetected low-inclination systems) is two times higher than the lower limit of the above range, and equals systems per pc3, then one star among 400 Main Sequence stars is a contact system; however, this number includes M-dwarfs among which contact binaries do not occur. An independent estimate of the apparent frequency, relative to nearby dwarfs with colors similar to those of the contact binaries, obtained in the volume-limited sense to 2 and 3 kpc, is one contact system per about 250 – 300 Main Sequence stars, which agrees well with the recent estimates for old open clusters and their background/foreground fields.
1 INTRODUCTION
The Optical Gravitational Lensing Experiment (OGLE) is a long term observing project aimed at detecting invisible matter in our Galaxy by detection of gravitational microlensing events in the direction of the Galactic Bulge. It has been giving a rich spectrum of by-product results, among them excellent color–magnitude diagrams (Udalski et al. 1993) which have provided interesting insight into the structure of the Galactic Disk (Paczyński et al. 1994a = P94), non-axiality of the Bulge (Stanek et al. 1994, Paczyński et al. 1994b), and maps of the interstellar extinction in Baade’s Window (Stanek 1996 = S96).
The first utilization of another advantage of this dataset, of its systematic temporal coverage permitting detection of very large numbers of periodic variable stars, was presented by Rucinski ( 1995a = BWC) in a preliminary analysis of 77 contact binaries, from the first instalment of the periodic variable-star catalog for the central Baade’s Window field (Udalski et al. 1994). Since then, the OGLE Project released the Catalog of periodic variable stars in the remaining 8 fields of Baade’s Window (Udalski et al. 1995a, 1995b), with data now available for the whole field. This database will be from now on called the Catalog.
The present paper is basically a full version of the BWC study for whole Baade’s Window and addresses the same issue, which is the utility of contact binaries (or W UMa-type or EW-type systems, as we will call them below) as distance tracers in Galactic structure studies. From among all 933 eclipsing systems, 676 systems with periods shorter than one day were first selected, but this number was further substantially reduced to 388 by acceptance as a contact binary through a strict criterion based on the Fourier decomposition of the light curves (Section 3) and availability of colors. This selection was entirely independent of the original classification as EW-type systems in the Catalog. We note, that among 662 EW systems in the Catalog, 604 systems have colors and periods shorter than one day, so that our (impersonal) selection of 388 systems imposed more severe restrictions on the acceptance as a contact binary than the OGLE classification.
The present paper utilizes the fact that sizes of contact binaries can be estimated from their periods so that – with color information – absolute magnitudes can be derived permitting usage of these systems as distance tracers (BWC, Rucinski 1994a = R94, Rucinski 1996 = R96). Although functional dependencies of dynamical time scales are underlying absolute-magnitude calibrations for both, the RR Lyrae-type stars and the contact binaries, the latter are probably less good standard candles than RR Lyrae stars, mostly because of the relatively strong color dependence (but infra-red observations might help here). Depending on the combination of the color and period, the absolute magnitudes for contact binaries can be estimated to 0.2 – 0.5 mag. The spread for the RR Lyrae stars of a given metallicity is some 2 – 4 times smaller (cf. recent results for M5 by Reid 1996), although for large, inhomogeneous samples it might be substantially larger. We note that the small spread in luminosities of the RR Lyrae stars is simply due to their occurrence in a very small region of the stellar parameter space. In this respect, the contact binaries have a great advantage: They occur with high frequency (as we show later, in the solar neighborhood, they are some 24,000 more common than RR Lyrae stars!) and, by being slightly evolved, they trace the most common Main Sequence population to greater depths than do ordinary single stars. Also, apparently their luminosities are relatively insensitive to (Rucinski 1995b = R95). Besides, the RR Lyr stars are present only in very old stellar systems, older than about 10 Gyr, whereas contact binaries seem to start appearing in open clusters with ages around 1 Gyr (Kałużny & Rucinski 1993, Rucinski & Kałużny 1994). The luminosity calibrations for the contact binaries do have weaknesses related to occasional occurrence of spots on some systems and lack of good calibrators over the whole period–color sequences (Rucinski 1996), but – hopefully – the large numbers of these systems in the micro-lens databases might help compensate for these deficiencies or reveal trends which could be explored in more in-depth studies.
Origins and evolution of contact binary stars are still poorly understood although their low angular momenta, presence in old open and globular clusters (Kałużny & Rucinski 1993, Rucinski & Kałużny 1994) and space motions (Guinan & Bradstreet 1988) suggest formation by a relatively slow process of coalescence of close, detached binaries through magnetic-wind induced loss of angular momentum. Advanced evolution is particularly strongly suggested by occurrence of contact binaries among Blue Straggler stars in old open and globular clusters (Mateo 1993, 1996). There have been several general reviews on the subject of contact binaries, the most recent ones by Rucinski (1993a) and Eggleton (1996). Of interest for this work are results of recent systematic searches in stellar clusters which have led to an upward revision of the apparent frequency, both in clusters and in the Galactic field, to about one contact system per 280 stars (R94), with the implied spatial frequency (corrected for undetected systems at low orbital inclinations) of about 1/140, in agreement with entirely independent estimates of Mateo which were based on numbers of stellar X-ray sources (Hut et al. 1992). The contact systems are also recognized as extremely important for dynamical evolution of globular clusters (Hut et al. 1992).
There exists an abundance of light curve data for many bright contact binaries in the sky, but the material is highly inhomogeneous in terms of accuracy as well as sampling of the parameter space. Perhaps the most troublesome is lack of standard color data even for quite bright W UMa-type systems. The new micro-lensing samples contain more uniform data than presently available for field systems, the reason being that the latter in their majority have come from very non-systematic searches of the sky, with equally non-systematic follow-up studies. The General Catalogue of Variable Stars lists 562 contact systems, but for only 510 of them are the periods reliably known, whereas moderately good photometric data exist for some 130 systems, but again only for half of that in standard photometric systems. Thus, although the amount of information for each system in the OGLE Catalogue is limited, its quality is uniform or at least controllable, and can be easily subject to statistical scrutiny.
Section 2 of the present paper contains a brief assessment of the database for eclipsing systems in the Catalogue. Section 3 describes an algorithm used to select a sample of contact binaries used as a primary dataset in the paper (the R-sample). Section 4 discusses estimates of observed and absolute magnitudes of the systems and then of their distances. Section 5 discusses implications of the present results for our understanding of the contact systems and Section 6 gives a summary of the paper.
2 ECLIPSING BINARY SAMPLE
The sample of eclipsing binaries in the OGLE Catalogue (Udalski et al. 1994, 1995a, 1995b) contains 933 entries. The data listed in the Catalogue consist of: the and coordinates, , , , the period and zero epoch, and the light curve (typically 100 – 190 points) in . The sample contains systems with , but selection effects against discovery might be expected at fainter magnitudes due to progressively stronger blending of images. A histogram of magnitudes at maximum light, , shown in Figure 1, indicates an increase in numbers of detected eclipsing systems with decrease in brightness which is surprisingly consistent with the uniform-density, empty-space law of “4-times-per-magnitude” increase. A clear deficiency relative to this law shows up for and an abrupt cut-off takes place at , close to the stated limit of the catalog at . Possibility of selection effects at fainter magnitudes led us to consider in Section 4 the numbers of contact systems in relation to the total numbers stars in Baade’s Window rather than in absolute sense.
The histogram of amplitudes shown in Figure 2 indicates that selection effects against discovery might be present for amplitudes smaller than about 0.3, although this distribution cannot be obviously separated from the intrinsic distribution of the variability amplitudes.
The random errors in the data were estimated by evaluating spread in light curve points at phases close to phase 0.25 for all eclipsing systems in the Catalog. This was done in a re-normalization step, while fitting the light curves by Fourier cosine series, as described in the next section. The distribution of errors with brightness is shown in Figure 3 where it is separated into four magnitude bins. From inspection of this figure, we conclude that typical random errors in (per observation) were about 0.02 for and increased somewhat to about 0.03 – 0.04 for .
3 AUTOMATIC CLASSIFICATION OF CONTACT BINARIES
The OGLE Project, when releasing the variable-star Catalog attempted a visual classification of variability on the basis of morphology of light curves. While separation of contact binaries from other eclipsing systems in most cases does not present problems, it would be useful to have an automatic classifier which would be impersonal, easy to repeat and – if need occurs – equally easy to modify. We would also like to have a simple way of removing poorly observed systems as these might be stars of other types (spotted, pulsating) or might have poor determinations of periods. Such a classifier has been constructed here on the basis of the Fourier decomposition of light curves. As was discussed in Rucinski (1993b = R93), light curves of contact systems are very simple in their shape and usually only two cosine coefficients are needed to adequately describe a light curve. Although this revealed a basic difficulty of extracting several geometric elements from light curves of such a low information content, this is a convenient circumstance for large databases of variables observed with moderate accuracy, as in the case of the OGLE Catalog.
As was described in R93, comparison of the cosine coefficients and permits a crude estimate of the degree of contact which is weakly dependent on the inclination and mass-ratio of the system. This property was noted already in Rucinski (1973) and explained through different sensitivity of and to the global distortion of the contact structure and to the more localized eclipse effects. However, it remained unclear whether the Fourier coefficients would retain usefulness for detached systems as no single database existed which could be used to compare – in large numbers – light curves of detached and contact eclipsing system. The usefulness of the approach has been proven positively here by application of the Fourier coefficients to the whole sample of the OGLE eclipsing systems.
The light curves of all 933 systems were analyzed exactly following the prescriptions in R93 and the results in the plane are shown in Figure 4. Note that the light curves for the Fourier analysis were expressed in light units and each time a new normalization was done for phases around 0.25 (at least 10 observations). This normalization permitted to estimate spread of observations at these phases and gave information of measurement errors, as shown in Figure 3 in previous section.
In Figure 4, the systems have been marked differently following the OGLE classification: EW or contact binaries of the W UMa type (filled circles), EB or systems showing Beta Lyrae light curves with unequal minima (open circles), and EA and E detached binaries and binaries of uncertain type (crosses). A theoretical envelope based on the results in R93 for the inner (marginal) contact is shown as a continuous curve (see below). The EW-type systems are indeed confined below the theoretical limit for marginal contact (with a well-known tendency for weak contact), while most of the systems classified as detached eclipsing (EA, E and other uncertain, 250 systems in total) are above this limit. The relatively small number of systems classified as Beta Lyrae-type (EB, 21 systems) basically follow the division line between the detached and contact groups. In what follows we simply disregarded this group and included those systems in the contact-binary sample which passed the Fourier filter. We note that some genuine contact systems show unequal minima indicating poor thermal contact. This matter will remain open until the color curves become available, as then the correlated behaviors of the coefficients for the light and color curves could be used as a detection criterion for EB systems.
Once the color-curves become available, they will provide useful criteria to guard against inclusion of pulsating stars with periods equal to twice their pulsation periods. At present, we rely entirely on the Fourier coefficients. In particular, negativity of prevents inclusion of the RR Lyrae stars, although the RRc-subclass might occasionally create problems for less accurate light curves. As an illustration, we show in Figure 4 the coefficient pairs for the pulsating stars in one (central) field of the OGLE project.
The envelope for the inner contact in Figure 4 can be approximated very well by a following simple relation (cf. Figure 6 in R93): , where both coefficients are negative. In this paper, position relative to the inner-contact curve is the main criterion for classifying a star as of the EW-type (below the curve) or other eclipsing (above the curve). This criterion was supplemented by one measuring the over-all quality of fit by a simplified light curve consisting only of 5 Fourier terms: . The fit was usually excellent for contact binaries, whereas for detached binaries it showed large systematic deviations which made the formal errors of the coefficients very large and thus basically useless in the analysis. Typical fits are shown in Figure 5 for the first EW and EA systems of the OGLE sample, V4 and V19, in the field BWC111Hereinafter, for identification of individual systems, we will be using designations of the following type: #, where is the field number (for the Central field ), and is the variable number in the field..
The diagrams for different ranges of the mean standard errors of the 5-term fits, in light units, are shown in Figure 6. Whereas 525 systems with periods shorter than one day passed the filter, the requirement that the overall Fourier fit be better than 0.04 eliminated most of the detached and many poorly-observed contact systems leaving 404 objects. Among these, 388 systems have colors at maximum light. The sample of contact systems selected in this way will be, from now on, called the “restricted” sample or the R-sample. We feel that although this sample might have been somewhat conservatively selected, it does contain only genuine and well-observed contact systems. Most of analyses were done for this sample. The sample of EW systems selected by the OGLE project, limited to periods shorter than one day and with available colors consist of 604 systems and, from now on, will be called the O-sample. Spot checks of those systems which belong to the O-sample, but were rejected for the R-sample fully confirm that, indeed, these cases should not be considered, either due to large measurement errors (most probably due to seeing-dependent blending of images) or to light curves with partial phase coverage.
A more extensive discussion of information contained in light curves of the eclipsing binaries in the Catalog is planned for a separate paper of this series.
4 CONTACT BINARY SYSTEMS AS DISTANCE TRACERS
4.1 The Observed Color–Magnitude Diagram
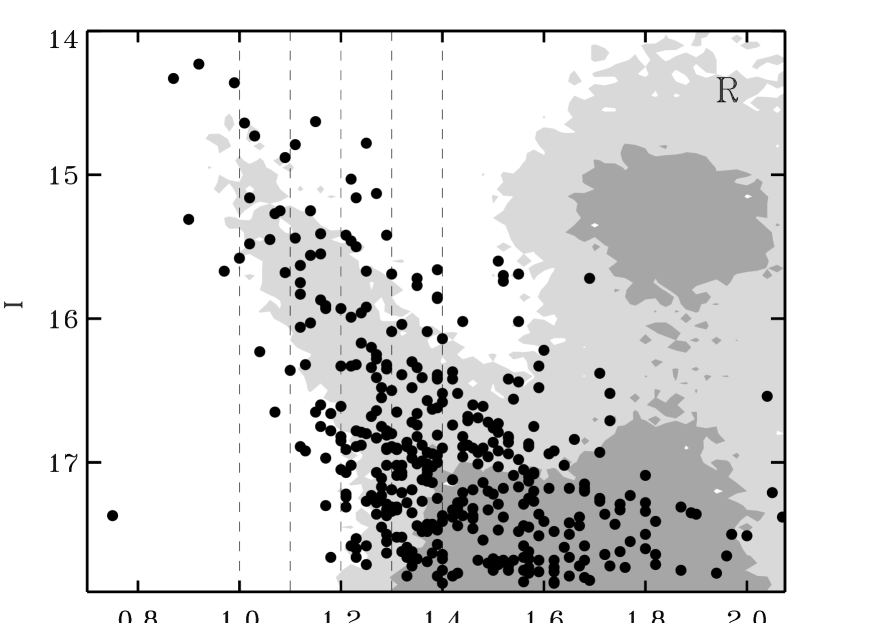
Several elements are needed to derive distances to the contact systems. In addition to the observed maximum magnitudes and colors, and , one needs values of reddening and extinction as well as absolute-magnitudes derived from a calibration utilizing colors and periods. These details will be described in the subsequent subsections. However, much information is already contained in the observed color–magnitude diagram (CMD) for the contact system which is shown in Figure 7. This diagram shows systems of the R-sample, together with a schematic representation of the distribution for normal stars.
Position of one blue system in Figure 7 at and , #6.121 should be noted. Although its light curve seems to be well defined, a closer examination of the data by Dr. Andrzej Udalski revealed that its color might be affected by image blending. Another blue system in the O-sample, #4.177 with , has been rejected by the Fourier filter because for it was positive. However, its color seems to be genuinely blue. Both systems fall outside the range where our absolute-magnitude calibration is strictly applicable so that very large estimates of their distances might be entirely incorrect.
Besides those two blue systems, we also see unusually red systems or systems with very short orbital periods. In the R-sample, systems #0.160, #3.053, #5.143, #6.123, #7.112, #8.072 have . Such very red colors are unusual for contact binaries. At this point, we might only hope that these are not indications of a systematic deficiency in the color transformations in the OGLE data at the red end of the color distribution. Turning to very short periods: The system #4.040 has the orbital period of 0.228 day with , whereas the system #3.038, with the orbital period of only 0.198 day and 222This extremely interesting system was pointed to the author by Andrzej Udalski before start of this study. must remain in the O-sample, as it has not passed (marginally) the Fourier filter with and ; these coefficients suggest a detached, but very close system of strongly distorted, late-type components. These special cases will be a subject of another paper of this series. Here, we concentrate on normal systems and limit ourselves to time-independent quantities, temporary disregarding outliers in the sample.
A schematic outline of the location of the majority of stars in the OGLE fields in the color–magnitude diagram is shown in Figure 7 by a shaded area. Spatial distributions of these normal, predominantly single stars, were analyzed in P94 in terms of the Galactic structure in the direction to the Bulge. The slanted sequence of relatively blue stars was interpreted there as Main-Sequence stars of a young population, but this interpretation has been recently replaced (Kiraga, Paczyński & Stanek 1996; see also Bertelli et al. 1995 and Ng et al. 1996) by postulating that the sequence is formed by old, Turn-Off-Point stars, progressively reddened with distance. The contact binaries scatter around this sequence in Figure 7, so that any inferences that we could establish for the contact binaries should possibly also relate to these stars as well.
To visualize the relation of numbers of the W UMa systems to normal stars, the next Figure 8 shows sections of equal color vertically through the CMD in Figure 7. These sections were defined as bands 0.1-magnitude wide in in this part of the CMD where we see most of the contact binaries, i.e. within and . The sample of normal stars in Figures 7 and 8 is the one used by Udalski et al. (1993) and P94 in their discussions of the color–magnitude diagrams. These CMD-stars were selected for best photometry and therefore represent a sample of different stars than those which were studied for periodic variability. An arbitrary normalization factor of 100, used in Figure 8, was apparently approximately a correct one to show both, the CMD stars and the contact binaries, in one figure. In fact, the plots directly show that the frequency of occurrence of contact binaries in our sample is similar to, but exceeds, the apparent frequency for old open clusters and for Milky Way background/foreground, estimated from the recent CCD surveys (R94) at about one W UMa system per 280 stars. Although, for the first time, we have here a luxury of being able to obtain the apparent frequency in color–magnitude bins, and not just by relating numbers of detected W UMa-type systems to numbers of observed stars, we should remember that (1) the sample of the CMD-stars is biased toward good photometric quality with many faint stars (estimated here at 45%) missing from the statistics, and (2) contact binaries are intrinsically brighter than normal stars, so that the samples are not co-spatial. In spite of these qualifications, the shapes of the distributions in Figure 8 are the same to the accuracy of statistical uncertainties (the reduced ) when the distributions are simply normalized to the total number of systems in each color band. In the four 0.1-mag wide color bands vertically across the color–magnitude diagram in Figure 7, from blue to red we have 13, 33, 81 and 97 contact binaries of the R-sample, which are out-numbered by CMD-stars by factors of , , and , where the uncertainties are given by Poisson errors.
We will return to the matter of relative frequency in Sections 4.8 and 4.9, in discussions of a volume-limited sample, after presenting determinations of absolute magnitudes and distances. To determine these latter quantities, an iterative scheme was applied which involved several components. These will be discussed in the next sub-sections.
4.2 Absolute Magnitude Calibration
The sample of standard W UMa-type systems which was used to derive the calibration was basically the same as in the previous related papers (BWC, R94, R95), but the data have been somewhat improved. The final calibration (Rucinski 1996, unpublished) is only slightly different from the one which was used in BWC. It is based on 19 systems: 3 with known trigonometric parallaxes, 12 in high-latitude open clusters and 4 in visual binaries with fainter companions which can be placed on the Main Sequence. Relative to BWC, the major improvements are in that (1) three systems in M67 and one in Praesepe have now measured colors which confirm those previously estimated from colors, (2) new observations of the CT Eri ( day) in a visual binary permit extension to slightly longer periods than before, (3) systems in NGC 188 with colors transformed from are de-emphasized as some important systems there show unexplained deviations: ER Cep and ES Cep are too bright by mag, and the important evolved system V5 is too faint by mag, probably reflecting poor contact (its relatively red color should be even redder in good contact). According to the most recent proper-motion study by Dinescu et al. (1996), ES Cep is not a member of NGC 188. At present, the calibration extends over the following ranges: day, and . Applicability of the calibration beyond the above ranges is unknown at this time. Because of this limitation, figures subsequent to Figure 10 distinguish (by filled circles) those cases where, after de-reddening, systems fall within the strict ranges in all three quantities.
The equations giving the absolute magnitudes and the coefficients are:
with , and , and (per star). The bootstrap sampling as in R94 permitted another set of estimates, in terms of median and - ranges for the distinctly non-Gaussian distributions of the coefficients: , and . The strong correlations between the coefficients result in smaller uncertainties in than these large errors in the coefficients would imply. Monte-Carlo simulations show that within these ranges, predictions on should be good to 1- level of about and 2- level of about mag, although systematic errors are still possible, mostly because of spots on some of the late-type calibrating systems. Comparison with the previous calibrations (BWC, R95) indicates that the period coefficient is slightly larger in the absolute sense than before and that the color coefficient is smaller. Although this makes little difference for the final values of (since the terms are correlated), the new calibration is therefore somewhat less sensitive to the uncertainties in the reddening than the previous versions. We note also that the -based calibration is relatively insensitive to variations in (R95). The lines of constant are over-plotted in the period–color diagram in Figure 10 (Section 4.4).
4.3 Maximum Reddening and Extinction
To find individual values of the reddening (), extinction (), distance () and absolute magnitude (), an iterative procedure was used. This procedure will be described in Sec.4.5. It utilized maps of extinction and reddening in Baade’s Window which have been recently published by Stanek (1996; see also Woźniak & Stanek 1996). This excellent tool permits estimates of maximum values of both quantities in this complex region of strongly variable and patchy interstellar absorption. Extinction in the -band was found from: . Both, and , are indeed the maximum values as they were estimated in S96 from the Red Clump stars in the Bulge at about 8 kpc: We do not know the actual values of and for locations of our systems in space except that they should fall somewhere between zero and these largest values at some distance . This distance would measure the effective thickness of the absorption layer and, by definition, should be smaller than the distance to the Bulge, here set at 8 kpc.
Although, following S96, independent values of reddening and extinction were used in most analyses, for some simplified estimates that will follow, was sometimes assumed. An approximate average for the central portion of Baade’s Window is (Paczyński et al. 1994a), hence and . These median values are a bit smaller than the modal ones of about 0.65 and 1.0, respectively. However, as demonstrated in S96, the range in extinction over the whole area is much wider, , so that allowance for positional dependence should substantially improve the quality of the data over an assumption of an average extinction.
The input data for each star were: the position (, ), the observed magnitude (), the observed color () and the orbital period . Two independent quantities were taken from the S96 maps: the maximum reddening and the maximum extinction . Both have been derived by two-dimensional interpolation in the extinction maps for all systems of the sample. For 135 cases of stars outside the maps, from among 933 of the OGLE sample, all falling within 2 arc minutes of the borders, the values at edges were assumed.
4.4 The Period–Color Relation
The relation between the period and color (PC), observationally established by Eggen (1961, 1967), plays a special role in studies of W UMa-type systems. This relation is only moderately tight as it reflects evolution of some contact systems leading to longer periods and redder colors for more evolved systems. However, the short-period/blue envelope of the PC relation is particularly important as it is expected to be well defined, being delineated by the least-evolved systems. Differences in metallicities enter here and might affect the colors and location of the envelope, but as was shown in Rucinski (1995b), the color is relatively insensitive to variations in metallicity, . For the Galactic Disk stars, the range in metallicities should be confined to so that larger effects might be expected only for strongly metal-deficient systems (Rucinski 1994b). Since we have no independent information on metallicities of individual systems, this matter will be entirely disregarded here.
The shape of the short-period/blue envelope (called from now on SPBE) has been determined on the basis of data for 59 bright, nearby systems, tabulated by Mochnacki (1985) and transformed to using the Main-Sequence relations of Bessell (1979, 1990). The recent improvements of the absolute-magnitude calibration (Sec.4.2) have led to a confirmation that the the Main Sequence to transformations are basically valid for contact binary systems. It was found that the following simple, two-parameter approximation describes the SPBE very well: ; the period is in days. This expression has no astrophysical significance and is used here only for convenience. The envelope and the data are shown in Figure 9.
The period–color relation for the R-sample is shown graphically in Figure 10, with vertical reddening vectors determined through iteration described in the next sub-section. If we concentrate our attention on lower ends of these vectors, we can see that practically all systems are located substantially below the SPBE. Obviously, a large fraction of this shift is due to the reddening, but part of the shift might be also due to the evolution. We also note that the systems occupy a much wider range of periods than currently in the standard-system sample (which becomes unreliable above about 0.6 day), practically up to the (conventional) limit of one day. The long-period systems consist of relatively massive stars and are expected to evolve much more quickly than their late-type analogues so that the un-evolved envelope is particularly difficult to define for longer orbital periods. Obviously, we have no information on evolution of individual systems, which is actually unimportant for distance determinations (except that it actually helps seeing distant systems), but we can approximately correct for the reddening, using the data on maximum extinction and making an assumption on the extent of the dust layer.
4.5 Determination of Absolute Magnitudes and Distances
Two assumptions on the effective line-of-sight thickness of the dust layer, , were used: 8 and 2 kpc. The former assumed that interstellar absorption increases linearly up to the distance of the Bulge at kpc whereas the latter assumed, following Arp (1965) and P94, that beyond 2 kpc there is no further absorption. This second assumption is related to the small thickness of the dust layer in the Galaxy. It is equivalent to postulating that at the distance kpc and the galactic latitude of the BW region of , the line of sight leaves the dust layer whose half-thickness at this point is about 150 pc. Note, that the Sun is supposed to be located about 20 – 30 pc above the plane (Reid & Majewski 1993, Humphreys & Larsen 1995) so that the constraint on the dust layer thickness is even more stringent.
The iteration leading to a simultaneous determination of a distance and extinction/reddening started with an assumption of for each star and consisted of up to 4 cycles of the following steps (always leading to stabilization of to 0.01):
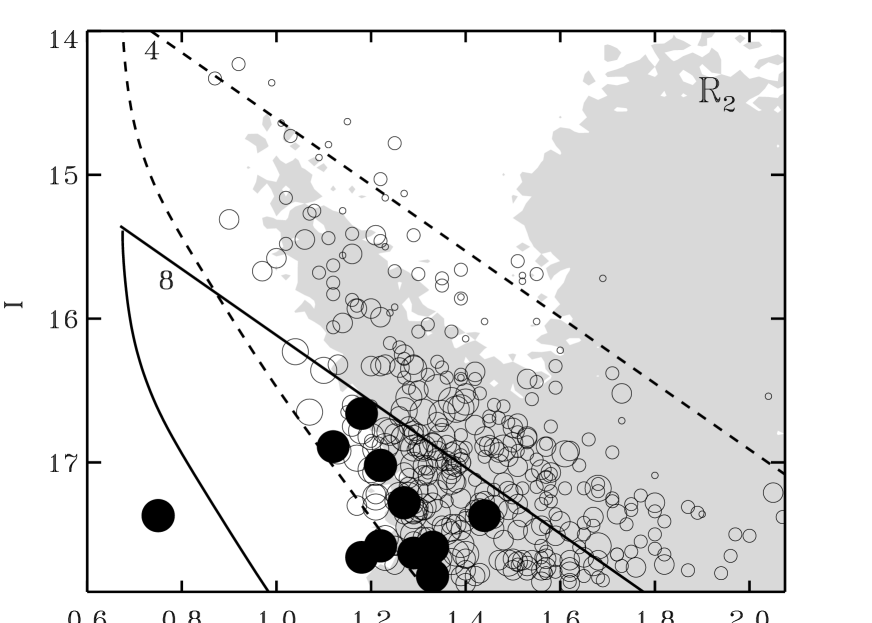
The de-reddened period-color diagrams for both values of are shown in Figure 10, where they are identified as R8 and R2. On the average, the results strongly favor kpc (or perhaps slightly more) as for kpc all systems fall far below the upper envelope. To explain this behavior in another way, we would have to assume that practically all systems are intrinsically different than in the solar vicinity, i.e. that they are strongly evolved with down- and right-ward shifts, away from the envelope of un-evolved systems. However, assumption of kpc carries also a danger of over-correcting the reddening and extinction is some individual cases. At this time, we feel that we must resort to treating the two values of as two extremes for the real spatial distribution of the interstellar dust. We note however that Ng & Bertelli (1996), have recently presented arguments (using the OGLE data) that kpc.
As we will be shown below, the results of distance determinations for both assumptions on do differ for intermediate distances, but the differences are not very large. Also, it should be stressed that many systems fall outside the strict applicability of the absolute-magnitude calibration which is marked in Figure 10 by a broken-line box. This is perhaps most evident for periods longer than 0.63 days, where not only the calibration is uncertain, but where the upper envelope for nearby systems is also practically undefined.
Inspection of Figure 10 shows that even for kpc only few systems fall above and to the left of the SPBE. This can be explained by absence of very metal-poor systems (with ) which are expected to have their own SPBE, shifted to bluer colors (Rucinski 1994b, 1995b).
4.6 Absolute Magnitudes
The CMD for the contact binaries for the R-sample and kpc, in terms of absolute magnitudes and de-reddened colors , is shown in Figure 11. This figure contains also the simplified Main Sequence fits for Pleiades, as given by Paczyński et al. (1994): , and for nearby stars, as given by Reid & Majewski (1993): for and for . The contact binaries form a band above the Main Sequence, which is about 1.5 magnitude wide. The band is somewhat wider for systems which fall outside the applicability range of the calibration (open circles).
We encounter here, for the first time, an area of concern: A large fraction of the contact systems in Baade’s Window are located in Figure 11 above the calibrating systems from the solar neighborhood, the latter tracing well the Main Sequence dependences. The location above the Main Sequence is expected for contact binaries on two accounts: (1) they are binaries hence they might show a spread within 0 – 0.75 mag, (2) at least a fraction among them should show indications of advanced evolution, as the best explanation for their origin is through the relatively slow process of magnetic-wind braking with typical time scales of several Gyr. The system V5 in NGC 188 (V371 Cep), discovered by Kaluzny & Shara (1987) (see also Kaluzny 1990), might be taken as a prototype for such evolved systems. They should be, on the average, brighter than other systems and thus should be visible deeper in space leading to their over-representation in the OGLE sample. We note that the numerous faint systems with tend to be rather uniformly spread within the whole length of the colors. An obvious over-population of the upper part of the diagram is definitely due to numerous distant systems, which are in fact very rare in space.
The systematic deviations of absolute magnitudes could be also due to application of wrong reddening corrections, as the individual values of depend on the reddening-corrected color. However, the sense of the discrepancy is wrong. Figure 11 shows the results for the preferred by us, the shorter dust length scale of kpc. For the longer scale of kpc, the discrepancy becomes larger and a gap opens up between the Baade’s Window data and the standard-system data. Since for the larger the reddening corrections are on the average smaller (the reddening climbs slower with distance), these results would imply that even for kpc, the reddening corrections are systematically slightly too small. This is inconsistent with the assumption that that data in S96 gave maximum values of the reddening.
Unfortunately, we have no way of disentangling color shifts due to evolution from those due to reddening. In particular, we cannot attribute the whole deviations in to incorrect reddening, as solutions of such an inverse problem are unstable and lead to a very large spread in . In this respect, the maps in S96 give us at least a way to confine the values of reddening within reasonable limits. The other possibility is that the colors contain a small systematic error (in the sense of being too red) for faint stars. We discuss such a possibility in Section 4.10 Here we note that a simple allowance for such an error of about 0.2 mag in does not change our conclusions, in that the deviations in between Baade’s Window and calibrating systems become only slightly smaller.
The data in the CMD are subject to truncation from below and from above in absolute magnitudes. The upper boundary at about (but dependent on color) is related to the conventional limit on the orbital period of one day. It is shown by a dotted line in the figure which was obtained by inserting day into the absolute-magnitude calibration. The lower boundary is obviously related to the magnitude limit of the sample at . From the discussion of distances (the next sub-section) we have indications that the sample is probably complete to about 3 kpc. With the average extinction in the field, the corresponding absolute-magnitude limit would be then at .
The luminosity functions in , based on systems to 2 and 3 kpc are shown in Figure 12. The faint end is by one magnitude deeper for the smaller volume, but the statistics is obviously more limited. The same functions, transformed from the to magnitudes are shown also in the lower panels of the same figure. The functions are blurred by a spread in , but have an advantage that they can be compared directly with the LF’s for other objects. In particular, when we compare them with the luminosity function for Blue Stragglers in globular clusters (Fusi Peci et al. 1993, Sarajedini 1993), which peaks at and extends between with strongly tapered ends, we see that, on the average, the contact binaries are fainter than the globular-cluster Blue Stragglers so that only the relatively weak bright tail of the LF might contain a BS contribution.
4.7 Distance Distribution
Three directly observed quantities, , and , two values found by interpolations in the maps, and , and one derived value, the distance , can be related by combining our calibration with the standard expression linking observed and absolute magnitudes:
In simplified relations below we normally set , with , but for individual systems the iterative process described above was used. We should note that accuracies of distance determinations depend practically only on uncertainties in magnitudes, colors and values of reddening as, for the present purpose, the periods are known practically without errors. Thus, the respective contributions to the distance errors , from errors in magnitudes, colors and reddening would be: , , and . Because of the size of the color coefficient in the absolute-magnitude calibration, the dependence on any possible systematic color deficiency in the calibration of the OGLE photometric system is about two times smaller than it would have been for the standard technique of absolute magnitudes estimated from the Main-Sequence fitting. In particular, for a systematic error of , the distances would be systematically wrong by %.
Results of the determinations of the distances for the R-sample and kpc are shown in Figure 13. The upper panel shows the data in the period–distance plane. In principle, the two quantities should not correlate as – barring really unusual and then extremely-interesting astrophysical causes – the detection rate should be the same at all distances for a given period. In fact, we clearly see lack of short period, low luminosity systems beyond about 2.5 – 3 kpc, as expected given the magnitude-limited nature of the sample. This way, numerous short-period systems which dominate the sky-field sample, with a peak at about 0.35 day and a sharp cutoff at 0.22 day (Rucinski 1992), are entirely eliminated for distances beyond about 3 kpc. At larger distances, rarer, long-period systems dominate in numbers. They do not show any tendency for a decrease in numbers beyond about 2.5 – 3 kpc, and seem to be visible all the way to the Bulge, with a few systems – admittedly outside the calibration applicability by about 1.5 mag – located in the very Bulge at 8 kpc. It is interesting to note a hint of a small gap between 6.5 and 8 kpc. Up to about 6.5 kpc, the distribution in logarithmic units of the distance climbs approximately linearly without showing any structure, indicating approximately flat distribution in the distance.
All 9 systems which seem to be located at the distance of the Bulge have well defined light curves and are prime candidates for a difficult, but extremely important, radial-velocity follow-up study333Two systems formally beyond 8 kpc are both questionable: #0.198, has a poor light curve, whereas #6.121 has an unusually blue color (cf.Section 4.1) so that its distance might be entirely erroneous.. The systems in the Bulge have designations: #1.121, #1.138, #1.199, #2.132, #3.094, #3.142, #3.171, #3.178, #7.163. Except #1.121 and #3.094 which have , all are fainter than . This location is very close to the Turn-Off Point of the Bulge, which is now placed by Kiraga et el. (1996) at about . In the CMD in Figure 7, all nine appear in the “corner” just below the Disk MS, with . Some of these nine systems show unequal minima.
The curved, short-period cutoff in the distribution of distant systems can be explained entirely by the existence of the SPBE on the period–color relation. In order to be visible from large distances, a system must be blue and must have a long period. Both quantities are constrained by the envelope. The upper panel of Figure 13 shows the SPBE, as in Figure 10, transformed to the distance – period plane using the average extinction , for two values of , 17.9 and 17.0. The un-evolved envelope of the period–color relation does indeed set a strong limit on observability of distant contact binaries.
Our determinations of distances have been based on a more likely assumption on the spatial distribution of reddening, with an abrupt stop in its increase at kpc. Has this assumption influenced the distance determinations to a large degree? The results for the opposite extreme of kpc, designated as R8, are shown in Figure 14. The distance distribution is generally flatter than for R2, with largest changes taking place for intermediate distances. A weak depression in increase of numbers with distance at about 3 kpc seems to be somewhat stronger than before, but – in general – the distributions of distances are similar.
The results presented in Figures 13 and 14 seemed to the author so important that he could not resist a temptation to turn back to the whole O-sample and repeat the whole procedure again (remembering that some systems of this sample might be less carefully screened for quality of data and classification than those of the R-sample). The results are shown in Figure 15, for kpc. They do not differ much from those for the R-sample. The small subset of systems in the Bulge seems to be even better defined, forming a vertically clustered grouping at kpc in the upper panel.
The relation between the distances and intrinsic colors for the R-sample is presented in Figure 16. We see a large range of intrinsic colors reaching quite red values for a few systems, but most are confined to a moderately narrow range between . The three systems which are intrinsically very red with are: #3.053, #7.112 and #8.072. At large distances, there exists an obvious limit at red colors related to faintness of red, short-period systems. On the blue side of the diagram, we do not see any influence of the selection effects related to the SPBE, since colors as blue as approaching should be permitted by the envelope. Thus, there exist no contact systems in the OGLE sample bluer than .
Having the determinations of distances, we can return to the color–magnitude diagram for the whole sample and consider positions of systems in the 3-D space of observed , and distance. This is shown in Figure 17 where distances are coded by sizes of symbols. As expected, distant systems cluster in the lower part of the diagram, with a striking excess in the “corner” below and within or . The selection effects operating here are related to two limitations of the sample. One of these is due to the cut-off of the sample at one day. For any distance, slanted straight lines (parallel to the two straight ones for 4 and 8 kpc), define two different volumes: Above the line, we see a mixture of systems at different distances, but below this line, systems must have periods shorter than 1 day to be detectable between us and the assumed distance. There exists also a limit on the period on the short side, which results from the period–color relation, as not all combinations of periods and colors are permitted, both quantities being constrained by the SPBE of un-evolved systems in the period–color relation (cf. Section 4.4). These two limitations produce – for each distance – a region on the CMD diagram where contact binaries might be observed. Two such regions are shown in Figure 17 for the distances of 4 kpc and 8 kpc. Similar “catchment areas” can be defined for other distances, by simple vertical shifts on the CMD. The areas do not impose limits on the presence of blue systems in the sample so that such systems do not apparently exist at large distances.
Finally, the distribution of the systems in the period – magnitude diagram (Figure 18) shows a tendency for clustering at faint magnitudes and long periods. This tendency can be identified with the increase in numbers of systems at large distances, close to the limits of our sample, as the observed clustering tendency approximately follows lines of equal distance and approximately equal color. It is gratifying to see this link to the distances as it indirectly proves that our interpretations are basically correct.
4.8 Spatial Density and Apparent Frequency of W UMa-type systems
As was shown in the previous section, the sample of contact systems within the “pencil-beam” view of the OGLE search is probably complete to 3 kpc. To see the sensitivity to this assumption, we will consider two distances, 2 kpc and 3 kpc, as limits for completness. For and assuming for simplicity (but inaccurately) the same absorption of , the limiting absolute magnitudes would be and , respectively. Within the volumes defined by the two limiting distances, there are 27 and 98 contact systems in the R2-sample and 39 and 141 systems in the O2-sample. The apparent density of contact systems can be simply evaluated by dividing these numbers by the volume of the spatial cone defined by the OGLE field. For the two limiting distances, one obtains then and stars/pc3 for the R-sample, and and stars/pc3 for the O-sample, where the errors come from the Poisson statistics. We note that the estimates for 2 kpc and 3 kpc are very similar indicating completness of the sample. This should not be suprising as the contact binaries show a short-period, red-color cut-off so that faint systems practically do not exist. While the densities are well defined for both distances, the essential uncertainty here comes from the initial definitions of the R- and O-samples.
The density of the contact systems is apparently high. In particular, if we multiply the above estimates of the apparent density by 2 times, to correct for undetected systems of low orbital inclinations, and compare the resulting spatial density with the local density of RR Lyrae stars, we see that the contact binaries outnumber the latter by a huge factor. The local density of all RR Lyr stars is stars/pc3 (Suntzeff, Kinman & Kraft 1991), so that for a round number of contact systems per cubic parsec, we obtain the ratio of 24,000 times. Obviously, this number is applicable only to the solar neighborhood as the RR Lyrae stars show a strong galacto-centric concentration.
While the density of the W UMa-type systems in the current sample can be relatively easily evaluated, the relative frequency requires assumptions on the sample of normal stars to use as reference. It should be remembered that contact systems with spectral types later than about K2–K5 do not exist, a limit apparently related to the existence of the sharp cutoff in the period distribution. This range of the spectral types coincides with the region where the luminosity function for normal stars climbs steeply, so that the results on the relative frequency must depend on the limiting distance or limiting absolute magnitude assumed for normal stars. By integrating the stellar density function of Wielen, Jahreiss & Krüger (1983) to limiting magnitudes of our sample (which gives about 0.01 stars/pc3) we obtain a very high spatial frequency of of W UMa systems of about 0.015 or one such a system per about 67 Main Sequence stars. However, this number critically depends on how far is the luminosity function integrated in its rising part, and carries uncertainty of about two times. It is actually easier to relate the number of W UMa systems to the total number of stars by integrating the stellar density function all the way to very small stars. Here we used the extension of the luminosity function to faint M-dwarfs by Gould, Bahcall & Flynn (1996) which drops sharply for faint stars. Such integrated total number density of 0.06 stars/pc3 is well defined. The absolute spatial frequency of the W UMa systems is then 0.0025, or one such a system per 400 stars, including M-dwarfs.
The relative frequency of the contact systems can be also evaluated using the OGLE data for normal stars. Distributions for single stars in Figures 7, 8 and 16 were based on what we called in Section 4.1 the “CMD-stars”, i.e. stars with high-quality photometry which could best define the color–magnitude diagrams. The databases for these stars were easily accessible from the ftp sources, as described in P94, so that these stars were the main basis for relating the contact binaries to normal stars. However, these CMD-stars are not useful for statistical analyses, because their numbers were biased in progressively fainter magnitude bins in a different way than stars which were analyzed for variability. For statistical applications, the full count of all stars observed and analyzed in the OGLE project would be necessary. Such a full catalog is not available at this moment. However, the first installment of the full catalog for the Baade’s Window central field has just been published (Szymański et al. 1996). As described in this paper, statistics of faint stars are strongly biased in the CMD sample, with the ratio of all stars to the CMD stars reaching a large factor of 1.90 for the cululative count of stars with . Using the new central-field data available over the ftp, we determined this ratio in magnitude intervals for the range of . In steps of one magnitude, it changes approximately as: 1.05, 1.35, 1.8, 2.15, 1.6, and peaks at reaching 2.2. The smoothed version of this ratio was applied as a correction factor for all 9 fields, in an estimate of the total number of stars that had undergone scrutiny for variability by the OGLE Project.
To estimate the total number of Main Sequence stars to the distances of and 3 kpc, we counted all CMD-stars in all nine fields with (to avoid contamination by the Red Clump giants), which fell above the Main-Sequence lines given by P94, , for the assumed values , . These numbers were corrected by the magnitude-dependent factors (as described above), giving the expected numbers of the Main Sequence stars with equal to 10065 and 33055, to 2 and 3 kpc, respectively. Using the numbers of the contact systems, as given at the beginning of this section, we obtain the apparent reciprocal frequencies (in the sense of numbers of ordinary dwarfs per one W UMa-type binary), and for both distances: and for the R-sample and and for the O-sample. Remembering that the O-sample might contain mis-classified systems of other variability types and the R-sample might be overly restrictive, we can say that in round numbers the apparent reciprocal frequency is 250 – 300. This frequency compares very well with similar estimates for the old open clusters and their background/foreground fields of and given in R94.
Our current estimates of the apparent frequency of the W UMa systems are substantially higher than estimated by Duerbeck (1984) for nearby systems at about 1000, confirming our earlier supposition (Kałużny & Rucinski 1993, Rucinski & Kałużny 1994 ) that the sample of bright, field systems is incomplete, being biased against low-amplitude systems. The implied spatial reciprocal frequency based on the OGLE data is approximately 125 – 150, assuming that undetected systems with low inclinations contribute one half of all systems. This result is consistent with the direct estimate based on stellar densities, at the beginning of this section, of about 67 Main Sequence stars per one contact system which can be evaluated only to a factor of about two times.
4.9 The local sample to 3 kpc
The luminosity functions based on the volume-limited samples to 2 and 3 kpc have been discussed in Section 4.6. Here, we look at the statistics of the two most important, time-independent quantities, the orbital periods and intrinsic colors. The histograms of both quantities for the R2 sample, limited to kpc, are shown in Figure 19.
The upper panel of Figure 19 shows the distribution of orbital periods. It is very similar to such a distribution for field contact binaries (Rucinski 1992), which shows a peak at short periods, with a sharp cut-off close to 0.25 day and a gentle slope for longer periods. Apparently, fears expressed by this author that the field-system distribution might be affected by observational selection effects were premature. Potentially, this histogram should contain very important information on the formation and structure of the contact system. We note that most of its features do not have good and un-equivocal explanations.
The intrinsic-color distribution in the lower panel of Figure 19 shows a broad maximum between with the total extension between . There exist also a few systems with very red colors, reaching . As we comment in Section 5, the concentration of colors is reminiscent to that observed for Turn-Off Point stars of old population, although the distribution for contact binaries is wider and extends further to the red.
4.10 Possibility of an error in the color calibration
In Section 4.6 concerns have been expressed about a small but systematic difference in average absolute magnitudes between the Baade’s Window systems and nearby systems used for our calibrations. This difference might indicate a problem with the color scale in the OGLE data for faint stars. In fact, Kiraga, Paczyński and Stanek (1996) have recently pointed out some evidence for lack of consistency between the color-magnitude diagrams in Baade’s Window as available from OGLE (Udalski et al. 1993, Paczyński et al. 1994a), from the HST (Holtzman et al. 1993), and the color – magnitude diagrams for the globular clusters 47 Tucanae (Kałużny 1996) and the open cluster NGC 6791 (Kałużny & Udalski 1992). A possible reason for the inconsistency is a systematic shift in the OGLE colors for the stars fainter than the “Red Clump”. The inconsistency would manifest itself for where the listed colors in the OGLE data seem to become too red, with the discrepancy reaching about 0.1 in for , and stabilizing at this value for fainter stars. This is just a possibility at this time, and it may be caused by a non-linearity of the CCD detector (cf. Udalski et al. 1993) or, partly, by blending, with the red stars below the detection threshold affecting in a small, but systematic way the stars above the detection threshold. This issue shall be clarified in the near future using independent photometry based on a different CCD detector (Kałużny & Thompson, in preparation).
To estimate the influence of such an error, the data have been analyzed with colors artificially changed following the above suspected dependence of the error on brightness, by assuming that the discrepancy increases linearly within to 0.2 and then stays constant. Even for such an exaggerated case, the changes are small. The period – color diagram in Figure 10 is almost un-affected, although the gap in the distribution of points and the SPBE less evident, especially for the R8 case. This is as expected, as faint systems, which would be mostly affected by the color error, have – on the average – longer periods (cf. Figure 18). Further experiments show that the discrepancy between the absolute magnitudes of the OGLE systems and nearby systems in Figure 11 remains for artificial data, although the deviations do become smaller. The relatively small change can be explained by our scheme of the coupled absolute-magnitude, distance, reddening determination which distributes color differences in a more complex way than just a simple shift . The largest differences appear in the distance – period relations (Figures 13 – 15): The data points tend to be more spread at large distances, there is no concentration of points at 8 kpc, and several systems are moved to distances as large as 10 kpc. The gap between 6.5 – 8 kpc is filled. The distance – color relation in Figure 16 obviously shows the same features in terms of distances, but the concentration in intrinsic colors around the TOP colors, which was discussed in Section 4.7 remains.
Thus, even if an error in the color is present, we can uphold our main conclusion of the paper on the global distribution of contact binaries in space, but some details would have to be modified. Also, since the error may appear only at faint magnitudes, the results on the local frequency of contact binaries should remain entirely un-affected.
5 POPULATION CHARACTERISTICS OF THE CONTACT BINARIES
Two mechanisms of formation of contact binaries from detached binaries have been proposed. One involves the magnetic-wind evolution of the orbital angular momentum (Van’t Veer 1979, Vilhu 1982, Guinan & Bradstreet 1988) and seems to be the main route to produce such systems in open clusters and in the field. The second mechanisms utilizes dynamical interactions in dense cluster cores, possibly involving binary systems (Leonard & Fahlman 1991, Leonard & Linnell 1992), and is expected to contribute mostly in dense stellar clusters. Of importance for distinguishing between these two mechanisms would be data on population characteristics of the contact binaries. Although we have scant data on specific ages of contact binaries and we have no idea about the distribution of the ages, there are indications that they are quite advanced. This is suggested by space motions of the nearby systems (Guinan & Bradstreet 1988), which correlate weakly with metallicity indices (Rucinski, unpublished), as well as by the recent detections in old open clusters. There exist single contact binaries in Praesepe and Be 33 with ages of 0.7 – 0.9 Gyr, but then their numbers increase for older clusters with several systems in the old clusters NGC 6791, NGC 188, Be 39 and Cr 261 (Kałużny & Rucinski 1993, Rucinski & Kałużny 1994, Mazur et al. 1995). Of particular importance is the fact that contact binaries seem to exist in old open and globular clusters on both sides of the Turn-Off Point (TOP). First W UMa systems in globular clusters were found with surprisingly high frequency among Blue Stragglers (Mateo 1993, 1996), but recently Yan & Mateo (1994) discovered them also below the TOP (but above and along the MS) in M71. Observational selection effects are formidable below the TOP in globular clusters in most cases so that it would be premature to conclude that the MS contact systems do not exist there. However, the first data from the Hubble Telescope (Rubenstein & Bailyn 1996, Edmonds et al. 1996) indicate that globular clusters might, indeed, be deficient in Main Sequence contact systems.
An open cluster with systems on both sides of the TOP is the populous old open cluster Cr 261 (Mazur et al. 1995): For some 12 certain and 6 uncertain members of the cluster (among 28 contact systems in the field), 4 are Blue Stragglers. Not only this is the only cluster unambiguously showing W UMa systems on both sides of the TOP, but its contact Blue Stragglers seem to have another property: their amplitudes are systematically smaller than for the rest of the systems. If this is not a statistical coincidence due to the small sample, it excellently links with the suggestion of Eggen & Iben (1989) that the extremely small mass-ratio system, AW UMa, is a Blue Straggler in the field (for references to other possible cases, cf. Mateo 1993).
Although we have no radial velocity or abundance information for the contact binaries in Baade’s Window, their spatial distribution and relative frequencies, as well as preference of colors to group within a range around (Section 4.9) shed much light on their population characteristics. Apparently, we see contact binaries at all distances without any indication of any structure in this distribution; they do not seem to be concentrated to the Galactic plane. These characteristics are consistent with an old Galactic population. The concentration of colors to a relatively narrow interval is reminiscent of the enhancement observed as a broad vertical band on color–magnitude diagrams of the stellar field (Gilmore 1990, Reid & Majewski 1993), in the range of “vertical” evolution in the TOP region. In the old population, there are practically no bluer stars than about or, equivalently, , but then, within or , the density is substantially enhanced by stars of the TOP region. Obviously, the actual location of the enhancement depends on the reddening in the particular direction. Expressed in the de-reddened colors, the enhancement for the contact binaries seems to be wider than the normal width of ; in Figure 19 it extends to the red to or even further. While this extension can be perhaps explained through changes in stellar structure during the interaction of components when establishing the contact, one of the main goals for the future would be to establish whether the red cutoff is real and does not result from a selection effect or another bias in the photometric material. In Figures 16 and 19, some systems have surprisingly red colors, so that we directly see that contact binaries are not confined exclusively to the TOP region.
Having established that contact binaries belong to an old Galactic population, we must pose the question: Which old population is it? It seems unlikely that contact binaries in their majority are as old as stars of the Halo or the Thick Disk. According to Gilmore 1990 and Reid & Majewski 1993, the Extended/Thick Disk population has scale heights of about 1400 – 1600 pc. The line of sight to Baade’s Window passes the Galactic Center at the distance of about 560 pc, well within these scale heights, so that uniform density of the W UMa systems in space would agree with characteristics of this population. The main problem is with the low local density of such very old stars of only about 2%. The apparent frequency of the contact systems found here suggests a spatial density of about 1/150 or more, or 0.7%, which would require that about 1/3 of these very old stars were contact binaries. This is difficult to accept. A much more likely parent population of the contact systems is the Old Disk of solar-age stars, with the scale height of about 325 pc. These stars dominate in numbers in the solar vicinity and are the most likely donor of close binaries for formation of contact systems. A hint of a break in the continuity of the distance distribution at about 6.5 kpc might be actually due to the line of sight leaving that disk at pc.
The current data cannot unfortunately shed light on the contribution of Blue Stragglers to the contact binary sample. Possibly, a careful search in our database for low-amplitude, totally eclipsing systems similar to AW UMa could lead to isolating a sample likely to consist of Blue Stragglers. We should note that if the nine systems which we see in the Bulge do belong to the oldest Galactic population, some of them might be actually Blue Stragglers as they are all relatively blue. However, even the bluest among them would be then relatively “mild” BS’s, as their colors are only moderately different from those expected for the Bulge TOP: the observed colors, , and the intrinsic colors, .
6 CONCLUSIONS
The paper presents discussion of properties of contact systems discovered in 9 fields monitored during the micro-lensing project OGLE. A simple automatic classifier based on the Fourier analysis of light curves permitted isolation of 388 well observed contact systems with available colors from among 933 eclipsing systems in the OGLE Periodic Variable Star Catalog. Utilization of the calibration permitted determination of distances in an iterative scheme involving maximum values of reddening and extinction taken from the maps of Stanek (1996). Analysis of the distance distribution reveals no discontinuities or unexpected features, except for those which can be at least partly explained by an interplay of known selection effects. An apparent lack of contact systems bluer than at large distances seems to be a genuine feature of the color – magnitude diagram. Most of the systems appear in the color range , i.e. the blue edge of the distribution is the same as for stars of the old population which concentrate in the Turn-Off Point (TOP) region, but the red edge appears at redder colors.
Contact binaries with periods longer than one day, which are intrinsically brighter than the W UMa-type variables, but which normally are not considered together with the W UMa-type systems will be the subject of a separate investigation. No absolute calibration is at present available for those long-period systems. We note, however, that the calibration for the W UMa-type systems within day is really an extrapolation and should be properly established. Also, due to its particular importance, the short-period/blue envelope (SPBE) for the un-evolved systems, in the period–color diagram, urgently needs a better definition. These progresses can come only with an increase in quality and availability of photometric data for contact binaries, which are still lagging behind availability of light curves.
A first attempt to construct luminosity functions for volumes limited by distances of 2 and 3 kpc, where selection effects should be small was made. These functions are truncated at and , respectively by the magnitude limit of the sample. This truncation makes it impossible to firmly establish whether there exists excess of contact binaries in the TOP region, whose presence is indicated by the distribution of intrinsic colors for the whole sample. Extension of the luminosity functions to fainter magnitudes should be one of the primary goals for the future. The numbers of stars contained in the volumes used for the luminosity functions permitted an estimate of the frequency of contact binaries. The apparent frequency equals to one contact system per about 250 – 300 Main Sequence stars. This estimate, with an approximate correction for undetected, low-inclination systems, leads to the spatial frequency of about 1/125 – 1/150.
A direct evaluation of the spatial density of the contact systems of about per cubic parsec leads to an even higher frequency when comparison is made with Main Sequence stars of similar absolute magnitudes. While the density estimate is quite robust, the relative frequency estimate obtained that way is uncertain as it depends strongly on the assumed magnitude limit in the rising part of the luminosity function for normal stars.
The high spatial frequency of the W UMa-type systems, together with the uniform spatial distribution all the way to the Bulge and with the preference for intrinsic colors to cluster within the interval of 0.4 to 1.0 suggest that the contact binaries belong to the old stellar galactic population. Considering predominance of the Old Disk of solar-age stars in the solar neighborhood over the Extended/Thick Disk or Halo populations, it is most likely that the Old Disk stars are the main donor of contact binaries. The relative contribution of the contact Blue Stragglers to the sample cannot be presently evaluated. However, analyses of individual light curves might help in isolating a sub-sample of very low mass-ratio systems, possibly dominating among the contact Blue Stragglers.
References
- (1)
- (2) Arp, H. 1965, ApJ, 141, 43
- (3)
- (4) Bertelli, G., Bressan, A., Chiosi, C., Ng, Y. K. & Ortolani, S. 1995, A&A, 301, 381
- (5)
- (6) Bessell, M. S. 1979, PASP, 91, 589
- (7)
- (8) Bessell, M. S. 1990, A&AS, 83, 357
- (9)
- (10) Dinescu, D. I., Girard, T. M., van Altena, W., Yang, T.-G. & Lee, Y.-W. 1996, AJ, 111, 1205
- (11)
- (12) Duerbeck, H. W. 1984, Ap&SS, 99, 363
- (13)
- (14) Edmonds, P. D., Gilliland, R. L., Guhathakurta, P., Petro, L. D., Saha, A. & Shara, M. M. 1996, ApJ, Sept.1, in press
- (15)
- (16) Eggen, O. J. 1961, Roy Obs Bull, No.31
- (17)
- (18) Eggen, O. J. 1967, MmRAS, 70, 111
- (19)
- (20) Eggen, O. J. & Iben, I. 1989, AJ, 97, 431
- (21)
- (22) Eggleton, P. P. 1996, in The Origins, Evolution, & Destinies of Binary Stars in Clusters, eds. E. F. Milone & J.-C. Mermilliod, ASP Conf., 90, 257
- (23)
- (24) Gilmore, G. 1990, in The Milky Way as a Galaxy, eds. R. Buser & I. R. King (University Science Books, Mill Valley, California), p. 9
- (25)
- (26) Gould, A., Bahcall, J. N. & Flynn, C. 1996, ApJ, 465, 759
- (27)
- (28) Guinan, E. F. & Bradstreet, D. H. 1988, in Formation and Evolution of Low Mass Stars, eds. A. K. Dupree & M. T. Lago (Kluwer, Dordrecht), p. 345
- (29)
- (30) Holtzman, J. A., Light, R. M., Baum, W. A., Worthey, G., Faber, S. M., Hunter, D. A., O’Neil, E. J., Kreidl, T. J., Groth, E. J. & Westphal, J. A. 1993, AJ, 106, 1826
- (31)
- (32) Humphreys, R. M. & Larsen, J. A. 1995, AJ, 110, 2183
- (33)
- (34) Hut, P., McMillan, S., Goodman,J., Mateo, M., Phinney, E. S., Pryor, C., Richer, H. B., Verbunt, F. & Weinberg, M. 1992, PASP, 104, 981
- (35)
- (36) Kałużny, J. 1990, AcA, 40, 61
- (37)
- (38) Kałużny, J. 1996, in preparation
- (39)
- (40) Kałużny, J. & Rucinski, S. M. 1993, in Blue Stragglers, ed. R. A. Saffer (San Francisco, ASP), ASP Conf.Ser. 53, 164
- (41)
- (42) Kałużny, J. & Shara, M. M. 1987, ApJ, 314, 585
- (43)
- (44) Kałużny, J. & Thompson, I. 1996, in preparation
- (45)
- (46) Kałużny, J. & Udalski, A. 1992, AcA, 42, 29
- (47)
- (48) Kiraga, M., Paczyński, B. & Stanek, K. Z. 1996, in preparation
- (49)
- (50) Leonard, P. J. T & Fahlman, G. G. 1991, AJ, 102, 994
- (51)
- (52) Leonard, P. J. T & Linnell, A. P. 1992, AJ, 103, 1928
- (53)
- (54) Mateo, M. 1993, in Blue Stragglers, ed. R.E.Saffer, ASP Conf. Ser., 53, 74
- (55)
- (56) Mateo, M. 1996, in The Origins, Evolution, & Destinies of Binary Stars in Clusters, eds. E. F. Milone & J.-C. Mermilliod, ASP Conf., 90, 21 & 346
- (57)
- (58) Mazur, B., Krzeminski, W. & Kałużny, J. 1995, MNRAS, 273, 59
- (59)
- (60) Mochnacki, S. W. 1985, in Interacting Binaries, eds. P. P. Eggleton & J.E.Pringle (Reidel Publ. Co.), p. 51
- (61)
- (62) Ng, Y. K., Bertelli, G., 1966, A&A, in press
- (63)
- (64) Ng, Y. K., Bertelli, G., Chiosi, C. & Bressan, A. 1996, A&A, 310, 771
- (65)
- (66) Paczyński, B., Stanek, K. Z., Udalski, A., Szymański, M., Kałużny, J., Kubiak, M. & Mateo, M. 1994a, AJ, 107, 2060 (P94)
- (67)
- (68) Paczyński, B., Stanek, K. Z., Udalski, A., Szymański, M., Kałużny, J., Kubiak, M, Mateo, M. & Krzeminski, W. 1994b, ApJ, 435, L113
- (69)
- (70) Reid, N. 1996, MNRAS, 278, 367
- (71)
- (72) Reid, N. & Majewski, S. R. 1993, ApJ, 409, 635
- (73)
- (74) Rubenstein, E. P. & Bailyn, C. D. 1996, AJ, 111, 260
- (75)
- (76) Rucinski, S. M. 1973, AcA, 23, 79
- (77)
- (78) Rucinski, S. M. 1992, AJ, 103, 960
- (79)
- (80) Rucinski, S. M. 1993a, in The Realm of Interacting Binary Stars, editors: J. Sahade, Y. Kondo & G. McClusky, (Netherlands: Kluwer Academic Publ.), p. 111
- (81)
- (82) Rucinski, S. M. 1993b, PASP, 105, 1433 (R93)
- (83)
- (84) Rucinski, S. M. 1994a, PASP, 106, 462 (R94)
- (85)
- (86) Rucinski, S. M. 1994b, AJ, 107, 738
- (87)
- (88) Rucinski, S. M. 1995a, ApJ, 446, L19 (BWC)
- (89)
- (90) Rucinski, S. M. 1995b, PASP, 107, 648 (R95)
- (91)
- (92) Rucinski, S. M. 1996, in The Origins, Evolution, & Destinies of Binary Stars in Clusters, eds. E. F. Milone & J.-C. Mermilliod, ASP Conf., 90, 270 (R96)
- (93)
- (94) Rucinski, S. M. & Kałużny, J. 1994, Mem. Soc. Astr. Ital., 65, 113
- (95)
- (96) Sarajedini, A. 1993, in Blue Stragglers, ed. R.E.Saffer, ASP Conf. Ser., 53, 14
- (97)
- (98) Stanek, K. Z. 1996, ApJ, 460, L37 (S96)
- (99)
- (100) Stanek, K. Z., Mateo, M., Udalski, A., Szymański, M., Kałużny, J. & Kubiak, M. 1994, ApJ, 429, L73
- (101)
- (102) Suntzeff, N. B., Kinman, T. D. & Kraft, R. P. 1991, ApJ, 367, 528
- (103)
- (104) Udalski, A., Szymański, M., Kałużny, J., Kubiak, M. & Mateo, M. 1993, AcA, 43, 69
- (105)
- (106) Udalski, A., Kubiak, M., Szymański, M., Kałużny, J., Mateo, M. & Krzeminski, W. 1994, AcA, 44, 317
- (107)
- (108) Udalski, A., Szymański, M., Kałużny, J., Kubiak, M., Mateo, M. & Krzeminski, W. 1995a, AcA, 45, 1
- (109)
- (110) Udalski, A., Olech, A., Szymański, M., Kałużny, J., Kubiak, M., Mateo, M. & Krzeminski, W. 1995b, AcA, 45, 433
- (111)
- (112) Van’t Veer, F. 1979, A&A, 80, 287
- (113)
- (114) Vilhu, O. 1982, A&A, 109, 17
- (115)
- (116) Wielen, R., Jahreiss, H. & Krüger, R. 1983, in “The Nearby Stars and Stellar Luminosity Function”, IAU Coll.76, eds. A. G. Davis Philip and A. R. Upgren (L. Davis Press, Schenectady, N.Y.), p. 163
- (117)
- (118) Woźniak, P. R. & Stanek, K. Z. 1996, ApJ, 464, 233 in press
- (119)
- (120) Yan, L. & Mateo, M. 1994, AJ, 108, 1810
- (121)