Redshift survey of gravitational arclets in Abell 2390††thanks: Based on observations collected at the Canada-France-Hawaii Telescope at Mauna Kea, Hawaii, USA
Abstract
In this paper, we present new determinations of redshifts on a sample of gravitational arclets identified in the cluster of galaxies Abell 2390. The arclets candidates were selected from their elongated morphology as seen in recent deep HST images of the cluster. The spectra display various features, and the redshifts of the background objects range from 0.398 to 1.268, most of them being between 0.6 and 0.9 with [O ii] =3727Å being the main emission line encountered. This distribution is mostly concentrated in two redshifts planes at and . The existence of two pairs of background galaxies at different redshifts, almost superimposed on the same line of sight are used to infer some limits on the mass of galaxy-size deflectors. A detailed writing of the lensing distorsion by two lens planes at different redshifts is developped for this purpose. Finally, [O ii] equivalent widths are used to compute approximate star formation rates which appear to be of the same order of magnitude as in nearby spiral galaxies. The implications on both the lensing properties of the cluster and the analysis of the field galaxy evolution are also discussed.
Key words: Galaxies: cluster: individual: Abell 2390 – Galaxies: evolution – starburst – Cosmology: observations – gravitational lensing
1 Introduction
Over the last years, more and more cases of gravitational arcs have been discovered bringing important results on the mass determination in clusters of galaxies (see Fort and Mellier 1994 for a review) as well as additional information on the redshift measurement of distant galaxies and on their spectral content. The use of the gravitational magnification to probe the properties of distant background galaxies has already proved to be a powerful method. The initial goal in the redshift measurement of arcs was to fix the scaling of the mass distribution in the lens modelling (see for example Kneib et al., 1993 for the well-known cluster lens Abell 370), at least in the central parts of the cluster. But it was also rapidly understood that clusters could be used as gravitational telescopes to scan and study the spectral content of a sample of distant field galaxies. In addition, Kneib et al. (1994, 1996) have shown that once one arc redshift is determined, the knowledge of the lensing potential can be used to predict the redshifts of some other lensed sources, from an analysis of their shape parameters. From these study they predicted the redshift distribution of arclets in Abell 370 and Abell 2218. This lensing redshift method still requires a spectroscopic validation, at least on several objects in the same cluster, in order to extend it on fainter and more distant objects. The selection of the arclets candidates is much easier with HST deep images because their distorted morphology is more apparent. The gain in spatial resolution has also brought spectacular results in the analysis of the size of the spectroscopically known arcs (Smail et al., 1996). The redshift-magnitude diagram derived from these redshift estimates shows a clear continuity with the existing deep redshift surveys, such as those performed by Cowie et al. (1995), Glazebrook et al. (1995) or Lilly et al. (1995). These redshift surveys begin to reach the population which is also the case of the arcs redshift survey, but the last one corresponds to galaxies typically 1 to 2 magnitudes fainter thanks to the gravitational magnification, even if the sampling and the selection biases of the objects are quite different. Very high redshift sources have already been observed thanks to this approach, such as the source of the giant arc in Cl2244–02 (Mellier et al., 1991), although recent observations by Steidel et al. (1996) of a sample of objects in the field of high-z quasars has been much more efficient to select galaxies at 3–4.
In this framework, the recent deep HST images of the cluster Abell 2390 (=0.231) obtained by Fort et al. (1996, in preparation) represent an invaluable tool to investigate the lensing redshift method and its consequences. The cluster A2390 is already well known as a cluster-lens which displays a “straight arc” at a redshift of 0.913 (Pelló et al. 1989, 1991) as well as many arclets candidates. It was tentatively modelled by Mellier et al. (1989) and Kassiola et al. (1992), although the proposed models are not fully reproducing all the observational constraints. Pierre et al. (1996) presented X-ray ROSAT/HRI observations of the cluster and an analysis of the matter distribution derived from both the gas distribution and the lens configuration. The number of arclets identified in the HST images is particularly high which makes A2390 one of the best lenses to look at the redshift distribution of background objects. In this paper, we present spectroscopic observations of a sub-sample of the arclets candidates. The summary of the observations and the data reduction is presented in Section 2, and Section 3 is devoted to the spectral analysis of the results. In Section 4 we propose some implications on the lensing properties of the field of view and in Section 5, an estimate of the star formation rate of the background sources is discussed. Finally, Section 6 gives some conclusions and perspectives on the difficult problem of redshift determination of faint and distant galaxies. Throughout the paper, we consider a Hubble constant of H km s-1 Mpc-1, with q and .
2 Observations and data reduction
Spectroscopic observations were performed on August 24-28, 1995, at the 3.6m Canada France Hawaii Telescope (CFHT), with the MOS/SIS spectrograph (Le Fèvre et al., 1994). The detector was a 2048 2048 Loral 3 CCD with a pixel size of 0.314′′ and an image field of 10′ 10′. Low dispersion spectroscopy was obtained with the V150 grism providing a wavelength dispersion of 7.3Å per pixel. One mask was designed with 36 slitlets (1.2′′ 10′′) and 7 exposures of 1 hour each were obtained in good weather conditions (average seeing of 0.9′′).
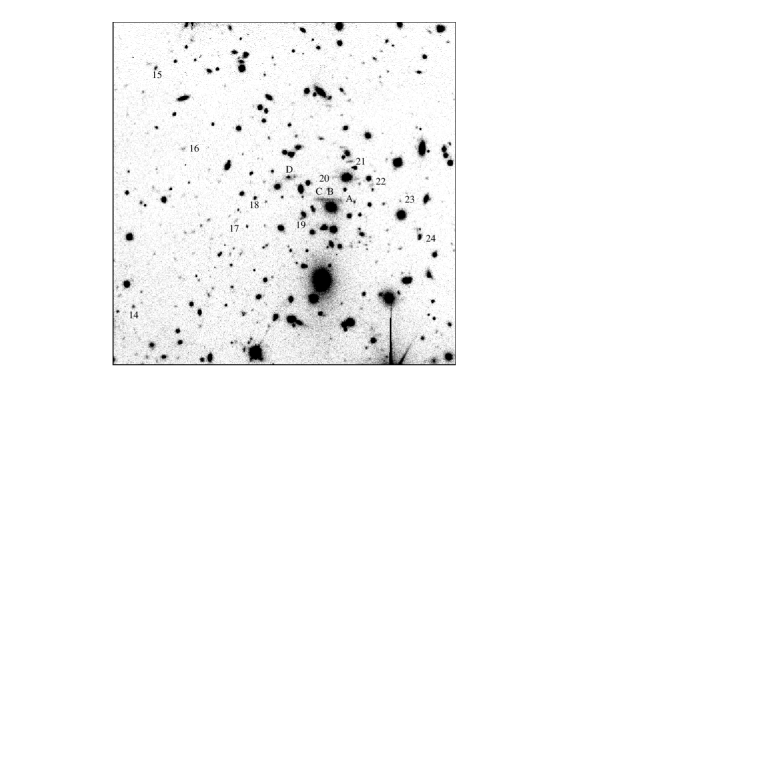
Arclet candidates were essentially selected from the deep HST/WFPC2 images of the cluster. No a priori color selection was introduced, and only the shape and the orientation were taken into account, favoring the highest magnified sources. We imposed a selection criterium so that the arclets candidates must have an axis ratio greater than 3.5 (either in V or I) and are oriented roughly tangentially with respect to the center of the cluster. An additional check by eye allowed to eliminate a few faint and spurious objects, finally giving a sample of 35 candidates. Most of them are located in the region of the giant straight arc, where the lensing power of the cluster is the strongest. An additional cut in magnitude occured directly on a 10minutes R exposure from which the selection was done, as we required to detect the objects. From the constraints of the mask preparation and the slit selection, only a sub-sample was selected, and the rest of the mask was filled with cluster members candidates, in order to increase the redshift data in A2390. The selected objects are displayed in Figure 1.
A mask was punched with 36 slits, 19 corresponding to cluster members, 3 to M stars and 2 are unidentified. 12 spectra correspond to objects at higher than the cluster redshift but 3 of them are ranging from 0.3 to 0.4 and located too far away from the center to be significantly lensed, and will not be considered in this paper. We will focus only on the 11 most central slits, which correspond to objects in the field of view of the WFPC2 image (namely objects #15 to #24) plus object #14.
Data reduction was performed with standard IRAF routines for bias removing and flat-fielding, and the Multired package that is especially devoted to multislit spectroscopy. From the 7 individual exposures, a median averaged sky-subtracted spectrum was obtained for each slitlet, allowing an efficient removal of cosmic rays and other defects. The extracted spectra were flux calibrated with the standard star BD253941 and the shape of the continuum can be considered reliable from 4000Å to 8000Å. Finally, a boxcar smoothing with a window of 20 Å (3 pixels) was applied to increase the S/N on the faintest spectra.
3 Redshift and spectroscopic content of the arclets
New redshift determinations are based essentially on the identification of the [O ii] emission line 3727Å (Figure 2), although for some arclets, a more detailed analysis of the spectral content is possible (#21, #24). The results are presented in Table 1 (results concerning the giant arc have been added from Pelló et al., 1991). Over the 11 spectra extracted from the central slits, we obtain 12 reliable redshift determinations: 3 objects belong to the cluster, and 9 are at larger redshift, ranging from 0.398 to 1.268. Only one spectrum (#19) does not present significant features and has no redshift identification, giving a success rate of 90% for the redshift measurement of the background arclets. This is important to note, as we can exclude any strong bias towards the high redshift tail of galaxies, regardless the fact that between 1.4 and 2.2, no strong emission line falls in the optical band for “normal” galaxies.
Although the statistics of the background objects is small, two comments can be done here on the redshift distribution of the arclets. First, our results confirm the trend observed in the whole sample of cluster lenses, for which most sources are between and (Fort and Mellier 1994) and only a few of them are at redshift larger than 1 (namely #161 and #162 in our sample). Second, it seems that two redshift planes or windows may be privileged behind Abell 2390. The first one is at 0.64 and displays at least 4 identified objects: arclets #20, #21 and #241, plus one galaxy from Le Borgne et al., 1991). The other one is at 0.90 and corresponds to the redshift of the giant straight arc. It contains arclets #14 and #17, and the two sources of the giant arc (we assume that object A is different from B–C, as suggested from the HST image) as well as object D from Pelló et al. (1991). The two planes are quite significant as they are spatially coherent: in both cases, all the identified object fall inside a radius smaller than 1′. We then suspect that two groups or clusters of galaxies are located at these redshifts, although a better statistics of arclets redshifts is required to reinforce this result. Future observations are planned to complete this redshift survey. An alternative strategy will be to study the multi-color distribution of objects and the implied photometric redshift following the method proposed by Pelló et al. (1996), but this requires deep photometry of the field over a large wavelength range, from B to near-infrared colors (J and K’).


 #14
#20
#14
#20
#16
#21
#17
#22
#19
#24
| # | Identified features | B | M | SFR | ||
|---|---|---|---|---|---|---|
| (Å) | ||||||
| B-C | [O ii] | 0.913 | 11 | 22.52 | ||
| A | [O ii] | 0.913 | 6 | 23.48 | ||
| D | [O ii] | 0.913 | 41 | 23.29 | 4.6 | 4 |
| 14 | [O ii] | 0.886 | 12 | |||
| 15 | G-band ? | 0.223 | ||||
| 16_1 | [O ii] | 1.268 | 22 | 24.21 | 1.7 | 4 |
| 16_2 | [O ii] | 1.082 | 20 | 24.13 | 1.7 | 3 |
| 17 | [O ii] | 0.859 | 38 | 24.04 | 2.4 | 3 |
| 18 | G-band, Mg i ? | 0.226 | 23.70 | |||
| 19 | ? | 23.39 | ||||
| 20 | [O ii], no continuum detected | 0.647 | 100 | |||
| 21 | Mg ii, [O ii], [O iii] 4959Å and 5007Å | 0.643 | 44 | 2 3.48 | 2.7 | 3 |
| 22 | [O ii] | 0.790 | 17 | 24.11 | 2.7 | 1 |
| 23 | H, [O iii] 4959Å and 5007Å | 0.221 | 24.31 | |||
| 24_1 | Ca ii K, Ca ii H, H | 0.631 | 0 | |||
| 24_2 | [O ii], [O iii] 5007Å | 0.398 | 29 |
23.00∗
∗ overlapping objects.
Remarkably, the two slits #16 and #24 clearly display complex spectra, with two superimposed objects in each. Thanks to the high resolution HST images (Figure 4), it is possible to assess each identified redshift to individual objects. In the slit #16, the two detected emission lines are spatially slightly separated and we can clearly identify the most distant of the two objects as the northern one. In the slit #24, it is more difficult because the two objects are well superimposed in the direction of dispersion. But the difference in the spectral content allows to claim that the reddest galaxy is also the most distant one, while the bluest one corresponds to an object emitting the strong [O ii] line. Paradoxically, the brightest object is the western galaxy at , while the faintest and most elongated one is the eastern galaxy at .

4 Implications for the lensing model of A2390
4.1 Evidence for a complex mass distribution
From the lensing point of view, it may be surprising to find a redshift value of 0.64 for the two arclets #20 and #21 which are located behind the giant arc from the cluster center, and parallel to it. If we consider that the critical line at falls near the giant arc, it is difficult to build a simple lens model with another critical line at a lower redshift and more distant from the center (see Fort et al., 1996, in preparation). In particular arclet #20 is probably multiple-imaged: a second component is present on the other side of the neighbouring galaxy (Figure 4) with similar morphology and color index ( for #20 and for the symetric image, Pelló et al. 1991), and a possible third image is located near this same galaxy, within its enveloppe. Spectroscopic confirmation is of course required to confirm this assumption, which could have strong implications in the lens modelling, as multiple images bring strong constraints on the location of the critical curves. This could also indicate that the mass distribution is more complex than originally suspected, and that the group at may add a significant contribution to the lensing of galaxies behind it. It could even be the optical counterpart of the X–ray clump identified in Pierre et al. (1996) and superimposed to the main cluster component. Otherwise, the redshift identification could be wrong if the emission line observed is not [O ii]. This seems quite unlikely for arclet #21 as the [O iii] doublet is also observed at the same redshift. For arclet #20, it is more tentative because only one emission line is detected at Å which is clearly visible in the 2-D spectrum, but the underlying continuum is too faint to be analysed. Future spectroscopy is required to increase the S/N on this arclet and on its counterpart candidate.
4.2 A two screen lensing application
Another sub-product of this redshift survey is the detection in two cases of a pair of galaxies with different redshifts nearly aligned on the same line of sight, namely the objects in slits #16 and #24. We propose an attempt to estimate the mass of each of the less distant one with a simplified analysis of the two-screen gravitational lens formalism. We follow the equations of Blandford and Kochanek (1987) and the details are given in Appendix. By assuming a singular circular isothermal potential (velocity dispersion ) for the lensing galaxy and using the modelling of Pierre et al. (1996) for the cluster, we can derive a relation between , the axial ratios of the image and of the source of the most distant galaxy. We plot in Figure 3 the angles and corresponding to the light travel between the two potentials, originating respectively from the lensing galaxy and the background one. We also call the angle between the cluster shear axis and the galaxy shear axis, projected in the sky plane.
In the case of the two galaxies in the slit #16, the convergence and the shear of the cluster projected in the source plane at are and , while is approximatively and is 0.91′′. What we want is to propose an estimate of the mass of the perturbing galaxy #162 (or equivalently its velocity dispersion ) derived from the distorsion of the background galaxy #161. The main point is that this source at appears nearly circular in the image plane (), which means that its intrinsic shape is elongated in the direction perpendicular to the main axis of magnification. We see immediately that without the addition of the galaxy at , the axis ratio of the source is 0.67, a typical value of 0.7 being generally admitted for faint field galaxies (Miralda–Escudé, 1991). The addition of the galaxy will even decrease this ratio, so from a conservative point of view we restrict our study to the case where is larger than 0.5. This immediately can be translated into a limiting value for the velocity dispersion of the lensing galaxy of about 440 km s-1. This does not give a strong constraint on the mass of this distant galaxy, essentially because the lensing configuration is not quite favorable. Indeed, the perturbing galaxy plane is not distant in redshift from the source plane, which makes the lens poorly efficient to distort the source. Moreover, the cluster effect is rather strong, and already imposes the shape of the source being in the low values tail of the axis ratio distribution. Nevertheless, this can be also understood in terms of galaxy shape evolution as recent results from the Hubble Deep Field seem to show a strong increase in the ellipticity of faint and distant field galaxies. The conversion between and a total mass is rather tentative, because we most probably deal with a spiral galaxy more than with an elliptical one. But we can derive a crude estimate of this mass from the integration of the isothermal potential inside a typical radius of 10 kpc, which is reasonable for a large spiral galaxy. This gives an upper mass estimate of and consequently , if we include the galactic absorption and the k-correction in the absolute V luminosity measured from the HST image ().
If we apply the same method for the double system of the slit #24, the results are more satisfying in terms of mass estimates: numerically, the convergence of the cluster-lens, computed at is 0.246, and the shear is 0.105. The angle is , and the distance between the two objects, in the galaxy plane, is 0.35′′. This system is also slightly different from the previous one in the fact that the image of the background source is rather elongated (), in a direction not far from the main magnification axis. Without the addition of the galaxy at , the axis ratio of the source is 0.82 and if we again assume that the axis ratio of the source is higher than 0.5, the velocity dispersion has to be lower than 140 km s-1. This gives an upper mass estimate of and consequently , if we include the galactic absorption and the k-correction in the absolute V luminosity measured from the HST image ().
We insist on the fact that our mass estimates give an upper limit on the . For the system #16, this limit is not very strong although there exist only a few examples of the mass estimate of a galaxy at high redshift. For the system #24, the lensing configuration is more favorable to bring a stronger constraint on the , which fall within standard values for spiral galaxies. Determining galaxy mass using weak gravitational lensing also seems to be quite promising (Brainerd et al. 1995) but the approach is essentially a statistical one, while our method applies in a few pecular cases. Moreover, the multiple lenses formalism we have presented will be useful for a future modelling of the cluster if we add the effects of the two mass planes and to analyse the distribution of the very high–z galaxies behind the cluster.
5 Star formation rates
In the spectroscopic content of our sample of distant galaxies, we note that among the 12 background objects listed in Table 1, 10 emit the [O ii] line characteristic of star forming H ii regions. This high proportion follows the increase in the number of star forming galaxies with apparent magnitude shown in Broadhurst et al. (1992). An increase of [O ii] equivalent width with redshift until =0.4–0.6 has also been reported by Broadhurst et al. (1988) and Colless et al. (1990). [O ii] luminous galaxies have also been discovered by Cowie et al. (1995) at redshifts greater than 1. One way to investigate more quantitatively this relation is to try to compute the star formation rate in these lensed-galaxies. Despite the fact that H is the best estimator to infer starbursts intensities (Kennicut, 1983), it is not possible to measure this line for redshifts larger than 0.4 when spectra are obtained in the optical band only. However, a rough estimate can be made with [O ii] equivalent width for high redshift objects using the relation (Kennicut, 1992):
where is the blue luminosity in solar units on the continuum ( 4400Å) and the rest frame [O ii] equivalent width listed in Table 1. In the case of lensed galaxies, one has first to correct from the magnification factors taken from the gravitational potential proposed in Pierre et al. (1996) for the central part of the cluster. Rest frame B luminosities were determined with B magnitudes measured on an image taken at CFHT on November 1991, then k-corrected with a template Sd spectrum (Bruzual and Charlot, 1993) except for object D corresponding to a Sc galaxy (Pelló et al. 1991). Interstellar extinction was taken into account (=0.28 for A2390, Burstein and Heiles, 1982).
The difficulty is to estimate the uncertainties on the SFR which could be large for many reasons. First the extinction by the galaxy itself is unknown, an average value of 1 magnitude was adopted by Kennicut (1992) for the extinction of H. This can lead to important differences for individual objects but the SFR averaged over all arclets should not strongly suffer this bias. Second, there is an intrinsic dispersion in the relation between [O ii] and H line fluxes which do not represent exactly the same quantities, as raised originally by Kennicut (1992). Additional uncertain parameters are the exact proportion of ionizing photons escaping from the H ii regions, and the slope of the IMF. Globally, this can amount to an error of nearly 100% or a factor of two. Finally, our corrections for the absolute luminosity depends strongly on the gravitational magnification, which may contain a source of uncertainty as far as an overconstrained model has not emerged. The results of this evaluation are also listed in Table 1.
The mean star formation rate among our sample of distant galaxies is , with a factor 2 of uncertainty, a value of the same order of magnitude as for nearby blue galaxies (Kennicut, 1983). Gallagher et al. (1989) also measured [O ii] equivalent widths in nearby galaxies but their derived SFR are lower. In the case of more distant sources, a tentative evaluation of the SFR was proposed by Mellier et al. (1991) for the very distant source of the giant arc in Cl2244–02 at , with a value varying from 7 to 20 depending on the correction factors. Note that this value was obtained from the measurement of the UV continuum, with a slightly different calibration procedure. A more detailed evaluation has been recently proposed by Ebbels et al. (1996), from a complete spectral synthesis applied on one arclet in A2218 identified at , giving a SFR of about 10 . Steidel et al. (1996) also found similar values based on the far–UV continuum in objects at redshifts of 3–3.5. In any case, starburst activity in high redshift galaxies seems to be more frequent than in the local universe but its intensity is comparable to nearby spiral galaxies, at least up to with maybe a global increase at higher . It remains much below the values found in several objects at such as radio galaxies or damped Ly absorbers which display hundreds of of SFR (Djorgovski, 1988; Elston et al., 1991). But these objects belong to other classes of distant galaxies with signs of strong activity and evolution and they cannot be used as a direct probe for the evolution of the star formation activity of field galaxies.
6 Conclusions
In this paper, we have presented 9 new redshifts of gravitationally lensed background galaxies located in the same field, behind the cluster-lens A2390, with a success rate of 90% for the redshift determination of these faint objects. We suspect the existence of two peculiar planes of background objects, corresponding to spatial structures at and 0.90. But a better statistics is required to confirm them and to quantify their mass distribution and their influence on the lens configuration. We also confirm the general trend that the population of arclets is mostly distributed in the range 0.61 and their starburst activity is more frequent than in nearby galaxies, although not significantly stronger. Constraints on for two galaxies at and have been obtained thanks to multiple light deflection by two gravitational potentials at different redshifts. The next step is now to introduce these confirmed arclets as constraints on an updated lens model of the cluster potential obtained together with the analysis of the HST images of the arcs and arclets. The spectroscopic results will give constraints mainly on the slope of the mass profile outside the critical radius. Combined with a new modelling, the lensing redshift method will then be able to determine for a set of new arclets the most probable redshifts that can account for their location and shape. Used as a bootstrap technique, it may give the unique opportunity to get the redshift of galaxies 3 magnitudes fainter than the faintest redshift surveys. Similar results are also beeing tested on the cluster A2218 which displays a similarly large number of arclets (Kneib et al. 1996). This method gives a statistical redshift distribution. The combination of the two lenses and possibly of a few other ones such as A370 and AC114 will greatly increase the sample of faint galaxies. One of their main interest is the small selection biases introduced in their identification (no color selection) and the window they open to the high redshift tail of the faint field galaxy population.
Gravitational lensing has brought a large number of results on the mass distribution of clusters of galaxies. Now the window is open to look at the population of the sources and to benefit from their magnification to have access on new informations on their redshift distribution and on their evolution both in spectral content and morphology.
-
Acknowledgements.
We wish to thank Y. Mellier for his strong encouragements and remarks during the writting of the paper. We are also very grateful to J.F. Le Borgne and R. Pelló for fruitful discussions about A2390 and to J.P. Kneib for useful comments on the manuscript, especially on the double lens equations and formalism. This work was partly supported by the Groupe de Recherche “Cosmologie”.
Appendix
The lens equation in a system with two redshift planes can be written as (Blandford and Kochanek, 1987):
| (1) |
with the angles defined in Figure 3. is the angle between the light paths originating from the lensing galaxy and the background one in the region between the two potentials. The Hessian of the transformation, which is the inverse of the amplification matrix is:
| (2) |
The first two terms of this relation can be related to the magnification matrix of the cluster , which is written, when projected on the local magnification axis:
| (3) |
is the convergence of the lens and is the local shear computed at the source redshift with the modelling of Pierre et al. (1996). For the perturbative lens which corresponds to an individual galaxy, we associate a singular isothermal sphere potential with a velocity dispersion . In a polar coordinate system where axis 1 is the tangential axis and axis 2 is the radial axis, the magnification matrix takes a simple form (Kneib 1993):
| (4) |
We now want to combine these two lenses, and have to project the matrix on the main axis of before any addition. Let be the angle between the cluster shear and the galaxy shear. Moreover, as seen in Figure 3, and are related such that in the cluster plane. Consequently, we have:
| (5) |
and finally,
| (6) |
which can be expressed as
| (7) |
with
| (8) |
| (9) |
| (10) |
| (11) |
and
| (12) |
As pointed out by Kochanek and Apostolakis (1988), lensing by several redshift planes makes the magnification matrix asymetric, so the formalism of a single screen has to be used with care. We propose some estimates of the semi–major and semi–minor axis of the source using essentially the shape matrix formalism for the source and the image (Kochanek, 1990), which are related by:
| (13) |
In the two cases we analyse here, the orientation of the image falls near the main axis of the shear, so that is diagonal with simple terms and . So whatever the true orientation of the source in the source plane, we can write:
| (14) |
This can be easily solved for , knowing , for each value of .
References
- 1 Blandford R.D., Kochanek C.S., 1987, Dark Matter in the Universe, eds. Bahcall J., Piran T., Weinberg S., World Scientific, Singapore
- 2 Brainerd T., Blandford R., Smail I., 1995, preprint SISSA 9503073
- 3 Broadhurst T.J., Ellis R.S. and Shanks T., 1988, MNRAS, 235,827
- 4 Broadhurst T.J., Ellis R.S. and Glazebrook K. 1992, Nature, 355, 55
- 5 Bruzual G.A. and Charlot S., 1993, ApJ, 405, 538
- 6 Burstein D. and Heiles C., A.J., 1982, 87, 1165
- 7 Colless M., Ellis R.S., Taylor K. and Hook R. N., 1990, MNRAS, 244, 408
- 8 Cowie L.L., Hu E.M., Songaila A., 1995, Nature, 377, 603
- 9 Djorgovski S., 1988, Towards Understanding Galaxies at Large Redshift, eds. Kron R.G. and Renzini A., Kluwer Academic Publishers, p.259
- 10 Ebbels T.M.D., Le Borgne J.F., Pelló R., Kneib J.P., Smail I.R., Sanahuja B., 1996, MNRAS in press, preprint SISSA 9606015
- 11 Elston R., Bechtold J., Lowenthal J. and Rieke M., 1991, ApJL, 373, 39
- 12 Fort B., Mellier Y., 1994, A&AR 5, 239
- 13 Gallagher J.S., Bushouse H. and Hunter D.A., 1989, A.J., 97, 700
- 14 Glazebrook K., Ellis R., Colless M., Broadhurst T., Allington–Smith J., Tanvir N., 1995, MNRAS, 273, 157
- 15 Kassiola A., Kovner I. and Blandford R. 1992, ApJ, 396, 10
- 16 Kennicut R.C. 1983, ApJ, 272, 54
- 17 Kennicut R.C. 1992, ApJ, 388, 310
- 18 Kneib J.-P., 1993, Ph. D. thesis, Université Paul Sabatier, Toulouse
- 19 Kneib J.-P., Mellier Y., Fort B., Mathez G., 1993, A&A, 273, 367
- 20 Kneib J.-P., Mathez G., Fort B., Mellier Y., Soucail G., Longaretti P.-Y., 1994, A&A, 286, 701
- 21 Kneib J.-P., Ellis R.S., Smail I., Couch W.J., Sharples R.M., 1996, preprint SISSA 9511015, ApJ submitted
- 22 Kochanek C.S., 1990, MNRAS, 247, 135
- 23 Kochanek C.S. and Apostolakis J., 1988, MNRAS, 235, 1073
- 24 Le Borgne J.F., Mathez G., Mellier Y., Pelló R., Sanahuja B. and Soucail G. 1991, A&A Supp. Ser., 88, 133
- 25 Le Fèvre O., Crampton D., Felenbok P., Monnet G., 1994, A&A, 282, 325
- 26 Lilly S.J., Tresse L., Hammer F., Crampton D., Le Fèvre O., 1995, ApJ, 455, 108
- 27 Mellier Y., Soucail G., Fort B., Le Borgne J.F., Pelló R., 1989, in Proceedings of the Toulouse Workshop on Gravitational Lensing, eds. Y.Mellier, B.Fort and G.Soucail, Springer, p.261
- 28 Mellier Y., Fort B., Soucail G., Mathez G. and Cailloux M., 1991, Ap.J., 380, 334
- 29 Miralda–Escudé J., 1991, ApJ, 370, 1
- 30 Pelló R., Le Borgne J.F., Mathez G., Mellier Y., Sanahuja B., Soucail G., 1989, in Proceedings of the Toulouse Workshop on Gravitational Lensing, eds. Y.Mellier, B.Fort and G.Soucail, Springer, p.293
- 31 Pelló R., Le Borgne J.F., Soucail G., Mellier Y. and Sanahuja B., 1991, ApJ, 366, 405
- 32 Pelló R., Miralles J.M., Le Borgne J.F., Picat J.P., Soucail G., Bruzual G., 1996, A&A in press, preprint SISSA 9603146
- 33 Pierre M., Le Borgne J.F., Soucail G., Kneib J.-P., 1996, A&A in press, preprint SISSA 95102128
- 34 Smail I., Dressler A., Kneib J.–P., Ellis R., Couch W.J., Sharples R.M., Oemler A., Butcher H.R., 1996 ApJ submitted
- 35 Steidel C., Giavalisco M., Pettini M., Dickinson M., Adelberger K., 1996, preprint SISSA 9602024