H2 Emission from the Inner 400 pc of the Galaxy
Abstract
We have mapped the H2 S(1) () emission line along a 400 pc long strip and in a 50 pc region in the Galactic center. There is H2 emission throughout the surveyed region. The typical de-reddened ( mag) H2 S(1) surface brightness, ergs s-1 cm-2 sr-1, is similar to the surface brightness in large-scale photon-dominated regions in the galactic disk. We investigate two possible excitation mechanisms for the H2 emission: UV-excitation by photons from OB stars, and shock waves, and conclude that UV-excitation is more likely. The total H2 S(1) luminosity in the inner 400 pc region of the Galaxy is 8000 . The ratio of the H2 to far-IR luminosity in the inner 400 pc of the Galaxy agrees with that in starburst galaxies and ultraluminous infrared bright galaxies.
.
H2 EMISSION FROM
THE INNER 400 PC OF THE GALAXY
Soojong Pak, D. T. Jaffe, and L. D. Keller
Department of Astronomy, The University of Texas
Austin, TX 78712
To appear in the Astrophysical Jounal Letters
vol. 457 on Jan. 20, 1996
1 INTRODUCTION
Physical conditions in the interstellar medium of the Galactic center111 We use here the term “Galactic center” to denote the inner several 100 pc region of our Galaxy. We adopt a distance of 8.5 kpc, with which 1° corresponds to 148 pc. are significantly different from those in the solar neighborhood. The thin disk of interstellar material in the Galactic center (size: pc) contains of dense molecular gas, 10 % of the Galaxy’s molecular mass (Güsten 1989). The molecular clouds in the Galactic center have higher density, metallicity, and internal velocity dispersion than the clouds in the solar neighborhood (Blitz et al. 1993). Strong radio continuum radiation from giant H II regions and extended, low-density (ELD) H II (Sofue 1985), as well as far-IR radiation from dust (Odenwald & Fazio 1984), indicate that the UV radiation field is intense. The energetic conditions in the Galactic center can provide a unique view of the interaction between stellar UV radiation and molecular clouds, and a nearby example for the nuclei of other galaxies.
Ro-vibrational lines of H2 trace Photon-dominated Regions (PDRs) where far-UV photons excite the H2 and shocked regions where the H2 is thermally excited. As a result, the central regions ( kpc) in starburst galaxies are powerful emitters of near-IR H2 emission (Puxley, Hawarden, & Mountain 1989; Joseph 1989; Lester et al. 1990; Moorwood & Oliva 1990). Vigorous star formation in these galaxies produces large numbers UV photons which can excite H2, while subsequent supernovae can shock excite the H2.
Gatley et al. (1984, 1986) and Gatley & Merrill (1993) have observed H2 emission from the inner 5 pc diameter (2′) in the Galactic Center, a much smaller region than those observed in starburst galaxies. With the University of Texas Near-Infrared Fabry-Perot Spectrometer (Luhman et al. 1995), it is now possible to observe H2 emission over much larger angular scales. We describe here a program to map the Galactic center in H2 emission on a scale of several degrees (several hundred pc), and discuss the likely H2 excitation mechanism. We can then compare the central region of our Galaxy with those in other galaxies.
2 OBSERVATIONS
We observed the H2 S(1) ( µm) line at the McDonald Observatory 0.91 m telescope in 1994 May and June, using the University of Texas Near-Infrared Fabry-Perot Spectrometer (Luhman et al. 1995). To select a single order from the Fabry-Perot interferometer, we used a 1 % interference filter cooled to 77 K. The telescope (f-ratio 13.5), a collimator (effective focal length 343 mm), and a field lens (effective focal length 20 mm) combined to produce a beam diameter of 33 (equivalent disk).
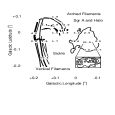
The Fabry-Perot interferometer operated in 92nd order with an effective finesse of 17.7, yielding a spectral resolution (FWHM) of 184 km s-1. The scanning spectral range was km s-1 centered at VLSR = 0, with 20 sequentially exposed channels. We nodded the telescope between the object and the sky every seconds to subtract background and the telluric OH line emission. The sky positions were offset by in declination () from the object positions. The telescope pointing error was . We made a strip map along the Galactic plane running across Sgr A∗, at , from (178 pc) to (237 pc), taking spectra at 01 or 02 intervals (Figure 1). We also mapped the central 50 pc region including Sgr A and the radio “Arc” (the arched filaments and the vertical filaments, Yusef-Zadeh, Morris, & Chance 1984) on a 005 grid (see Figure 2). The relative flux calibration is accurate to 15 %̃.
3 RESULTS
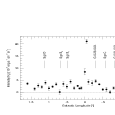
There is H2 emission throughout the 400 pc diameter region around the Galactic Center. About 70 % of the observed positions along the strip at have detections of the H2 S(1) line with a significance of or more. Figure 1 shows the intensity distribution of H2 S(1) along the strip. The H2 intensity peaks strongly at Sgr A and decreases continuously from to . The “dust ridge” seen in 800 m continuum emission (Lis & Carlstrom 1994) may cause the dip between to . Away from the nucleus, the intensity distribution is fairly flat.
Figure 2 shows the H2 S(1) intensity distribution in the inner 50 pc of the Galaxy overlayed on a simplified radio continuum map (based on Yusef-Zadeh, Morris, & Chance 1984). We have detected H2 emission in the arched filaments and in the Sickle at levels comparable to those of the H2 emission elsewhere along the Plane. The inset in Figure 2 shows the S(1) distribution in the region around Sgr A West mapped by Gatley et al. (1986). In Gatley’s work, the H2 appears to be brightest along the inner edge of the circum-nuclear gas ring at radius of pc. Our measured flux at (, ), ergs s-1 cm-2, agrees within the errors with the total flux from the map of Gatley et al. (1986, ergs s-1 cm-2). The H2 emission observed adjacent to (, ) most likely arises from portions of the circum-nuclear ring beyond their map.
4 DISCUSSION
4.1 Extinction Correction
At 2.2 m, the emission from the Galactic center is attenuated by interstellar material in the foreground (“foreground extinction”, mostly 4-8 kpc from the Galactic Center) and by material in the Galactic center itself (“Galactic center extinction”). Catchpole et al. (1990) mapped the extinction toward the Galactic center by observing the near-IR reddening of giant stars in the central few hundred parsecs. Along our H2 strip at b= –005 (for –06+06), the extinction is fairly uniform with a value A2.5 mag. Although most of this extinction is in the foreground, some of it could occur within the Galactic center since Catchpole et al. (1990) were able to identify patches in their maps with A2.5 with known molecular clouds in the Galactic center (see plate 4 in Glass et al. 1987). Based on this work, we adopt AK=2.5 for the foreground extinction.
The Galactic center extinction greatly exceeds the foreground extinction. Typical 12CO J=10 linestrengths along the strip we have surveyed in H2 are 1500 Kkms-1 (Oort 1977). This line strength implies an AK of 10–40 mag, depending on the CO/H2 and AK/H2 ratios in the Galactic center (Sodroski et al. 1994). The extinction through individual clouds may also be substantial (A10–30 for a 10 pc long cloud with n=104 cm-3). The relevance of the Galactic center extinction depends on the source of the H2 emission. Any H2 emission originating within the clouds will be highly extincted. If the H2 emission arises on the cloud surfaces, however, we only miss the H2 flux from the back side of each cloud.
Clouds lying in front of other clouds will further reduce the flux reaching us from the front surfaces. If, in the Galactic Center, the velocity integrated area filling factor of clouds, f, is substantially greater than unity, extinction by overlapping clouds will reduce the H2 flux observed from the front surfaces by a factor in addition to the foreground extinction and to the loss of emission on the opposite sides of the clouds. Typical clouds in the Galactic center disk have kinetic temperatures 70 K and linewidths 20 km s-1 (Güsten 1989). An ensemble of such clouds could produce the observed 12CO J=10 lines in the Galactic center with f1. We therefore conclude that the extinction of any H2 emission from cloud surfaces facing the sun beyond the foreground extinction of AK= 2.5 discussed above is not substantial. Since the extinction of emission from within the clouds or from the sides facing away from us is difficult to estimate and since no correction is usally made for such effects in giant molecular clouds and galactic nuclei, we make no additional extinction corrections here.
4.2 UV Excitation of H2
If one ignores the region immediately around Sgr A∗, the de-reddened ( mag, see Section 4.1) H2 S(1) surface brightness along the Galactic plane has a roughly constant value of ergs s-1 cm-2 sr-1. Any excitation mechanism for the H2 must be able to explain both the absolute intensity and the uniformity and extent of the emission. The excitation of the H2 , state can result either from radiative decay from UV-excited electronic states or from energetic collisions. H2 can absorb 91–123 nm photons in the Lyman and Werner bands. About 90% of the time, the excited H2 decays to some ro-vibrational level of the ground electronic state. The relative line intensities arising in UV-excited H2 are insensitive to density or to UV field strength if cm-3 (Black and van Dishoeck 1987). At densities cm-3, UV-excited gas can become hot enough that collisions populate states with (Sternberg and Dalgarno 1989). Collisional excitation can also result from shocks which abruptly heat the gas to K (e.g. Hollenbach, Chernoff, & McKee 1989). Several observational results lead us to believe that UV excitation can explain the S(1) emission in the Galactic Center.
The denser parts of clouds like Orion and NGC 2024 produce H2 emission with an intensity close to that observed in the Galactic Center. In Orion and NGC 2024, the degree-scale H2 emission has a typical surface brightness ergs s-1 cm-2 sr-1 (Luhman et al. 1994). Along the molecular ridges in these clouds, the H2 surface brightness is 3-5 times higher. Observations of H2 transitions arising from higher-lying states indicates that, in these sources, the S(1) emission is a result of UV fluorescence.
If large-scale H2 emission arises in the surface layers of the clouds where UV photons can excite the molecules, the dust, which absorbs the bulk of the incident flux, ought to radiate in the far-IR continuum as well. Luhman & Jaffe (1996) have compared the H2 S(1) observations of clouds in the galactic disk with IRAS far-IR continuum results and derived a relation between the H2 S(1) line and far-IR continuum intensities. We can use this relationship and the measured far-IR intensities in the Galactic center to see if UV-excitation is plausible for our observed S(1) emission. In most of the region along our Galactic center H2 cut, the IRAS 100 m band detectors were saturated. In order to compare the Galactic center H2 data to far-IR continuum measurements with comparable angular resolution, we have combined the un-saturated IRAS measurements from the outer ends of our H2 strip with the 40–250 m continuum measurements of Odenwald and Fazio (1984). To make the two data sets comparable, we have first converted the IRAS 60 m and 100 m fluxes into a total far-IR flux (the FIR parameter of Fullmer and Lonsdale 1989). The IRAS total far-IR flux agrees well with the far-IR flux derived by Odenwald and Fazio in the regions where their data and the unsaturated IRAS data overlap. We then converted the combined datasets into integrated far-IR intensity for comparison with our H2 strip. We used the Luhman & Jaffe galactic disk H2 dataset to re-derive their H2/far-IR relation in intensity units. We obtain,
where both intensities are in ergs s-1 cm-2 sr-1. The dispersion of the galactic disk cloud H2 intensities about this relation is log() = 0.23. If we de-redden the Galactic center H2 observations by = 2.5 mag (but otherwise do nothing to fit the data to the galactic disk relation), the Galactic center H2 intensities have a dispersion log() = 0.26 about this relation. The Galactic center results are therefore completely consistent with the empirical far-IR vs. H2 relationship derived for the UV-excited surfaces of clouds in the galactic disk.
We can also compare the H2 line intensities predicted by models of photon-dominated regions to the observed intensities. The models use indirect observations of the far-UV field in the Galactic center (radio and far-IR continuum fluxes) as inputs. For the radio, we predict the far-UV field using emission from extended, low-density (ELD) H II regions because the molecular cloud column densities, and therefore the extinction at the wavelength of H2, tend to be high (and uncertain) toward the discrete H II regions. Away from discrete H II regions, the typical 10.5 GHz flux density is 2.2 Jy in a 33 beam (Sofue 1985). Assuming K, this flux density corresponds to sec-1 Lyman continuum photons per second (Mezger, Smith, & Churchwell 1974), in the corresponding region (8.2 pc). For an ionizing source with an effective stellar temperature, K as the UV source, the 2.31049 Lyman continuum photons imply 2.31049 photons in the range which can excite the H2 (91-123 nm), or a luminosity of (Black & van Dishoeck 1987). From our observations, the average H2 flux in a 33 beam is ergs s-1 cm-2. The corresponding total H2 luminosity in the 8.2 pc (33) region is , if we correct for an extinction of mag and use the PDR model of Black & van Dishoeck (1987) to extrapolate to the H2 cooling in all lines ( ). The ratio of the near-IR H2 luminosity to the luminosity in the far-UV band that is effective in exciting H2 is 0.028, which is close to the value of 0.034 from an appropriate PDR model for the Galactic center (Model 19 in Black & van Dishoeck 1987, which has nH = 104 and a UV field IUV = 103).
The far-IR continuum intensities along our Galactic center strip are typically 0.8 ergs s-1 cm-2 sr-1 (Odenwald and Fazio 1984). If all of this emission arises from a single molecular cloud surface filling the beam, it corresponds to a far-UV flux times the mean interstellar radiation field in the solar neighborhood (Draine 1978). Given the likely number of clouds along each line of sight and various geometric effects, the likely far-UV field is times the solar neighborhood value. For this range of UV field strengths and densities between 3103 and 3104 cm-3, Black and van Dishoeck (1987) predict H2 S(1) line intensities in the range ergs s-1 cm-2 sr-1, bracketing our typical observed, de-reddened value.
The H2 emission from the circum-nuclear disk appears to be collisionally excited (Iv=2-1S(1)/Iv=1-0S(1)) , Gatley et al. 1984). Gatley et al. suggest that shocks created by mass outflow from the Galactic nucleus might excite the H2. Such thermal line ratios can also occur, however, in UV-excited gas if the UV fields and densities are sufficiently high (Sternberg and Dalgarno 1989; Luhman et al. 1996). Since the typical hydrogen density in the circum-nuclear disk is large, i.e., , and the UV field is intense in the central 3 pc, (the number of total Lyman continuum photons absorbed by the gas is , Lacy et al. 1980), the strength and character of the H2 emission from the circumnuclear disk are also consistent with UV-excitation.
4.3 Shock-Excitation
Shock excitation of the H2 S(1) transition must take place, at some level, in the inner 400 pc of the Galaxy. A large variety of dynamical activity may give rise to shocks with appropriate characteristics. Outflows around newly formed stars and shocks caused by supernova remnants impinging on molecular clouds in the galactic disk both produce H2 emission and should be observable in the Galactic Center. Bally et al (1987; 1988) surveyed the Galactic center region in the 12CO and 13CO , and CS lines. The gas distribution is highly asymmetric about the center, and some negative velocity gas is seen at positive longitudes, which is “forbidden” to gas in circular orbits. This gas and other clouds with eccentric orbits may collide with material in more circular orbits. For example, in the Sgr B2 complex, Hasegawa et al. (1994) suggested that a dense (), “Clump” has collided with the extended less dense “Shell” of the cloud complex producing a shock. Finally, the internal velocity dispersion of the molecular clouds is in the range of (Bally et al. 1988). If the internal collisions efficiently dissipate the relative kinetic energy by radiative cooling following shocks, there should be H2 emission throughout the molecular clouds, much of it, however, heavily extincted.
Depending on the context, shock-excited H2 emission could result either from dissociative J-shocks (colliding clouds, supernova remnants), or from C-shocks (outflows, dissipation of turbulence). The J-shocks give rise to H2 S(1) intensities in the range of 310-5 – 10-4 ergs s-1 cm-2 sr-1 with the intensity being fairly insensitive to density and shock velocity over the range 104 cm n 105 cm-3 and 30 km s v 150 km s-1 (Hollenbach & McKee 1989). For AK = 2.5 mag, the predicted intensity matches what we observe in the Galactic center fairly well. In order to explain the distribution of observed H2 emission, however, the number of shock fronts times the area covered per beam must roughly equal the beam area along virtually every line of sight through the inner 400 pc of the Galaxy, an unlikely picture at best.
C-shocks can produce H2 S(1) intensities in the range of those observe in the Galactic Center. A single C-shock with n = 104 cm-3 and V = 20 km s-1 gives IS(1) 310-5 ergs s-1 cm-2 sr-1 (Draine, Roberge, & Dalgarno 1983). The emergent intensity, however, is extremely sensitive to the shock velocity, varying (at nH = 104 cm-3) by 3 orders of magnitude from Vshock = 18 to Vshock = 40 km s-1. A model making use of C-shocks to produce the observed uniform H2 S(1) distribution would have to be somewhat contrived. While there may be some shock-excited H2 emission from the Galactic Center, it is difficult to argue away the expected PDR emission and then construct a reasonably simple shock model capable of explaining the observations. A reliable test of the excitation mechanism would be to observe H2 transitions arising higher above ground than the S(1) line.
4.4 Total H2 Luminosity
To estimate the total H2 luminosity of the Galactic Center, we extrapolate from our 400 pc long strip by assuming that the scale height of the H2 emission equals that of the far-IR radiation (, Odenwald & Fazio 1984). For mag and (see Section 4.1), the de-reddened H2 S(1) luminosity in the inner 400 pc diameter of the Galaxy is . Joseph (1989) gives ranges of H2 S(1) luminosity in kpc regions for various classes of galaxies: (1) merging galaxies: ; (2) interacting galaxies: ; (3) barred spirals: . Over its inner kpc, our Galaxy most likely falls within the range for barred spirals.
In ultraluminous infrared bright galaxies (), Goldader et al. (1995) show that log() . For the nearby starburst M82. we can use H2 S(1) measurements of the inner 60″ (Pak & Jaffe, unpublished) together with far-IR continuum observations (D. A. Harper, as quoted in Lugten et al. 1986) to derive log(LS(1)/LFIR) = for the inner 1 kpc. For the inner 400 pc of the Milky Way, the data presented here yield log(LS(1)/LFIR) = .
There is evidence in some high-luminosity galaxies that the H2 emission results from UV-excitation. In NGC 3256, a merging galaxy, the H2 S(1)/ S(1) line ratio in the 600 pc region () is , suggesting that UV fluorescence is responsible for at least 60 % of the H2 S(1) emission (Doyon, Wright, & Joseph 1994) . If H2 in the Galactic center is UV-excited, as we suggest here, this mechanism could be shared by H2 emission from galaxies with an enormous range of nuclear conditions.
References
- (1)
- (2) Altenhoff, W. J., Downes, D., Pauls, T., & Schraml, J. 1978 A&AS, 35, 23
- (3) Bally, J., Stark, A. A., Wilson, R. W., & Henkel, C. 1987, ApJS, 65, 13
- (4) Bally, J., Stark, A. A., Wilson, R. W., & Henkel, C. 1988, ApJ, 324, 223
- (5) Black, J. H., & van Dishoeck, E. F. 1987, ApJ, 322, 412
- (6) Blitz, L., Binney, J., Lo, K. Y., Bally, J., Ho, P. T. P. 1993, Nature, 361, 417
- (7) Catchpole, R. M., Whitelock, P. A., & Glass, I. S. 1990, MNRAS, 247, 479
- (8) Doyon, R., Wright, G. S., & Joseph, R. D. 1994, ApJ, 421, 115
- (9) Draine, B.T. 1978, ApJS, 36, 595
- (10) Draine, B. T., Roberge, W. G., & Dalgarno, A. 1983, ApJ, 264, 485
- (11) Fullmer, L. & Lonsdale, C. 1989, Catalogued Galaxies and Quasars Observed in the IRAS Survey, version 2, (Pasadena: Infrared Processing and Analysis Center, JPL D-1932).
- (12) Gatley, I., Jones, T. J., Hyland, A. R., Beattie, D. H., Lee, T. J. 1984, MNRAS, 210, 565
- (13) Gatley, I., Jones, T. J., Hyland, A. R., Wade, R., Geballe, T. R., & Krisciunas, K. 1986, MNRAS, 222, 299
- (14) Gatley, I, & Merrill, M. 1993, in SPIE Vol. 1946, Infrared Detectors and Instrumentation, ed. A. M. Fowler, 2
- (15) Glass, I. S., Catchpole, R. M., & Whitelock, P. A. 1987, MNRAS, 227, 373
- (16) Goldader, J. D., Joseph, R. D., Doyon, R., & Sanders, D. B., 1995, ApJ, 444, 97
- (17) Güsten, R. 1989, in IAU Symp. 136, The Center of the Galaxy, ed. M. Morris (Dordrecht: Kluwer), 89
- (18) Hasegawa, T., Sato, F., Whiteoak, J. B., & Miyawaki, R. 1994, ApJ, 429, L77
- (19) Hollenbach, D. J., Chernoff, D. F., &McKee, C. F. 1989, in Proc. 22nd ESLAB Symposium, Infrared Spectroscopy in Astronomy, ed. B. Kaldeich (Noordwijk: ESA SP-290), 245
- (20) Hollenbach, D.J., & McKee, C.F. 1989, ApJ, 342, 306
- (21) Joseph, R. D. 1989, in Proc. 22nd ESLAB Symposium, Infrared Spectroscopy in Astronomy, ed. B. Kaldeich (Noordwijk: ESA SP-290), 439
- (22) Lacy, J. H., Townes, C. H., Geballe, T. R., & Hollenbach, D. J. 1980, ApJ, 281, 132
- (23) Lester, D. F., Carr, J. S., Joy, M., & Gaffney, N. 1990, ApJ, 352, 544
- (24) Lis, D. C., & Carlstrom, J. E. 1994, ApJ, 424, 189
- (25) Lugten, J.B., Watson, D.M., Crawford, M.K., & Genzel, R. 1986, ApJ, 311, L51
- (26) Luhman, M.L., & Jaffe, D.T. 1996, ApJ, in press
- (27) Luhman, M. L., Jaffe, D. T., Keller, L. D., & Pak, S. 1994, ApJ, 436, L185
- (28) Luhman, M. L., Jaffe, D. T., Keller, L. D., & Pak, S. 1995, PASP, 107, 184
- (29) Luhman, M. L., Jaffe, D. T., Sternberg, A., Herrmann, F., & Poglitsch, A. 1996, ApJ, in preparation
- (30) Mezger, P. G., Smith, L. F., & Churchwell, E. 1974, A&A, 32, 269
- (31) Moorwood, A. F. M., & Oliva, E. 1990, A&A, 239, 78
- (32) Odenwald, S. F., & Fazio, G. G. 1984, ApJ, 283, 601
- (33) Oort, J. 1977, ARA&A, 15, 295
- (34) Puxley, P., Hawarden, T., & Mountain, M. 1988 in Proc. 22nd ESLAB Symposium, Infrared Spectroscopy in Astronomy, ed. B. Kaldeich (Noordwijk: ESA SP-290), 517
- (35) Sodroski, T.J. et al. 1994, ApJ, 428, 638
- (36) Sofue, Y. 1985, PASJ, 37, 697
- (37) Sternberg, A., & Dalgarno, A. 1989, ApJ, 338, 197
- (38) Yusef-Zadeh, F., Morris, M., & Chance, D. 1984, Nature, 310, 557
- (39)