H2 Emission from the Inner 400 Parsecs of the Galaxy
II. The UV–Excited H2
Abstract
We have observed near–IR H2 line emission on large scales in the Galactic center. Paper I discussed our 400 pc long strip map and 50 pc map of the H2 line. In this paper, we present observations of the higher vibrational lines (H2 and ) at selected positions and conclude that strong far–UV radiations excites the H2. We compare the H2 emission to far–IR continuum emission and show that the ratio of these two quantities in the Galactic center equals the ratio seen in the starburst galaxies, M82 and NGC 253, and in ultraluminous infrared bright galaxies.
Astronomy Department, University of Texas, Austin, TX 78712
1. Introduction
The central kpc regions in starburst galaxies and ultraluminous IR bright galaxies are powerful emitters of near-IR H2 emission (Puxley, Hawarden, & Mountain 1990; Goldader et al. 1995). Ro–vibrational lines of H2 can trace both photon–dominated regions (PDRs), where far–UV photons excite the H2, and shocked regions, where the H2 is thermally excited. Vigorous star formation in these galaxies produces large numbers of UV photons which fluorescently excite H2, while subsequent supernovae shock–excite the H2.
We have used the University of Texas near–IR Fabry–Perot Spectrometer, to survey giant molecular clouds (GMCs) on pc scales (Luhman et at. 1994; Luhman & Jaffe 1996; Luhman et al. 1996). In Orion A, for example, the H2 line emission extends up to 8 pc (1∘) from the central UV source, Ori C. The detection of higher vibrational state H2 lines, e.g., and , showed that far–UV photons excite the H2. Although the shock–excited H2 emission is intense in the Orion region, the emission region is relatively compact (). The total H2 luminosity in the region is only of the Orion PDR H2 luminosity. Similarly, UV–excited H2 dominates the large–scale H2 emission from other GMCs.
We have observed the H2 emission in the inner pc () of our Galaxy in order to investigate H2 emission on a more global scale and to compare the Galactic center with central kpc regions in external galaxies. The physical conditions in the interstellar medium of the Galactic center are significantly different from those in the solar neighborhood. The thin disk (diameter of 450 pc, height of 40 pc) of dense interstellar material in the Galactic center contains M(H2) (Güsten 1989; Hasegawa et al. 1996). The molecular clouds in the Galactic center have higher density, higher metallicity, and higher internal velocity dispersion than the clouds in the solar neighborhood (Blitz et al. 1993). There is strong radio continuum radiation from giant H II regions (Sgr A, Sgr B, Sgr C, and Sgr D) and extended low–density (ELD) ionized gas. The spectral index in the areas away from the discrete H II regions shows that thermal bremsstrahlung from ionized gas can account for about half of the emission from the extended gas (Sofue 1985). Another indicator of the intense UV radiation in the central 400 pc is strong far–IR continuum emission (Odenwald & Fazio 1984). About 90% of the far–UV energy is absorbed by dust and reradiated in the far–IR. From the far–IR intensity, we estimate that the far–UV radiation field is times the value in the solar neighborhood ( ergs s-1 cm -2 sr-1, Draine 1978). The energetic conditions in the Galactic center mean that the center can provide a unique view of the interaction between stellar UV radiation and molecular clouds, and serve as a nearby model for the nuclei of galaxies.
In paper I (Pak, Jaffe, & Keller 1996) we showed the distribution of H2 emission along a 400 pc–long strip and in the inner 50 pc of the Galactic center. We detected H2 emission throughout the surveyed region. The typical dereddened ( mag) H2 intensity, ergs s-1 sr-1, is similar to the surface brightness in Galactic PDRs (Luhman & Jaffe 1996). In this Paper, we present observations of several H2 lines, discuss the excitation mechanism, and compare the Galactic center observations to observations of other galaxies.
2. Observations and Results
We observed three H2 emission lines: (), (), and (), at the Cerro Tololo Inter–American Observatory 1.5 m telescope in 1995 July and October. We used the University of Texas Near–Infrared Fabry–Perot Spectrometer. The instrument was specially designed to observe very extended, low surface brightness objects, and has a single channel InSb detector with surface area of 1 mm to maximize the beam size (Luhman et al. 1995). The telescope (), a collimator (effective focal length 686 mm), and a field lens (effective focal length 20mm) produce a beam diameter of 135 (equivalent disk).
The Fabry–Perot interferometer operates in 94th order () with an effective finesse of 26, yielding a spectral resolution of 125 km s-1 (FWHM). Scans covered in 15 sequential steps, km s-1 centered at km s-1. In order to subtract background and telluric OH line emission, we chopped the secondary mirror to = or at 0.5 Hz.
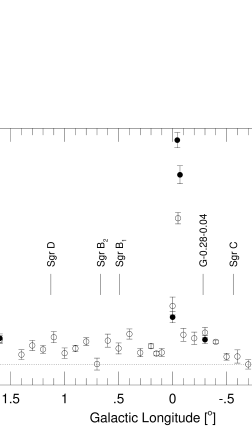
We observed five positions: (, ) = (, ), (, ), (, ), (, ), and (, ). In Figure 1, we plot the new H2 data overlaid on the data from Paper I and compare the two data sets. The 33 beam of the McDonald 0.9 m telescope centered at Sgr A∗ () covers the whole circumnuclear gas ring (Gatley et al. 1986), while, with the 135 beam of the CTIO 1.5 m telescope, we observed the H2 peak () and the H2 peak (). The difference between the 33 beam data and the 135 beam data toward Sgr A is an effect of different beam sizes because the H2 emission sources are relatively compact. In the large–scale emission beyond Sgr A, the two data sets agree to within the errors, indicating that the H2 emission varies slowly on scales.
3. Extinction Correction
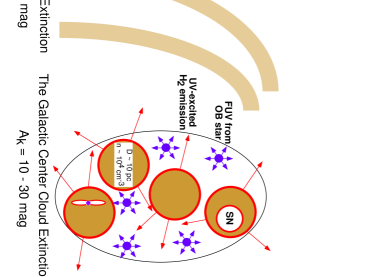

The extinction in K–band toward the Galactic center is significant. Figure 2a shows the classification of the extinction into foreground extinction by material in spiral arms at kpc, and Galactic center extinction by material in the Galactic center clouds. Catchpole, Whitelock, & Glass (1990) measured the foreground extinction as mag.
A discussion of the Galactic center extinction requires a different approach because individual clouds in the Galactic center are almost opaque in the near–IR ( mag for typical clouds of 10 pc and () cm-3). If the UV–excited H2 emission arises on the cloud surfaces, we need only consider the effects of shadowing by other Galactic center clouds (see Figure 2b). From millimeter observations of 12CO emission, we can estimate the velocity–integrated area filling factor of clouds, . If the millimeter telescope beam size is smaller than the individual clouds and covers only one cloud along the line–of–sight, the area filling factor, , is 1. The upper diagram in Figure 2b shows an expected 12CO spectrum of typical clouds in the Galactic center which have kinetic temperature of K and line widths of km s-1 (Güsten 1989). In general, the clouds have different sizes and may overlap along the line–of–sight. The lower diagram in Figure 2b shows an observed typical 12CO spectrum where the velocity–integrated intensity is K km s-1 (Bally et al. 1987; Bally et al. 1988). The value is the ratio of the observed velocity–integrated intensity of 12CO to the single typical cloud intensity (70 K 20 km s-1). The toward the Galactic center clouds is , implying that there is little or no overlap along a typical line–of–sight. If , we only miss the near–IR H2 flux from the back sides of the clouds. If , H2 radiation is blocked by the foreground clouds, and the ratio of the observed H2 flux to the emitted flux is inversely proportional to . Since , we use the foreground values, , for the extinction correction.
4. H2 Excitation Mechanism
4.1. H2 Line Ratios
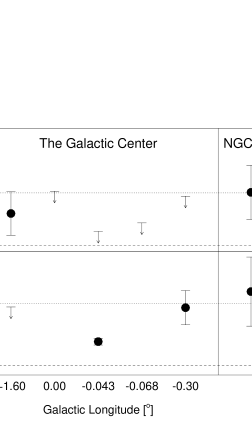
In UV–excited H2, the branching ratios in the downward cascade determine the relative strengths of the near–IR lines. On the other hand, the energy level populations of shock–excited H2 are thermalized. We use the line intensity ratios of higher vibrational level lines to the line in order to identify the H2 excitation mechanism.
In Figure 3, the observed ratios in the large–scale Galactic center and the central 1 kpc region of NGC 253 imply that the H2 emission may result from UV–excitation. In the circumnuclear gas ring ( and ), the UV–excited H2 energy levels are partially thermalized because of the relatively high density (Sternberg & Dalgarno 1989; see also Ramsay-Howat, Mountain, & Geballe 1996 for the H2 observations in the circumnuclear gas ring). The determination of line ratios consistent with UV excitation in the large–scale Galactic center and NGC 253 means the gas is not dense enough for collisions to significantly alter the radiative cascade, n(H2) cm-3 (Luhman et al. 1996).
4.2. versus
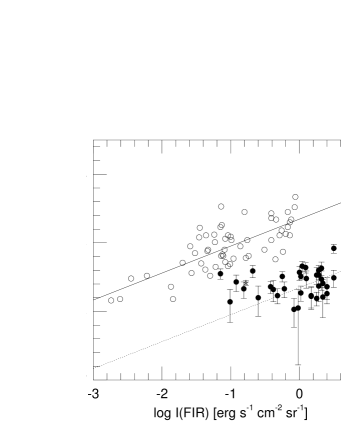
If large–scale H2 emission arises in the surface layers of the clouds where far–UV photons can excite the molecules, the dust, which absorbs the bulk of the incident flux, ought to radiate in the far–IR continuum as well. If we de–redden the Galactic center H2 observations by = 2.5 mag, the Galactic center results are consistent with the empirical far–IR vs. H2 relationship derived for the UV–excited surfaces of clouds in the galactic disk (see Figure 4).
5. Comparison with other Galaxies
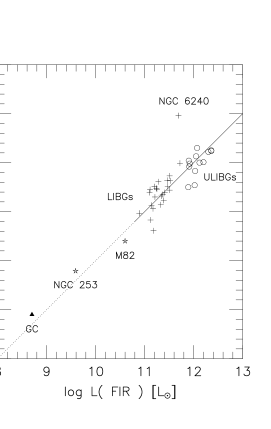
We extrapolate from our 400 pc long strip to the total H2 luminosity of the Galactic Center by assuming that the scale height of the H2 emission equals that of the far–IR radiation (, Odenwald & Fazio 1984) and that mag and . The H2 luminosity in the inner 400 pc diameter of the Galaxy is .
For ultraluminous and luminous infrared bright galaxies ( ), Goldader et al. (1995) showed the correlation between and . We can extend the relationship to nearby starburst galaxies like M82 and NGC 253, and to the Galactic center (see Figure 5). The strong correlation between the far-IR and H2 luminosity for various classes of galaxies indicates that the far–UV radiation may excite large scale H2 emission in all of these sources.
Acknowledgments.
This work was supported by NSF grant AST 9117373 and by David and Lucile Packard Foundation. We thank M. Luhman and T. Benedict for contributions to the Fabry–Perot Spectrometer Project, and J. Elias, B. Gregory, and the staff of the CTIO for their assistance in setting up our instrument.
References
Bally, J., Stark, A. A., Wilson, R. W., & Henkel, C. 1987, ApJS, 65, 13
Bally, J., Stark, A. A., Wilson, R. W., & Henkel, C. 1988, ApJ, 324, 223
Black, J. H., & van Dishoeck, E. F. 1987, ApJ, 322, 412
Blitz, L., Binney, J., Lo, K. Y., Bally, J., Ho, P. T. P. 1993, Nature, 361, 417
Catchpole, R. M., Whitelock, P. A., & Glass, I. S. 1990, MNRAS, 247, 479
Draine, B.T. 1978, ApJS, 36, 595
Draine, B. T., Roberge, W. G., & Dalgarno, A. 1983, ApJ, 264, 485
Gatley, I., Jones, T. J., Hyland, A. R., Wade, R., Geballe, T. R., & Krisciunas, K. 1986, MNRAS, 222, 299
Goldader, J. D., Joseph, R. D., Doyon, R., & Sanders, D. B. 1995, ApJ, 444, 97
Güsten, R. 1989, in IAU Symp. 136, The Center of the Galaxy, ed. M. Morris (Dordrecht: Kluwer), 89
Hasegawa, T., Oka, T., Handa, T., Hayashi, M., & Sakamoto, S. 1996, this volume
Luhman, M.L., & Jaffe, D.T. 1996, ApJ, 483(May 20 issue)
Luhman, M. L., Jaffe, D. T., Keller, L. D., & Pak, S. 1994, ApJ, 436, L185
Luhman, M. L., Jaffe, D. T., Keller, L. D., & Pak, S. 1995, PASP, 107, 184
Luhman, M. L., Jaffe, D. T., Sternberg, A., Herrmann, F., & Poglitsch, A. 1996, ApJ, in preparation
Odenwald, S. F., & Fazio, G. G. 1984, ApJ, 283, 601
Pak, S., Jaffe, D. T., & Keller, L. D. 1996, ApJ, 457, L43 (Paper I)
Puxley, P. J., Hawarden, T. G., & Mountain, C. M. 1990 ApJ, 364, 77
Ramsay-Howat, S., Mountain, C. M., & Geballe, T. R. 1996, this volume
Sofue, Y. 1985, PASJ, 37, 697
Sternberg, A., & Dalgarno, A. 1989, ApJ, 338, 197