A companion to a quasar at redshift 4.7
Patrick Petitjean⋆†,
Emmanuel Pécontal‡,
David Valls–Gabaud§ &
Stéphane Charlot⋆
⋆Institut d’Astrophysique de Paris – CNRS,
98 bis, Boulevard Arago, F-75014 Paris, France.
†DAEC, URA CNRS 173, Observatoire de Paris-Meudon,
F-92195 Meudon, France.
‡Centre de Recherche Astronomique de Lyon, CNRS UMR142,
9, Avenue Charles André,
F-69561 Saint-Genis-Laval, France.
§URA CNRS 1280, Observatoire de Strasbourg,
11, rue de l’Université, F-67000 Strasbourg, France.
There is a growing consensus that the emergence of quasars at high redshifts is related to the onset of galaxy formation1, suggesting that the detection of concentrations of gas accompanying such quasars should provide clues about the early history of galaxies. Quasar companions have been recently identified at redshifts up to (refs 2-4). Here we report observations of Lyman- emission (a tracer of ionised hydrogen) from the companion to a quasar at =4.702, corresponding to a time when the Universe was less than ten per cent of its present age. We argue that most of the emission arises in a gaseous nebula that has been photoionised by the quasar, but an additional component of continuum light –perhaps quasar light scattered from dust in the companion body, or emission from young stars within the nebula– appears necessary to explain the observations. These observations may be indicative of the first stages in the assembly of galaxy-sized structures.
The bright quasar BR 1202–0725 was discovered in the Automatic Plate Measuring optical survey for quasars with 4 (ref. 5, see also ref. 6). The emission redshift is uncertain because Ly absorption produced by a foreground metal line system is present at a redshift = 4.687 (ref. 7) that is much higher (by 5000 km s-1) than the redshift inferred from intermediate resolution spectroscopy7,8 for the C iv emission line of the quasar.
We used the integral field spectrograph TIGER9 (Traitement Intégral des Galaxies par l’Etude de leurs Raies) mounted on the 3.60 m Canada-France-Hawai Telescope during a windy run on 4–7 February 1995. The instrument samples the field of view through an array of micro-lenses, each providing a spectrum. Because of the windy weather during the observations, only two exposures were useful, corresponding to 2.3 hours of integration. The seeing was 0.7” FWHM (Full Width at Half Maximum) and the instrumental configuration led to a spatial sampling of 0.61” in a circular field of view of 10” diameter centred on the quasar and a spectral sampling of 3.4 Å. The spectral resolution, measured as the FWHM of an arc line, was 10 Å, and the wavelength range was 5850–7100 Å, corresponding to a Ly redshift range of 3.81–4.84. The data were reduced in a standard way.10,11 The 1 noise in the spectra obtained through one lens is 310-19 erg cm-2 Å-1 after sky subtraction. We have then reconstructed 60 Å wide narrow-band images.
The line of sight towards BR 1202–0725 contains a known damped Ly absorption system with an H i column density (H i) 41020 cm-2 at = 4.383 (refs 7,12). Such systems are generally thought to arise in proto-galactic discs13 and so indicate potentially intensive star formation regions. However, we do not detect any emission down to a 3 limit of 3. 10-18 erg cm-2 Å-1arcsec-2 at in a region of 4141 kpc2 (where is the Hubble constant in units of 75 km s-1 Mpc-1 and = 0.5) centred on the quasar. The limit reached, consistent with previous studies, confirms that damped Ly systems are not strong Ly emitters14,15, either because of their small but significant dust content16 or their low duty–cycle of massive star formation17.
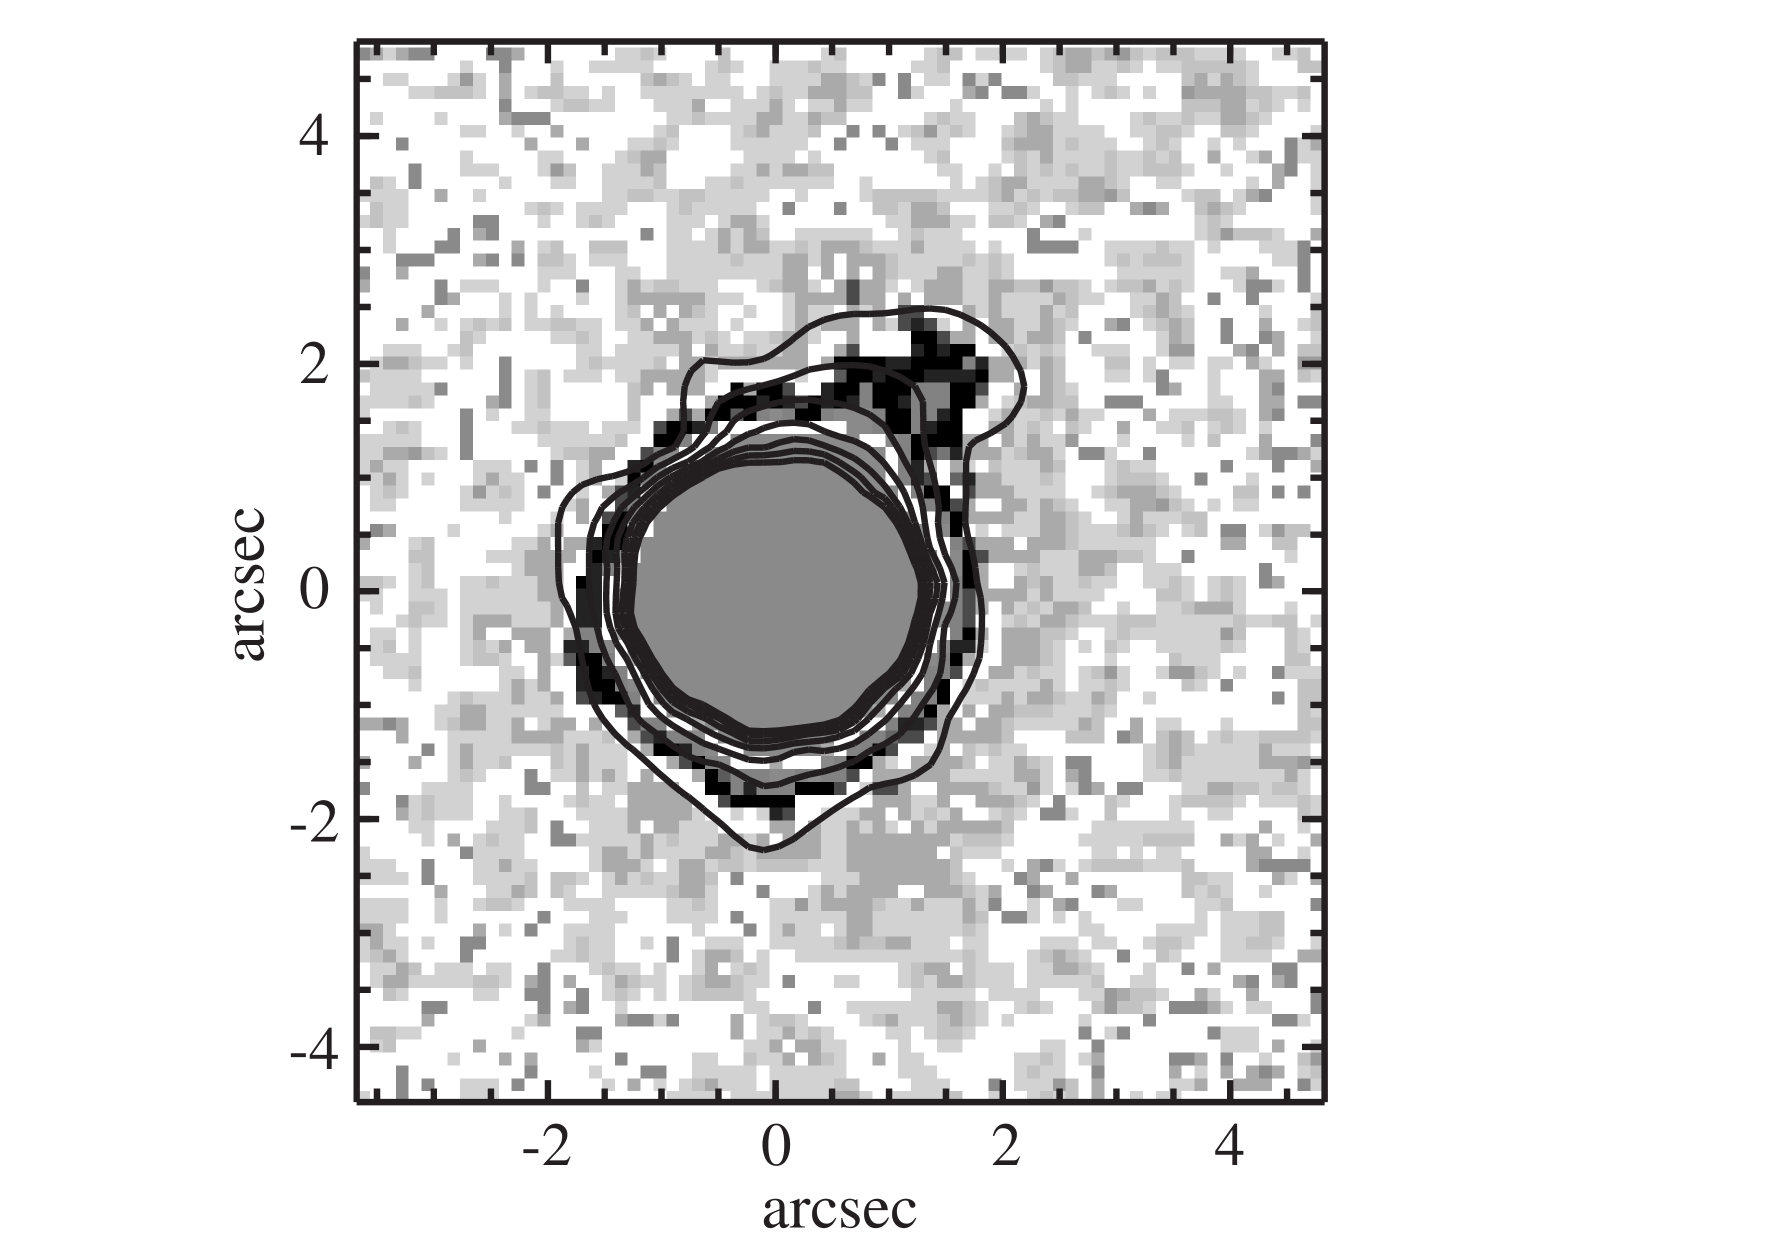
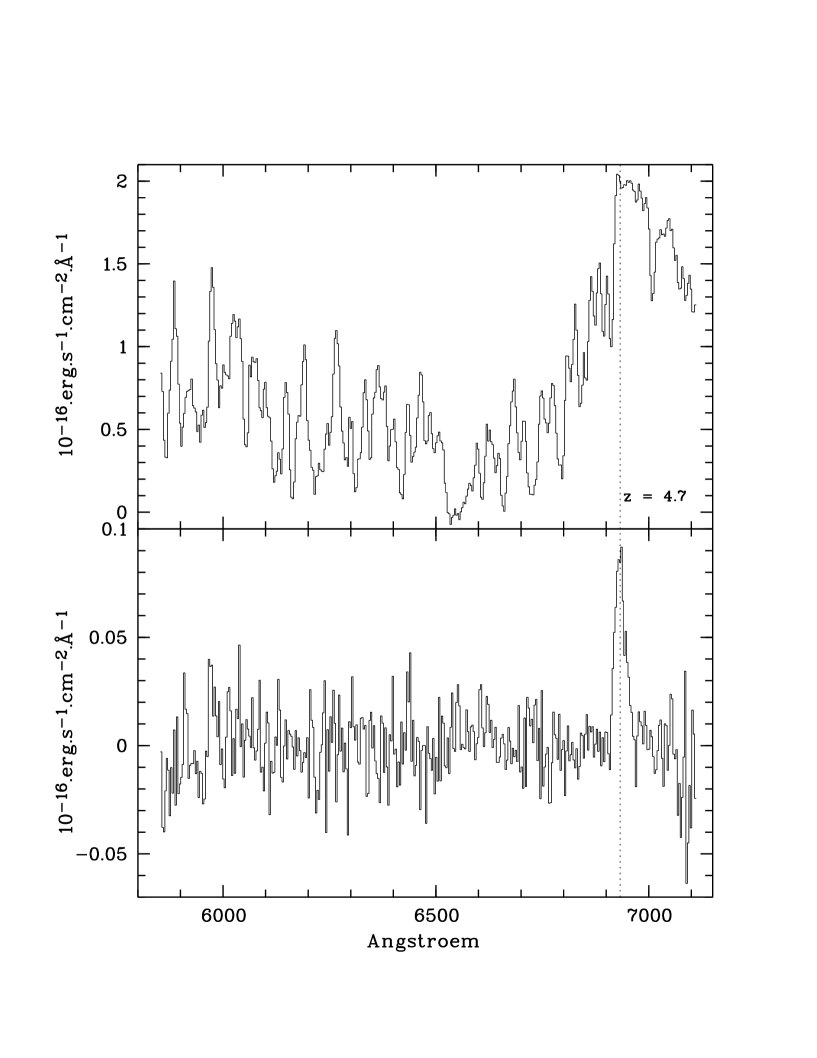
In contrast, the image centred at 6940 Å (see Fig. 1) exhibits a significant (flux greater than 3) North-West extension (region B) with the maximum emission located 2” away from the quasar (or 9 kpc) that coincides spatially with an emission excess previously seen in broad-band and narrow-band filter images20. The contribution of the quasar has been carefully subtracted, and we have coadded the spectra of all lenses in which the extension was detected (Fig. 2). There is a strong line (7 ) centred at 6932 Å. The total flux, integrated over the line, is 2.50.610-16 erg s-1 cm-2. Identifying the line with Ly gives a redshift = 4.702. The emission is spatially resolved and has a maximum north-east/south-west extension of 1.5” after correction from seeing effects.
As we detect only one line, other potential identifications could be H at = 0.056, H at = 0.43 or [Oii]3727 at = 0.86. The probability of gravitational amplification is greatest in the latter two cases but population synthesis models indicate that the broad–band observations are inconsistent with these redshifts. In particular, the colour characterises a steep spectrum that is difficult to reconcile with the lower limit on the magnitude. Strong absorption systems are present at = 1.7544 and 2.4421 (refs. 7,12) in the quasar spectrum, but these redshifts are ruled out since no emission line is expected at 6932 Å.
The detected line coincides in wavelength with the peak of the quasar emission. This is a strong indication that the line is, in fact, Ly emitted by a quasar companion. Moreover, the blue wing of the line is sharp and coincides almost perfectly with the position of the first Ly absorption line seen in the quasar spectrum (see Fig. 3). This coincidence can be accounted for if the same absorber extends from the quasar to region B, implying a projected size of at least 9 kpc.
The Ly flux is 1.7 times larger than the value obtained from previous narrow-band filter imaging20. A thorough check of the photometric quality of our observations using several standard stars yields an uncertainty of less than 20%. In addition, the flux determined for the quasar is consistent with published data8. The line luminosity is 2.11043 erg s-1 and contributes 70% of the -band emission.
The observed flux is similar to that observed for quasar companions at lower redshifts (refs 2,3,21) and much larger than the upper limits set by surveys for primeval galaxies in blank fields22,23. This suggests that the presence of the quasar induces a peculiar interaction with the companion, either in the form of enhanced star formation or because the ionising flux from the quasar contributes to the excitation of the gas. In fact, the ionising flux of the quasar, estimated from the observed magnitude and assuming a standard spectral index , is about 9.31056 photons per second. Under case B recombination, the observed Ly emission of the companion then implies that the fraction of the quasar luminosity intercepted by the gas is about 710-4. If we approximate the cloud as a sphere of diameter 6 kpc, corresponding to a covering factor of 310-2, the filling factor of the gas within the cloud is found to be over 0.02. The true value could be even larger if some of the Ly photons did not escape from the nebula.
The interpretation of the extended emission near the quasar is constrained by the wavelength and equivalent width of the emission line, its contribution to the band flux, the upper limit on the -band emission, and the four broad-band fluxes. These constraints taken simultaneously rule out the possibility that the emission line is not Ly at the redshift of the quasar. We consider hereafter two extreme models: a starburst galaxy and a gaseous nebulosity photoionised by the quasar. Examples of both situations exist at lower redshifts ( 3; refs. 2,3,4). Virtually any model galaxy in which the spectrum is dominated by young stars is a reasonable match to the data. Fig. 4a shows a typical fit obtained for a yr old model galaxy with metallicity and a constant star formation rate of . In this case, the onset of star formation would have occurred at (again for = 1 and = 0.5). However, in starburst galaxy models the fraction of the -band flux contributed by Ly emission is always less than 50 %, i.e., much smaller than observed. Therefore such models alone cannot explain the data.
Alternative models of a pure photoionised nebula also present some shortcomings. If the and luminosities are assumed to be produced by reprocessing of the quasar’s ionising radiation alone (Fig. 4b shows such a model in which the reflecting cloud has a metallicity of ), the predicted Ly emission is so strong that acceptable fits of the band flux can be obtained only after assuming that a substantial fraction of Ly photons are removed from the line of sight, because, for example, of orientation effects or absorption by dust.16 Arguing for a small filling factor of the cloud (see above) would not affect this conclusion because this would imply similar changes in both the Ly and continuum fluxes. The [O ii] 3727 flux predicted for the model in Figure 4b, 510-18 erg cm-2 s-1, is consistent with previous limits.6 The strong predicted N v emission could have been marginally detected (assuming that the cloud has zero metallicity would remove not only N v but also C iv emission, hence worsening the fit of the -band flux). More important, in addition, is that the model cannot reproduce the observed magnitude. Hence, although the Ly emission is most probably a consequence of the excitation by the ionising flux from the quasar, we conclude that an additional source of continuum is likely to be present.
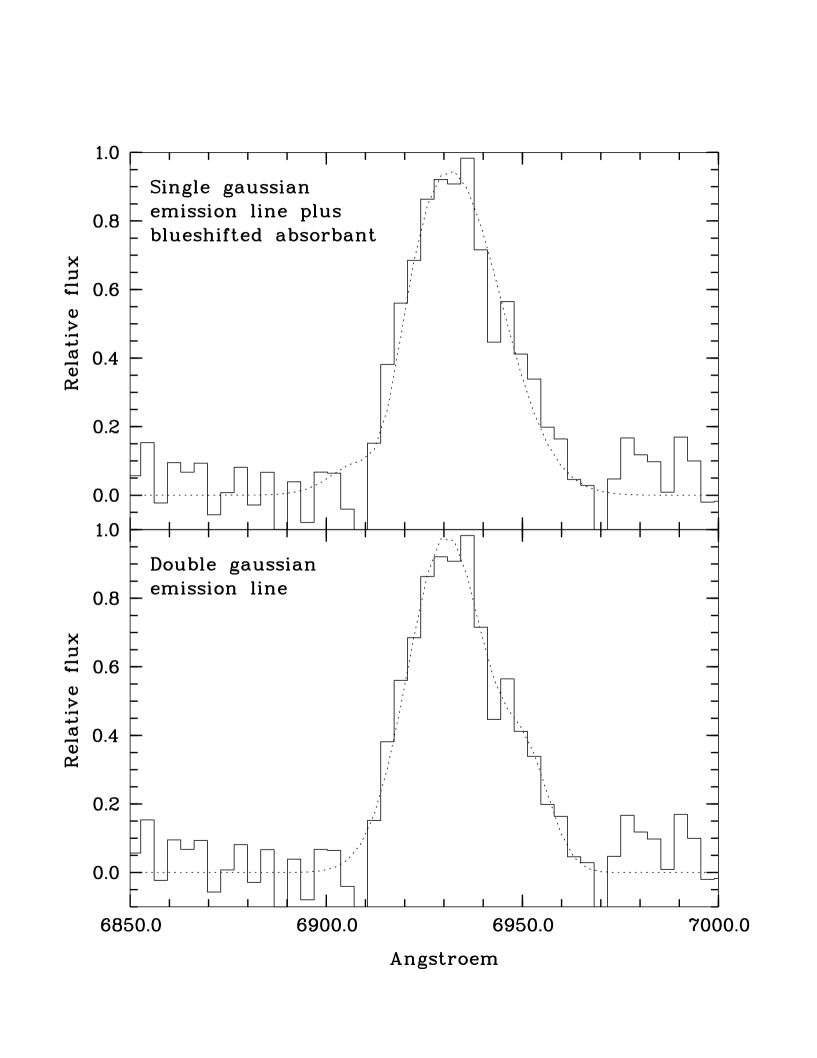
A possibility is that part of the continuum light from the quasar is scattered in our direction, potentially by dust. In fact, a large amount of dust has been detected in the quasar by continuum emission at millimetric and sub-millimetric wavelengths.24,25 New observations suggest that the emission is elongated towards the companion (A. Omont et al., mss in preparation), also indicating a large concentration of gas in that direction. We note that, by analogy with radio-galaxies, the ultraviolet continuum light of the companion could result from both scattered light and stellar emission.26 The width of the Ly line (more than 1000 km s-1, see Fig. 2) indicates strong disturbances of the kinematics of the gas. This all together suggests that we are witnessing the first stages in the build-up of a galaxy-sized structure.
We thank S. D’Odorico, S. Djorgovski and A. Omont for providing us with information prior to publication. We also thank P. Madau for computing the transmission curve at . The observations have been collected at the Canada-France-Hawaii Telescope, which is operated by CNRS of France, NRC of Canada, and the University of Hawaii.
References
1. Haehnelt, M. & Rees M.J. MNRAS 263, 168–178 (1993)
2. Djorgovski, S., Spinrad, H., McCarthy P. & Strauss, M.A. Astrophys. J. 299, L1–L5 (1985)
3. Steidel, C.C., Sargent, W.L.W. & Dickinson, M. Astron. J. 101, 1187–1195 (1991)
4. Møller, P. & Warren, S.J. Astr. Astrophys. 270, 43–52 (1993)
5. Irwin, M.J., McMahon, R.G. & Hazard, C. in The Space Distribution of Quasars (ed Crampton, D.) 21, 117–126 (ASP Conf. Ser., 1991)
6. Pahre, M.A. & Djorgovski, S.G. Astrophys. J. 449, L1–L4 (1995)
7. Wampler, E.J., Williger, G.M., Baldwin, J.A., Carswell, R.F., Hazard, C. & McMahon, R.G. Astr. Astrophys., in the press (1996)
8. Giallongo, E., D’Odorico, S., Fontana, A., McMahon, R.G., Savaglio, S., Cristiani, S., Molaro, P. & Trevese, D. Astrophys. J. 425, L1–L4 (1994)
9. Bacon, R. et al. Astr. Astrophys. Suppl. Ser. 113, 347-357 (1995)
10. Ferruit, P. & Pécontal, E. Astron. Astrophys. 288, 65-76 (1994)
11. Bacon, R., Emsellem, E., Monnet, G. & Nieto, J.L. Astr. Astrophys. 281, 691–712 (1994)
12. Lu, L., Sargent, W.L.W., Womble, D.S. & Barlow, T.A. Astrophys. J. 457, L1 (1996)
13. Wolfe, A.M. Astrophys. J. 402, 411–419 (1993)
14. Pettini, M., Hunstead, R.W., King, D.L. & Smith, L.J. in QSO Absorption Lines (ed Meylan, G.) 55–58 (ESO, 1995)
15. Lowenthal, J.D. et al. Astrophys. J. 451 484–497 (1995)
16. Charlot, S., & Fall, S.M. Astrophys. J. 415, 580–588 (1993)
17. Valls–Gabaud, D. Astrophys. J. 419, 7–11 (1993)
18. Fontana, A., Cristiani, S., D’Odorico, S., Giallongo, E. & Savaglio, S. Mon. Not. R. astr. Soc., in the press (1996)
19. Djorgovski, S.G. in Science with VLT (eds Walsh, J.R. & Danziger, J.) 351–360 (ESO, 1995)
20. Hu, E.M., McMahon R.G. & Egami E. Astrophys. J. Letters, in the press (1996)
21. Hu, E.M., Songaila, A., Cowie, L.L. & Stockton, A. Astrophys. J. 368, 28–39 (1991)
22. Thompson, D., Djorgovski, S. & Trauger, J. Astr. J. 110, 963–981 (1995)
23. Pritchet, C.J. PASP 106, 1052–1067 (1994)
24. McMahon, R.G., Omont, A., Bergeron, J., Kreysa, E. & Haslam, C.G.T. Mon. Not. R. astr. Soc. 267, L9–L12 (1994)
25. Isaak, K.G., McMahon, R.G., Hills, R.E. & Withington, S. Mon. Not. R. astr. Soc. 269, L28–L32 (1994)
26. McCarthy, P.J., Ann. Rev. Astron. Astrophys. 31, 639-688 (1993)
27. Ferland, G.J. University of Kentucky Department of Physics & Astronomy Internal Report (1993)
28. Madau, P. Astrophys. J. 441, 18–27 (1995)